Icons for Memory Dump Analysis Patterns (Part 66)

September 2nd, 2010

Today we introduce an icon for Manual Dump (kernel) pattern:

B/W

Color

- Dmitry Vostokov @ DumpAnalysis.org + TraceAnalysis.org -

The Memory Visualization Question from Webinar

September 1st, 2010

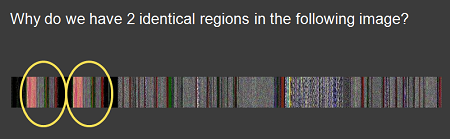
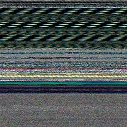
If you attended Fundamentals of Complete Crash and Hang Memory Dump Analysis you probably remember the memory dump visualization question that I repeat here on this slide fragment:

I got a few responses:

“Unfortunately they are not identical - visual inspection shows that. I tried differencing the relevant sub-images in Photoshop and I can’t get zero.  Of course this can be due to compression artifacts and, more likely, the fact that the duplication is not required to be aligned to the borders. A stronger confirmation/refutation would require unrolling the bitmap to one dimension and sliding it back and forth until maximum correlation is found. Since I have not done the examples step by step, I am left guessing about just what the dump you show illustrates. An aliased memory mapped area is my first guess, and a flip/flop garbage collector is my second.”

“perhaps some module such as a .NET assembly is getting loaded twice in a .NET app, pre .NET 4, such as is dicsussed in this thread:
http://forum.sysinternals.com/why-some-net-assemblies-are-duplicated-in-memory_topic15279_post121591.html

Initially I also thought that there was the same module loaded twice from different location like in Duplicated Module pattern. Unfortunately lm command didn’t show any duplicated loaded and unloaded modules as well as any hidden modules. So I looked at address information and found two identical relatively large regions at the beginning:

0:000> !address
[...]
BaseAddress EndAddress+1 RegionSize Type       State      Protect       Usage
[...]
0`00470000  0`007f0000   0`00380000 MEM_MAPPED MEM_COMMIT PAGE_READONLY <unclassified>
[…]
0`01f10000  0`02290000   0`00380000 MEM_MAPPED MEM_COMMIT PAGE_READONLY <unclassified>
[…]

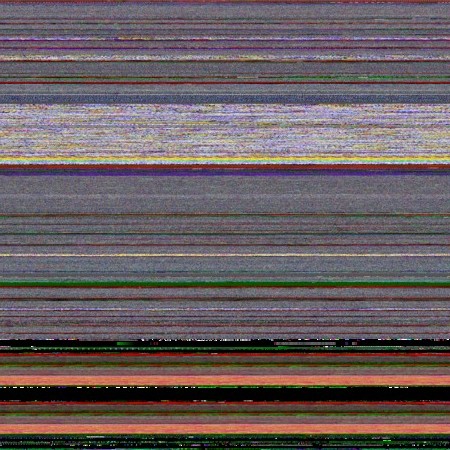
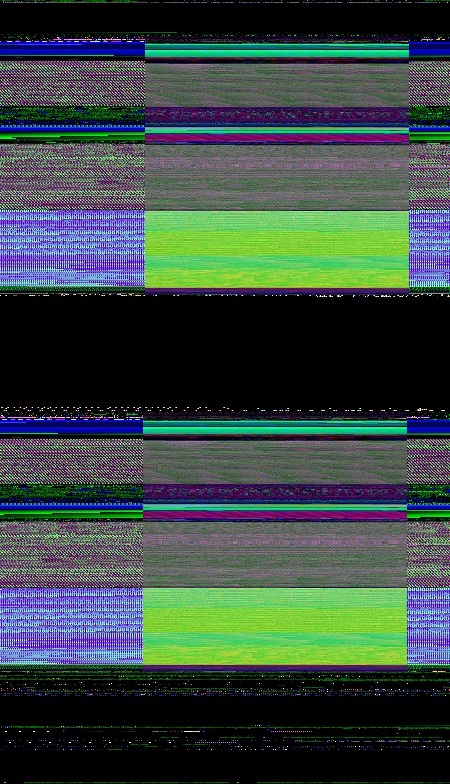
The image above was scaled by ImageMagic from a bitmap generated by Dump2Picture:

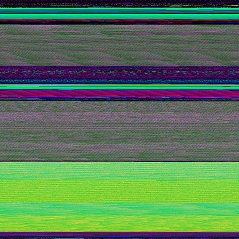
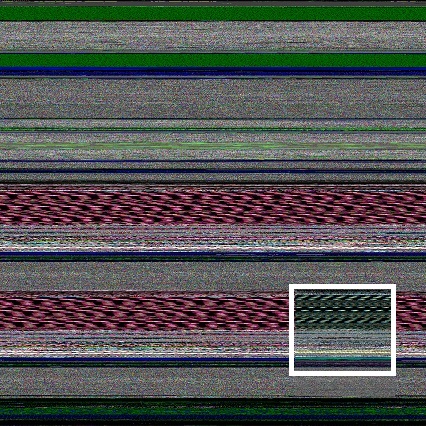
The original image from Dump2Picture had different colors:

I quickly checked the colorimetric structure of those regions: 0`00470000  0`007f0000 and 0`01f10000  0`02290000 using MemPicture WinDbg script and they seem to conform with the magnified picture above:

0:000> $$>a< d:\Dump2Picture\mempicture.txt 0`00470000 L?0`007f0000-0`00470000
Writing 380000 bytes

C:\Program Files\Debugging Tools for Windows (x64)>dump2picture d2p-range.bin d2p-range.bmp

Dump2Picture version 1.1
Written by Dmitry Vostokov, 2007

d2p-range.bmp
d2p-range.bin
        1 file(s) copied.

C:\Program Files\Debugging Tools for Windows (x64)>d2p-range.bmp
.shell: Process exited

Here is the magnified slice from the original picture:

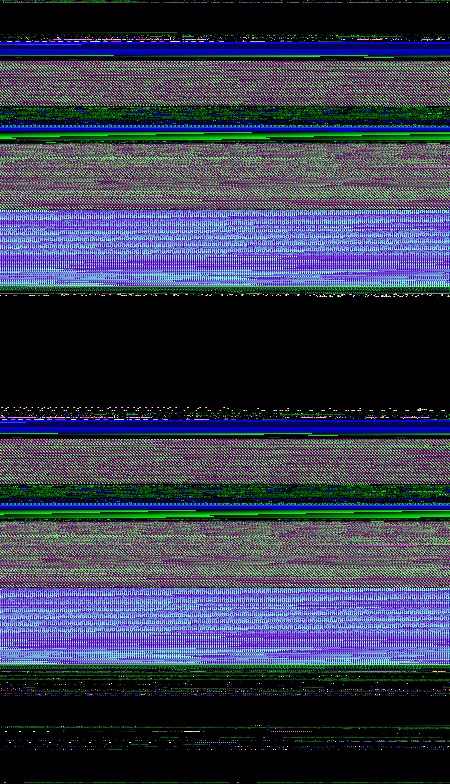
We see the same partitioning if we juxtapose the original picture and the picture of the address region:

Also these regions are completely identical if we compare their data:

0:000> c 0`00470000 L?(0`007f0000-0`00470000)/8 0`01f10000

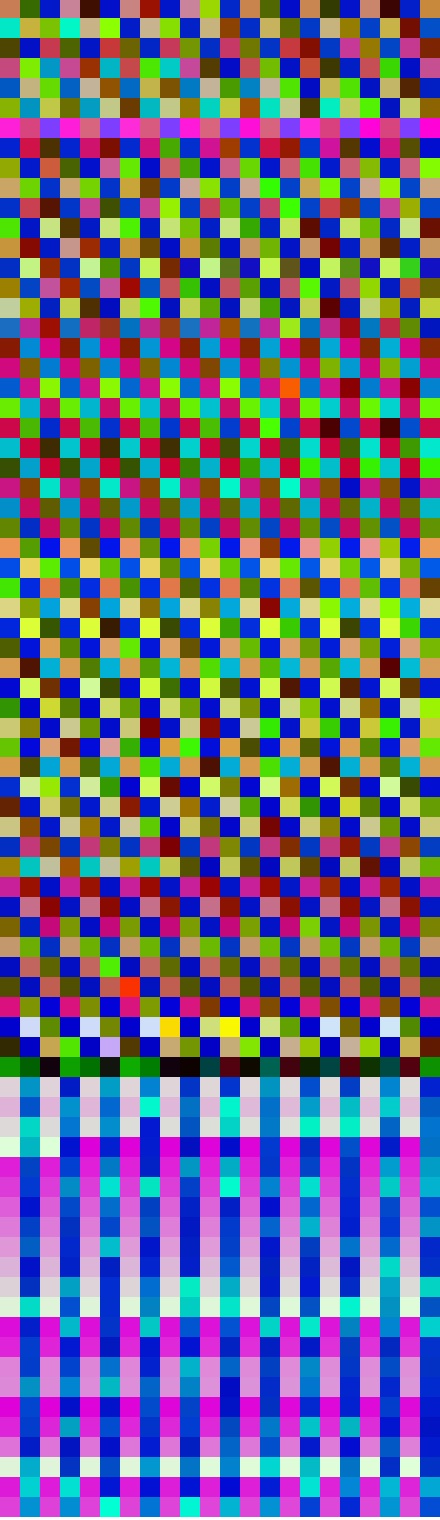
So it looks like some file was mapped twice. Inspected via dc command it shows remarkable regularity not seen in executable modules. This regularity also manifests itself in color:


In order to verify I modeled this by writing a simple program that maps a file twice passed as a command line parameter:

int _tmain(int argc, _TCHAR* argv[])
{
 if (argc < 2)
 {
  puts("Usage: MappedFiles.exe <File_Name_To_Map>\n");
  return -1;
 }

 HANDLE hf = CreateFile(argv[1], GENERIC_READ, FILE_SHARE_READ, NULL, OPEN_EXISTING, FILE_ATTRIBUTE_NORMAL, NULL);
 HANDLE hm = CreateFileMapping(hf, NULL, PAGE_READONLY, 0, 0, NULL);
 MapViewOfFile(hm, FILE_MAP_READ, 0, 0, 0);

 hf = CreateFile(argv[1], GENERIC_READ, FILE_SHARE_READ, NULL, OPEN_EXISTING, FILE_ATTRIBUTE_NORMAL, NULL);
 hm = CreateFileMapping(hf, NULL, PAGE_READONLY, 0, 0, NULL);
 MapViewOfFile(hm, FILE_MAP_READ, 0, 0, 0);

 DebugBreak();
 return 0;
}

I ran it and chose to map explorer.exe because it was a sufficiently large image file:

C:\MappedFiles\Release>MappedFiles.exe c:\windows\explorer.exe

The dump file was saved and its processing shows this picture:


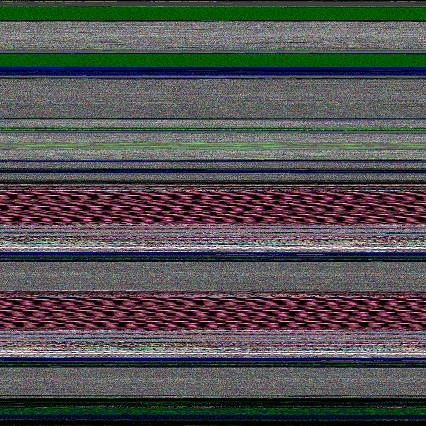
We clearly see identical regions and double check them from the dump file:

0:000> !address
BaseAddr EndAddr+1 RgnSize Type       State         Protect       Usage
[...]
a60000   d1d000    2bd000  MEM_MAPPED MEM_COMMIT    PAGE_READONLY <unclassified>
d1d000   d20000    3000    MEM_FREE   PAGE_NOACCESS Free
d20000   fdd000    2bd000  MEM_MAPPED MEM_COMMIT    PAGE_READONLY <unclassified>
[…] 

0:000> $$>a< d:\Dump2Picture\mempicture.txt 0`00470000 L?0`007f0000-0`00470000
Writing 380000 bytes

C:\Program Files\Debugging Tools for Windows (x64)>dump2picture d2p-range.bin d2p-range.bmp 

Dump2Picture version 1.1
Written by Dmitry Vostokov, 2007

d2p-range.bmp
d2p-range.bin
        1 file(s) copied.

C:\Program Files\Debugging Tools for Windows (x64)>d2p-range.bmp
.shell: Process exited


We see the same partitioning if we juxtapose results:

The application can be downloaded from here: MappedFiles.zip

- Dmitry Vostokov @ DumpAnalysis.org + TraceAnalysis.org -

Q&A from Fundamentals of Complete Crash and Hang Memory Dump Analysis Webinar

August 31st, 2010

Finally I compiled a Questions and Answers page with all necessary links and examples during the weekend:

http://www.dumpanalysis.com/FCMDA-Q-A

I also added text versions of logs (in addition to zip files) to a Webinar materials page:

http://www.dumpanalysis.com/FCMDA-materials

- Dmitry Vostokov @ DumpAnalysis.org + TraceAnalysis.org -

Software Glitches as Art

August 30th, 2010

Just noticed this little book and ordered it to browse and write a review later Glitch: Designing Imperfection

Notice the patterns with glitches on the cover similar to the fabric of memory and some pictures from inside remind me natural memory visualization images you can find in the print form in DLL List Landscape: The Art from Computer Memory Space book. I would therefore welcome the fact that the memory space art has more and more followers (and becomes the true art movement according to the institutional theory of art). There are more art books coming later this year:

  • Patterns of Computer Memory (ISBN: 978-1906717711)

  • Spikes, Hangs, Crashes, Leaks and Dumps of Imagination: The Art of the Debugging Art (ISBN: 978-1906717841)

  • Also the museum of debugging and memory dumps will hold an exhibition soon.

    In a few days the following book about glitches (as negative business impact annoyances) will be released:

    Glitch: The Hidden Impact of Faulty Software

    “Search inside the book” on Amazon suggests that the latter book doesn’t consider the positive impact of glitches including art but, anyway, because of my speciality in software debugging and maintenance I would like to review that book too.

    - Dmitry Vostokov @ DumpAnalysis.org + TraceAnalysis.org -

    Icons for Memory Dump Analysis Patterns (Part 65)

    August 27th, 2010

    Today we introduce an icon for Special Stack Trace pattern:

    B/W

    Color

    - Dmitry Vostokov @ DumpAnalysis.org + TraceAnalysis.org -

    Windows is waiting for the end of the century

    August 27th, 2010

    I was inspecting the list of timers in a complete memory dump and found that in x64 W2K8 R2 (it may be also in other versions) there is a timer set to fire for the end of our century 2001 - 2100:

    1: kd> !timer
    Dump system timers
    [...]
        fffff80001c31b80   f690c4d5 0064364d [12/31/2099 23:00:00.510]  nt!ExpCenturyDpcRoutine (DPC @ fffff80001c31bc0)
    […]

    Its disassembly shows at that time the following work item will be executed:

    1: kd> uf nt!ExpCenturyDpcRoutine
    [...] 
    fffff800`01ae81ab 488d0dae991400  lea     rcx,[nt!ExpCenturyWorkItem (fffff800`01c31b60)]
    [...]

    I don’t want to dig myself far into the details here :-) May be someone from MS provides some comments what we should expect at the turn of the century? What should I tell my children to expect if they still run the Windows OS?

    PS. Long live the Windows OS! (my the most sincere comment; no pun intended).

    - Dmitry Vostokov @ DumpAnalysis.org + TraceAnalysis.org -

    Trace Analysis Patterns (Part 27)

    August 27th, 2010

    Like in a literature (and in a narratology in general) we have components that trace themselves and components that tell the story of a computation including status updates they query about other components and subsystems. This pattern gets its name Diegetic Messages from diegesis. Here’s the difference between diegetic (in blue bold) and non-diegetic trace messages:

    PID    TID    TIME          MESSAGE     
    11864  11912  06:34:53.598  ModuleA: foo called bar. Status OK.
    11620  10372  06:34:59.754  ModuleB: ModuleA integrity check. Status OK.

    Some modules may emit messages that tell about their status but from their message text we know the larger computation story like in a process startup sequence example.  

    - Dmitry Vostokov @ DumpAnalysis.org + TraceAnalysis.org -

    Presentation and logs from Webinar: Fundamentals of Complete Crash and Hang Memory Dump Analysis

    August 23rd, 2010

    The presentation materials from the webinar (18th and 23rd of August, 2010) are available for download:

    http://www.dumpanalysis.com/FCMDA-materials

    Thanks to everyone who registered and attended!

    - Dmitry Vostokov @ DumpAnalysis.org + TraceAnalysis.org -

    New Design of Online Debugged! Magazine

    August 21st, 2010

    The online version of Debugged! MZ/PE) underwent the total redesign:

    - Dmitry Vostokov @ DumpAnalysis.org + TraceAnalysis.org -

    Windows 7 Device Driver Book

    August 19th, 2010

    Addison-Wesley is publishing early next year this book:

    Windows 7 Device Driver (Addison-Wesley Microsoft Technology Series)

    From TOC on the publisher website it looks like it mainly covers WDF: KMDF + UMDF.

    - Dmitry Vostokov @ DumpAnalysis.org + TraceAnalysis.org -

    Icons for Memory Dump Analysis Patterns (Part 64)

    August 19th, 2010

    Today we introduce an icon for Custom Exception Handler (user space) pattern:

    B/W

    Color

    - Dmitry Vostokov @ DumpAnalysis.org + TraceAnalysis.org -

    Webinar: Fundamentals of Complete Crash and Hang Memory Dump Analysis (Second Session)

    August 18th, 2010

    Do to the attendee limit not all registered for the first session were able to attend. The second session is available:

    Date: 23rd of August 2010
    Time: 19:00 (BST) 14:00 (Eastern) 11:00 (Pacific)
    Duration: 90 minutes

    Space is limited.
    Reserve your Webinar seat now at:
    https://www1.gotomeeting.com/register/823155577

    After the second session webinar slides will be published and later a Q&A page will be compiled.

    - Dmitry Vostokov @ DumpAnalysis.org + TraceAnalysis.org -

    Modeling C++ Object Corruption

    August 18th, 2010

    Having encountered several crash dumps with the code running on heap and the following similar stack traces

    1: kd> k
      *** Stack trace for last set context - .thread/.cxr resets it
    ChildEBP RetAddr  Args to Child             
    WARNING: Frame IP not in any known module. Following frames may be wrong.
    02cdfbfc 0056511a 0x634648
    02cdfc24 005651a1 ModuleA!ClassA::~ClassA+0x5a
    02cdfc30 00562563 ModuleA!ClassA::`scalar deleting destructor'+0x11
    [...]
    02cdffec 00000000 kernel32!BaseThreadStart+0x37

    I decided to model this situation. The idea was to corrupt a class member by overriding its vtable pointer with a heap entry address. Because the virtual destructor address is a first virtual method table entry in our class memory layout I made sure that it points to the same heap address by making vtable pointer a dereference fixpoint. Here is a source code based on how Visual C++ compiler implements objects in memory:

    class Member {
    public:
        virtual ~Member() { data = 1; };
    public:
        int data;
    };

    class Compound {
    public:
        Compound(): pm(NULL) { pm = new Member(); }
        virtual ~Compound() { delete pm; }
        void Corrupt() {
            unsigned int * pbuf = new unsigned int[0x10];
            *pbuf = reinterpret_cast<unsigned int>(pbuf); // to ensure that the code would run through pbuf pointer
            *reinterpret_cast<unsigned int *>(pm) = reinterpret_cast<unsigned int>(pbuf);
        }
        Member *pm;
    };

    int _tmain(int argc, _TCHAR* argv[])
    {
        Compound *pc = new Compound();
        pc->Corrupt();
        delete pc;
        return 0;
    }

    In a crash dump we therefore see the similar stack trace:

    0:000> .ecxr
    eax=001f4c28 ebx=7efde000 ecx=001f4c18 edx=001f4c28 esi=00000000 edi=00000000
    eip=001f4c28 esp=003cf7d0 ebp=003cf7e8 iopl=0 nv up ei pl nz na pe nc
    cs=0023 ss=002b ds=002b es=002b fs=0053 gs=002b efl=00010206
    001f4c28 284c1f00        sub     byte ptr [edi+ebx],cl      ds:002b:7efde000=00

    0:000> k
      *** Stack trace for last set context - .thread/.cxr resets it
    ChildEBP RetAddr  Args to Child             
    WARNING: Frame IP not in any known module. Following frames may be wrong.
    003cf7cc 011d10e5 0×1f4c28
    003cf7e8 011d114f Destructors!Compound::~Compound+0×35
    003cf7f4 011d121e Destructors!Compound::`scalar deleting destructor’+0xf
    003cf82c 011d1498 Destructors!wmain+0×8e
    003cf874 77043677 Destructors!__tmainCRTStartup+0xfa
    003cf880 77719d72 kernel32!BaseThreadInitThunk+0xe
    003cf8c0 77719d45 ntdll!__RtlUserThreadStart+0×70
    003cf8d8 00000000 ntdll!_RtlUserThreadStart+0×1b

    We now check the correctness of the stack trace by examining the return addresses:

    0:000> .asm no_code_bytes
    Assembly options: no_code_bytes

    0:000> ub 011d10e5
    Destructors!Compound::~Compound+0×21:
    011d10d1 cmp  dword ptr [ebp-4],0
    011d10d5 je   Destructors!Compound::~Compound+0×3a (011d10ea)
    011d10d7 push 1
    011d10d9 mov  ecx,dword ptr [ebp-4]
    011d10dc mov  edx,dword ptr [ecx]
    011d10de mov  ecx,dword ptr [ebp-4]
    011d10e1 mov  eax,dword ptr [edx]
    011d10e3 call eax

    0:000> ub 011d114f
    Destructors!Compound::Corrupt+0×3e:
    011d113e int  3
    011d113f int  3
    Destructors!Compound::`scalar deleting destructor’:
    011d1140 push ebp
    011d1141 mov  ebp,esp
    011d1143 push ecx
    011d1144 mov  dword ptr [ebp-4],ecx
    011d1147 mov  ecx,dword ptr [ebp-4]
    011d114a call Destructors!Compound::~Compound (011d10b0)

    We now examine the crash address:

    0:000> u 001f4c28
    001f4c28 sub  byte ptr [edi+ebx],cl
    001f4c2c les  eax,fword ptr [eax]
    001f4c2e pop  ds
    001f4c2f add  byte ptr [eax],al
    001f4c31 add  byte ptr [eax],al
    001f4c33 add  byte ptr [eax],al
    001f4c35 add  byte ptr [eax],al
    001f4c37 add  byte ptr [eax],al

    Then we check that it resides in a heap segment:

    0:000> dt _PEB 7efde000
    Destructors!_PEB
    [...]
      +0x088 NumberOfHeaps : 2
      +0x08c MaximumNumberOfHeaps : 0x10
      +0x090 ProcessHeaps : 0x777e4740 -> 0x004b0000 Void
    [...]

    0:000> dd 0x777e4740 l2
    777e4740 004b0000 001f0000

    0:000> !heap 001f0000
    Index Address Name Debugging options enabled
      2: 001f0000
      Segment at 001f0000 to 00200000 (00005000 bytes committed)

    Now we check vtable to see that it was normal for Compound object but corrupt for Member object:

    0:000> .frame 1
    01 003cf7e8 011d114f Destructors!Compound::~Compound+0x35

    0:000> dv /i /V
    prv local  003cf7dc @ebp-0x0c            this = 0x001f4c08
    0:000> dt Destructors!Compound 0x001f4c08
       +0x000 __VFN_table : 0x011daa0c
       +0x004 pm               : 0x001f4c18 Member

    0:000> dps 0x001f4c08 l1
    001f4c08  011daa0c Destructors!Compound::`vftable'

    0:000> dps 0x001f4c18 l1
    001f4c18  001f4c28

    0:000> dps 001f4c28 l1
    001f4c28  001f4c28

    The application, its source code and PDB file are available for download here.

    - Dmitry Vostokov @ DumpAnalysis.org + TraceAnalysis.org -

    Hot Computation: Memory On Fire

    August 17th, 2010

    - Dmitry Vostokov @ DumpAnalysis.org + TraceAnalysis.org -

    Picture Frame for Memory Dumps

    August 17th, 2010

    - Dmitry Vostokov @ DumpAnalysis.org + TraceAnalysis.org -

    ALPC wait chains, missing threads, waiting thread time and semantic process coupling: pattern cooperation

    August 16th, 2010

    In a complete memory dump we could see ALPC wait chains leading to ServiceA.exe process with a queue of 372 messages. Additionally we could also see ServiceB.exe process waiting for ServiceC.exe with the latter having a queue of 201 messages. Threads that were supposed to process some messages didn’t exist. ServiceC process had a thread that was waiting for ServiceA.exe as well. But there was no any indication for a thread-2-thread deadlock. We could also see that threads waiting for ServiceA.exe sometimes had the greater waiting time than threads waiting for ServiceC so it could be the case that the problem initially started with ServiceA.exe. However, after more thorough analysis we could also see several terminating ApplicationD.exe processes with just one thread waiting in ModuleE with the waiting time exceeding the waiting time of blocked threads waiting for ServiceA and ServiceC. Because of semantic process coupling between ServiceA and ApplicationD it was decided that ModuleE was responsible and its vendor was contacted for updates.

    - Dmitry Vostokov @ DumpAnalysis.org + TraceAnalysis.org -

    Bugtation No.124

    August 16th, 2010

    Madness, the absence of memory dumps.

    Michel Foucault

    - Dmitry Vostokov @ DumpAnalysis.org + TraceAnalysis.org -

    4 Years of Blogging!

    August 14th, 2010

    Today I celebrated 4 years of blogging that resulted in more than 2,000 posts across 8 blogs. I would like to thank everyone for their continuing support!

    The updated timeline

    This blog post belongs to the 5th year of blogging.

    - Dmitry Vostokov @ DumpAnalysis.org + TraceAnalysis.org -

    Bleeding Memory

    August 12th, 2010

    Under microscope:

    - Dmitry Vostokov @ DumpAnalysis.org + TraceAnalysis.org -

    Memory Interfaces

    August 12th, 2010

    - Dmitry Vostokov @ DumpAnalysis.org + TraceAnalysis.org -