Archive for October, 2012

Crash Dump Analysis Patterns (Part 184)
Wednesday, October 31st, 2012Looks like Windows 8 reuses the debugging concept of a frozen thread for the so called a “deeply frozen” process:
0: kd> !sprocess 2

Dumping Session 2

[...]

PROCESS fffffa8002cb2940

SessionId: 2  Cid: 0c80    Peb: 7f6c41dd000  ParentCid: 0288

DeepFreeze

DirBase: 2ef45000  ObjectTable: fffff8a002f215c0  HandleCount: <Data Not Accessible>

Image: iexplore.exe

[…]
0: kd> dt nt!_KPROCESS fffffa8002cb2940

+0x000 Header           : _DISPATCHER_HEADER

+0x018 ProfileListHead  : _LIST_ENTRY [ 0xfffffa80`02cb2958 - 0xfffffa80`02cb2958 ]

+0x028 DirectoryTableBase : 0x2ef45000

+0x030 ThreadListHead   : _LIST_ENTRY [ 0xfffffa80`01e4edf8 - 0xfffffa80`01f5bbf8 ]

+0x040 ProcessLock      : 0

+0x044 Spare0           : 0

+0x048 Affinity         : _KAFFINITY_EX

+0x0f0 ReadyListHead    : _LIST_ENTRY [ 0xfffffa80`02cb2a30 - 0xfffffa80`02cb2a30 ]

+0x100 SwapListEntry    : _SINGLE_LIST_ENTRY

+0x108 ActiveProcessors : _KAFFINITY_EX

+0x1b0 AutoAlignment    : 0y0

+0x1b0 DisableBoost     : 0y0

+0x1b0 DisableQuantum   : 0y0

+0x1b0 AffinitySet      : 0y0

+0×1b0 DeepFreeze       : 0y1

+0×1b0 TimerVirtualization : 0y1

+0×1b0 ActiveGroupsMask : 0y00000000000000000001 (0×1)

+0×1b0 ReservedFlags    : 0y000000 (0)

+0×1b0 ProcessFlags     : 0n112

+0×1b4 BasePriority     : 8 ”

+0×1b5 QuantumReset     : 6 ”

+0×1b6 Visited          : 0 ”

+0×1b7 Flags            : _KEXECUTE_OPTIONS

+0×1b8 ThreadSeed       : [20] 0

+0×208 IdealNode        : [20] 0

+0×230 IdealGlobalNode  : 0

+0×232 Spare1           : 0

+0×234 StackCount       : _KSTACK_COUNT

+0×238 ProcessListEntry : _LIST_ENTRY [ 0xfffffa80`03816b78 - 0xfffffa80`02cc2b78 ]

+0×248 CycleTime        : 0×225078

+0×250 ContextSwitches  : 0×22

+0×258 SchedulingGroup  : (null)

+0×260 FreezeCount      : 0

+0×264 KernelTime       : 0

+0×268 UserTime         : 0

+0×26c LdtFreeSelectorHint : 0

+0×26e LdtTableLength   : 0

+0×270 LdtSystemDescriptor : _KGDTENTRY64

+0×280 LdtBaseAddress   : (null)

+0×288 LdtProcessLock   : _FAST_MUTEX

+0×2c0 InstrumentationCallback : (null)
We also see that all its threads have a freeze count 1:
0: kd> !process fffffa8002cb2940 2

[...]

THREAD fffffa8001e4eb00  Cid 0c80.0514  Teb: 000007f6c41de000 Win32Thread: fffff901000e5b90 WAIT: (Suspended) KernelMode Non-Alertable

FreezeCount 1

fffffa8001e4ede0  NotificationEvent
THREAD fffffa800219c080  Cid 0c80.0d88  Teb: 000007f6c41db000 Win32Thread: fffff90103f206e0 WAIT: (Suspended) KernelMode Non-Alertable

FreezeCount 1

fffffa800219c360  NotificationEvent

[…]
0: kd> dt _KTHREAD fffffa800219c080

nt!_KTHREAD

+0x000 Header           : _DISPATCHER_HEADER

+0x018 SListFaultAddress : (null)

+0x020 QuantumTarget    : 0x18c26200

+0x028 InitialStack     : 0xfffff880`1548ddd0 Void

+0x030 StackLimit       : 0xfffff880`15488000 Void

+0x038 StackBase        : 0xfffff880`1548e000 Void

+0x040 ThreadLock       : 0

+0x048 CycleTime        : 0x15ca97c8

+0x050 CurrentRunTime   : 0

+0x054 ExpectedRunTime  : 0xd77e

+0x058 KernelStack      : 0xfffff880`1548d430 Void

+0x060 StateSaveArea    : 0xfffff880`1548de00 _XSAVE_FORMAT

+0x068 SchedulingGroup  : (null)

+0x070 WaitRegister     : _KWAIT_STATUS_REGISTER

+0x071 Running          : 0 ''

+0x072 Alerted          : [2]  ""

+0x074 KernelStackResident : 0y1

+0x074 ReadyTransition  : 0y0

+0x074 ProcessReadyQueue : 0y0

+0x074 WaitNext         : 0y0

+0x074 SystemAffinityActive : 0y0

+0x074 Alertable        : 0y0

+0x074 CodePatchInProgress : 0y0

+0x074 UserStackWalkActive : 0y0

+0x074 ApcInterruptRequest : 0y0

+0x074 QuantumEndMigrate : 0y0

+0x074 UmsDirectedSwitchEnable : 0y0

+0x074 TimerActive      : 0y0

+0x074 SystemThread     : 0y0

+0x074 ProcessDetachActive : 0y0

+0x074 CalloutActive    : 0y0

+0x074 ScbReadyQueue    : 0y0

+0x074 ApcQueueable     : 0y1

+0x074 ReservedStackInUse : 0y0

+0x074 UmsPerformingSyscall : 0y0

+0x074 Reserved         : 0y0000000000000 (0)

+0x074 MiscFlags        : 0n65537

+0x078 AutoAlignment    : 0y0

+0x078 DisableBoost     : 0y0

+0x078 UserAffinitySet  : 0y0

+0x078 AlertedByThreadId : 0y0

+0x078 QuantumDonation  : 0y0

+0x078 EnableStackSwap  : 0y1

+0x078 GuiThread        : 0y1

+0x078 DisableQuantum   : 0y0

+0x078 ChargeOnlyGroup  : 0y0

+0x078 DeferPreemption  : 0y0

+0x078 QueueDeferPreemption : 0y0

+0x078 ForceDeferSchedule : 0y0

+0x078 ExplicitIdealProcessor : 0y0

+0×078 FreezeCount      : 0y1

+0×078 EtwStackTraceApcInserted : 0y00000000 (0)

+0×078 ReservedFlags    : 0y0000000000 (0)

+0×078 ThreadFlags      : 0n8288

+0×07c Spare0           : 0

+0×080 SystemCallNumber : 0×87

+0×084 Spare1           : 0

+0×088 FirstArgument    : 0×00000000`0000017c Void

+0×090 TrapFrame        : (null)

+0×098 ApcState         : _KAPC_STATE

+0×098 ApcStateFill     : [43]  “???”

+0×0c3 Priority         : 8 ”

+0×0c4 UserIdealProcessor : 1

+0×0c8 WaitStatus       : 0n256

+0×0d0 WaitBlockList    : 0xfffffa80`0219c1c0 _KWAIT_BLOCK

+0×0d8 WaitListEntry    : _LIST_ENTRY [ 0xfffffa80`0418a458 - 0xfffff880`009eb300 ]

+0×0d8 SwapListEntry    : _SINGLE_LIST_ENTRY

+0×0e8 Queue            : 0xfffffa80`03da4bc0 _KQUEUE

+0×0f0 Teb              : 0×000007f6`c41db000 Void

+0×0f8 RelativeTimerBias : 0×00000001`8b165f54

+0×100 Timer            : _KTIMER

+0×140 WaitBlock        : [4] _KWAIT_BLOCK

+0×140 WaitBlockFill4   : [20]  “h???”

+0×154 ContextSwitches  : 0×1817

+0×140 WaitBlockFill5   : [68]  “h???”

+0×184 State            : 0×5 ”

+0×185 NpxState         : 1 ”

+0×186 WaitIrql         : 0 ”

+0×187 WaitMode         : 0 ”

+0×140 WaitBlockFill6   : [116]  “h???”

+0×1b4 WaitTime         : 0xf0172e

+0×140 WaitBlockFill7   : [164]  “h???”

+0×1e4 KernelApcDisable : 0n0

+0×1e6 SpecialApcDisable : 0n0

+0×1e4 CombinedApcDisable : 0

+0×140 WaitBlockFill8   : [40]  “h???”

+0×168 ThreadCounters   : (null)

+0×140 WaitBlockFill9   : [88]  “h???”

+0×198 XStateSave       : (null)

+0×140 WaitBlockFill10  : [136]  “h???”

+0×1c8 Win32Thread      : 0xfffff901`03f206e0 Void

+0×140 WaitBlockFill11  : [176]  “h???”

+0×1f0 Ucb              : (null)

+0×1f8 Uch              : (null)

+0×200 TebMappedLowVa   : (null)

+0×208 QueueListEntry   : _LIST_ENTRY [ 0xfffffa80`02ccf408 - 0xfffffa80`03da4bf0 ]

+0×218 NextProcessor    : 0

+0×21c DeferredProcessor : 1

+0×220 Process          : 0xfffffa80`02cb2940 _KPROCESS

+0×228 UserAffinity     : _GROUP_AFFINITY

+0×228 UserAffinityFill : [10]  “???”

+0×232 PreviousMode     : 1 ”

+0×233 BasePriority     : 8 ”

+0×234 PriorityDecrement : 0 ”

+0×234 ForegroundBoost  : 0y0000

+0×234 UnusualBoost     : 0y0000

+0×235 Preempted        : 0 ”

+0×236 AdjustReason     : 0 ”

+0×237 AdjustIncrement  : 0 ”

+0×238 Affinity         : _GROUP_AFFINITY

+0×238 AffinityFill     : [10]  “???”

+0×242 ApcStateIndex    : 0 ”

+0×243 WaitBlockCount   : 0×1 ”

+0×244 IdealProcessor   : 1

+0×248 ApcStatePointer  : [2] 0xfffffa80`0219c118 _KAPC_STATE

+0×258 SavedApcState    : _KAPC_STATE

+0×258 SavedApcStateFill : [43]  “???”

+0×283 WaitReason       : 0×5 ”

+0×284 SuspendCount     : 0 ”

+0×285 Saturation       : 0 ”

+0×286 SListFaultCount  : 0

+0×288 SchedulerApc     : _KAPC

+0×288 SchedulerApcFill0 : [1]  “??????”

+0×289 ResourceIndex    : 0×1 ”

+0×288 SchedulerApcFill1 : [3]  “???”

+0×28b QuantumReset     : 0×6 ”

+0×288 SchedulerApcFill2 : [4]  “???”

+0×28c KernelTime       : 7

+0×288 SchedulerApcFill3 : [64]  “???”

+0×2c8 WaitPrcb         : (null)

+0×288 SchedulerApcFill4 : [72]  “???”

+0×2d0 LegoData         : (null)

+0×288 SchedulerApcFill5 : [83]  “???”

+0×2db CallbackNestingLevel : 0 ”

+0×2dc UserTime         : 0xa

+0×2e0 SuspendEvent     : _KEVENT

+0×2f8 ThreadListEntry  : _LIST_ENTRY [ 0xfffffa80`01c41378 - 0xfffffa80`01e4edf8 ]

+0×308 MutantListHead   : _LIST_ENTRY [ 0xfffffa80`0219c388 - 0xfffffa80`0219c388 ]

+0×318 ReadOperationCount : 0n392

+0×320 WriteOperationCount : 0n321

+0×328 OtherOperationCount : 0n240

+0×330 ReadTransferCount : 0n1849338

+0×338 WriteTransferCount : 0n1197496

+0×340 OtherTransferCount : 0n4972
This is different when a process is under a debugger and all its threads are frozen except the one that communicates to the debugger like in this case study. In Windows 8 this happens, for example, when we switch to a desktop from IE launched from the start page. Then we would see shortly that iexplore.exe process changes from Running to Suspended in Task Manager Details page. We call this pattern Frozen Process to cover both the new feature and a debugged process case.
- Dmitry Vostokov @ DumpAnalysis.org + TraceAnalysis.org -
Stack Trace in Bible
Tuesday, October 30th, 2012Found in Matthew 1:2-16 (KJV):
0:000> k

RetAddr   Call Site

Jacob     Joseph

Matthan   Jacob

Eleazar   Matthan

Eliud     Eleazar

Achim     Eliud

Sadoc     Achim

Azor      Sadoc

Eliakim   Azor

Abiud     Eliakim

Zorobabel Abiud

Salathiel Zorobabel

Jechonias Salathiel

Josias    Jechonias

Amon      Josias

Manasses  Amon

Ezekias   Manasses

Achaz     Ezekias

Joatham   Achaz

Ozias     Joatham

Joram     Ozias

Josaphat  Joram

Asa       Josaphat

Abia      Asa

Roboam    Abia

Solomon   Roboam

David     Solomon

Jesse     David

Obed      Jesse

Booz      Obed

Salmon    Booz

Naasson   Salmon

Aminadab  Naasson

Aram      Aminadab

Esrom     Aram

Phares    Esrom

Judas     Phares

Jacob     Judas

Isaac     Jacob

Abraham   Isaac
- Dmitry Vostokov @ DumpAnalysis.org + TraceAnalysis.org -
After Debugging
Monday, October 29th, 2012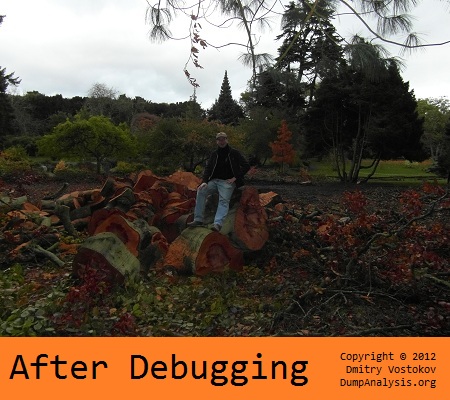
- Dmitry Vostokov @ DumpAnalysis.org + TraceAnalysis.org -
Pointers in Nature
Monday, October 29th, 2012
- Dmitry Vostokov @ DumpAnalysis.org + TraceAnalysis.org -
Improbable Occurrences (Part 1)
Saturday, October 27th, 2012I was analyzing a raw thread stack when came upon this symbolic address which I thought was coincidental:
363b0030 77777777 advapi32!LsaEnumerateAccountRights+0×56
Forward disasssembly makes sense, isn’t it? And every instruction seems have a purpose ![]()
0:000> u 77777777

advapi32!LsaEnumerateAccountRights+0×56:

77777777 a4              movs    byte ptr es:[edi],byte ptr [esi]

77777778 fc              cld

77777779 ffc3            inc     ebx

7777777b 8b65e8          mov     esp,dword ptr [ebp-18h]

7777777e ff75e0          push    dword ptr [ebp-20h]

77777781 ff15e4187377    call    dword ptr [advapi32!_imp__I_RpcMapWin32Status (777318e4)]

77777787 50              push    eax

77777788 e8c6f6fbff      call    advapi32!LsapApiReturnResult (77736e53)
- Dmitry Vostokov @ DumpAnalysis.org + TraceAnalysis.org -
Trace Analysis Patterns (Part 56)
Friday, October 26th, 2012If trace messages contain some character or formatted data that is passed from module to module or between threads and processes it is possible to trace that data and form a Data Flow thread similar to an adjoint thread we have when we filter by a specific message. However, in the former case we have different message types.
- Dmitry Vostokov @ DumpAnalysis.org + TraceAnalysis.org -
Incomplete session, ALPC and critical section wait chains, blocked thread and dialog box: pattern cooperation
Tuesday, October 23rd, 2012We resume our case studies involving multiple patterns. It was reported that a user couldn’t start a session. A complete memory dump was generated and we found 3 sessions there. Looking at the last one we found it incomplete with only 3 processes (a normal running user session after initialization was expected to have more than 3 processes):
0: kd> !session

Sessions on machine: 3

Valid Sessions: 0 1 2
0: kd> !sprocess 2

Dumping Session 2
_MM_SESSION_SPACE fffffa600a3e1000

_MMSESSION        fffffa600a3e1b40

PROCESS fffffa8007f6c040

SessionId: 2  Cid: 242c    Peb: 7fffffd8000  ParentCid: 2374

DirBase: 58350000  ObjectTable: fffff8800f485630  HandleCount: 192.

Image: csrss.exe
PROCESS fffffa8007de8130

SessionId: 2  Cid: 1a48    Peb: 7fffffde000  ParentCid: 2374

DirBase: 15755000  ObjectTable: fffff8800c742010  HandleCount: 240.

Image: winlogon.exe
PROCESS fffffa8004c2e4a0

SessionId: 2  Cid: 17b8    Peb: 7efdf000  ParentCid: 144c

DirBase: a3b80000  ObjectTable: fffff8800bf1d350  HandleCount: 168.

Image: AppA.exe
Looking at AppA process we find its main thread blocked in ALPC request directed to ServiceA process:
0: kd> !process fffffa8004c2e4a0 ff

PROCESS fffffa8004c2e4a0

SessionId: 2  Cid: 17b8    Peb: 7efdf000  ParentCid: 144c

DirBase: a3b80000  ObjectTable: fffff8800bf1d350  HandleCount: 168.

Image: AppA.exe

VadRoot fffffa8006d7f310 Vads 192 Clone 0 Private 572. Modified 2. Locked 0.

DeviceMap fffff88015685f30

Token                             fffff8800a245050

ElapsedTime                       01:58:00.200

UserTime                          00:00:00.000

KernelTime                        00:00:00.015

QuotaPoolUsage[PagedPool]         140256

QuotaPoolUsage[NonPagedPool]      18368

Working Set Sizes (now,min,max)  (2025, 50, 345) (8100KB, 200KB, 1380KB)

PeakWorkingSetSize                2087

VirtualSize                       74 Mb

PeakVirtualSize                   79 Mb

PageFaultCount                    2351

MemoryPriority                    BACKGROUND

BasePriority                      8

CommitCharge                      741

Job                               fffffa80063de710
THREAD fffffa8006db8440  Cid 17b8.20e0  Teb: 000000007efdb000 Win32Thread: fffff900c0b0c4f0 WAIT: (WrLpcReply) UserMode Non-Alertable

fffffa8006db87d0  Semaphore Limit 0x1

Waiting for reply to ALPC Message fffff8800f487cf0 : queued at port fffffa8004b37d90 : owned by process fffffa8004b11c10

Not impersonating

DeviceMap                 fffff88015685f30

Owning Process            fffffa8004c2e4a0       Image:         AppA.exe

Attached Process          N/A            Image:         N/A

Wait Start TickCount      4244174        Ticks: 453096 (0:01:57:59.625)

Context Switch Count      132                 LargeStack

UserTime                  00:00:00.031

KernelTime                00:00:00.109

Win32 Start Address AppA!WinMainCRTStartup (0×00000000658c9866)

Stack Init fffffa6008832db0 Current fffffa6008832670

Base fffffa6008833000 Limit fffffa600882a000 Call 0

Priority 10 BasePriority 8 PriorityDecrement 0 IoPriority 2 PagePriority 5

Kernel stack not resident.

Child-SP          RetAddr           Call Site

fffffa60`088326b0 fffff800`01e5ccfa nt!KiSwapContext+0×7f

fffffa60`088327f0 fffff800`01e519bb nt!KiSwapThread+0×13a

fffffa60`08832860 fffff800`01e86b12 nt!KeWaitForSingleObject+0×2cb

fffffa60`088328f0 fffff800`020d40b4 nt!AlpcpSignalAndWait+0×92

fffffa60`08832980 fffff800`020d0b46 nt!AlpcpReceiveSynchronousReply+0×44

fffffa60`088329e0 fffff800`020c06ef nt!AlpcpProcessSynchronousRequest+0×24f

fffffa60`08832b00 fffff800`01e5a573 nt!NtAlpcSendWaitReceivePort+0×19f

fffffa60`08832bb0 00000000`77cb76ca nt!KiSystemServiceCopyEnd+0×13 (TrapFrame @ fffffa60`08832c20)

00000000`000be3f8 00000000`7578993f ntdll!ZwAlpcSendWaitReceivePort+0xa

00000000`000be400 00000000`7577a996 wow64!whNtAlpcSendWaitReceivePort+0×5f

00000000`000be450 00000000`75813688 wow64!Wow64SystemServiceEx+0xca

00000000`000bed00 00000000`7577ab46 wow64cpu!ServiceNoTurbo+0×28

00000000`000bed90 00000000`7577a14c wow64!RunCpuSimulation+0xa

00000000`000bedc0 00000000`77cabbb3 wow64!Wow64LdrpInitialize+0×4b4

00000000`000bf320 00000000`77cab83c ntdll!LdrpInitializeProcess+0×13eb

00000000`000bf5c0 00000000`77c9660e ntdll! ?? ::FNODOBFM::`string’+0×1fbc9

00000000`000bf670 00000000`00000000 ntdll!LdrInitializeThunk+0xe
0: kd> !alpc /m fffff8800f487cf0
Message @ fffff8800f487cf0

MessageID             : 0x0640 (1600)

CallbackID            : 0x36C184 (3588484)

SequenceNumber        : 0x00000002 (2)

Type                  : LPC_REQUEST

DataLength            : 0x0048 (72)

TotalLength           : 0x0070 (112)

Canceled              : No

Release               : No

ReplyWaitReply        : No

Continuation          : Yes

OwnerPort             : fffffa80061946c0 [ALPC_CLIENT_COMMUNICATION_PORT]

WaitingThread         : fffffa8006db8440

QueueType             : ALPC_MSGQUEUE_PENDING

QueuePort             : fffffa8004b37d90 [ALPC_CONNECTION_PORT]

QueuePortOwnerProcess : fffffa8004b11c10 (ServiceA.exe)

ServerThread          : fffffa80066d44b0

QuotaCharged          : No

CancelQueuePort       : 0000000000000000

CancelSequencePort    : 0000000000000000

CancelSequenceNumber  : 0×00000000 (0)

ClientContext         : 00000000007a5630

ServerContext         : 0000000000000000

PortContext           : 0000000005aa3ef0

CancelPortContext     : 0000000000000000

SecurityData          : 0000000000000000

View                  : 0000000000000000
0: kd> !thread fffffa80066d44b0 ff

THREAD fffffa80066d44b0  Cid 07d0.1bec  Teb: 000007fffffa2000 Win32Thread: 0000000000000000 WAIT: (UserRequest) UserMode Non-Alertable

fffffa800728e420  SynchronizationEvent

Impersonation token:  fffff8800a245050 (Level Impersonation)

DeviceMap                 fffff88015685f30

Owning Process            fffffa8004b11c10       Image:         ServiceA.exe

Attached Process          N/A            Image:         N/A

Wait Start TickCount      4244188        Ticks: 453082 (0:01:57:59.406)

Context Switch Count      43

UserTime                  00:00:00.015

KernelTime                00:00:00.000

Win32 Start Address RPCRT4!ThreadStartRoutine (0×000007feff787780)

Stack Init fffffa6009abbdb0 Current fffffa6009abb940

Base fffffa6009abc000 Limit fffffa6009ab6000 Call 0

Priority 10 BasePriority 8 PriorityDecrement 0 IoPriority 2 PagePriority 5

Kernel stack not resident.

Child-SP          RetAddr           Call Site

fffffa60`09abb980 fffff800`01e5ccfa nt!KiSwapContext+0×7f

fffffa60`09abbac0 fffff800`01e519bb nt!KiSwapThread+0×13a

fffffa60`09abbb30 fffff800`020be7c8 nt!KeWaitForSingleObject+0×2cb

fffffa60`09abbbc0 fffff800`01e5a573 nt!NtWaitForSingleObject+0×98

fffffa60`09abbc20 00000000`77cb6eba nt!KiSystemServiceCopyEnd+0×13 (TrapFrame @ fffffa60`09abbc20)

00000000`096eedb8 00000000`77c9577a ntdll!ZwWaitForSingleObject+0xa

00000000`096eedc0 00000000`77c95671 ntdll!RtlpWaitOnCriticalSection+0xea

00000000`096eee70 00000000`667dfe24 ntdll!RtlEnterCriticalSection+0xf4

[…]
If we examine ServiceA process we fined a critical section wait chain where a endpoint is blocked in a dialog box:
0: kd> .process /r /p fffffa8004b11c10

Implicit process is now fffffa80`04b11c10

Loading User Symbols
0: kd> !cs -l -o -s

-----------------------------------------

DebugInfo          = 0x00000000003a4880

Critical section   = 0x000000006684d4c0

LOCKED

LockCount          = 0×3

WaiterWoken        = No

OwningThread       = 0×00000000000023f0

RecursionCount     = 0×1

LockSemaphore      = 0×608

SpinCount          = 0×0000000000000000

OwningThread       = .thread fffffa8006948650

ntdll!RtlpStackTraceDataBase is NULL. Probably the stack traces are not enabled.

—————————————–

DebugInfo          = 0×00000000003b7140

Critical section   = 0×000000000023f188 (+0×23F188)

LOCKED

LockCount          = 0×2

WaiterWoken        = No

OwningThread       = 0×0000000000000a38

RecursionCount     = 0×1

LockSemaphore      = 0×344

SpinCount          = 0×0000000000000000

OwningThread       = .thread fffffa8005d3ebb0

ntdll!RtlpStackTraceDataBase is NULL. Probably the stack traces are not enabled.
0: kd> .thread /r /p fffffa8006948650

Implicit thread is now fffffa80`06948650

Implicit process is now fffffa80`04b11c10

Loading User Symbols
0: kd> k

*** Stack trace for last set context - .thread/.cxr resets it

Child-SP          RetAddr           Call Site

fffffa60`0b5ed980 fffff800`01e5ccfa nt!KiSwapContext+0x7f

fffffa60`0b5edac0 fffff800`01e519bb nt!KiSwapThread+0x13a

fffffa60`0b5edb30 fffff800`020be7c8 nt!KeWaitForSingleObject+0x2cb

fffffa60`0b5edbc0 fffff800`01e5a573 nt!NtWaitForSingleObject+0x98

fffffa60`0b5edc20 00000000`77cb6eba nt!KiSystemServiceCopyEnd+0x13

00000000`089cef08 00000000`77c9577a ntdll!ZwWaitForSingleObject+0xa

00000000`089cef10 00000000`77c95671 ntdll!RtlpWaitOnCriticalSection+0xea

00000000`089cefc0 00000000`667e0ad7 ntdll!RtlEnterCriticalSection+0xf4

[…]
0: kd> .thread /r /p fffffa8005d3ebb0

Implicit thread is now fffffa80`05d3ebb0

Implicit process is now fffffa80`04b11c10

Loading User Symbols
0: kd> k

*** Stack trace for last set context - .thread/.cxr resets it

Child-SP          RetAddr           Call Site

fffffa60`02ed4c50 fffff800`01e5ccfa nt!KiSwapContext+0x7f

fffffa60`02ed4d90 fffff800`01e625eb nt!KiSwapThread+0x13a

fffffa60`02ed4e00 fffff800`020bfc2e nt!KeWaitForMultipleObjects+0x2eb

fffffa60`02ed4e80 fffff800`020c0273 nt!ObpWaitForMultipleObjects+0x26e

fffffa60`02ed5340 fffff800`01e5a573 nt!NtWaitForMultipleObjects+0xe2

fffffa60`02ed5590 00000000`77cb742a nt!KiSystemServiceCopyEnd+0x13

00000000`034de248 00000000`77a8aff3 ntdll!NtWaitForMultipleObjects+0xa

00000000`034de250 00000000`77bbe2b5 kernel32!WaitForMultipleObjectsEx+0x10b

00000000`034de360 000007fe`fc3d14f2 USER32!RealMsgWaitForMultipleObjectsEx+0x129

00000000`034de400 000007fe`fc3d190f DUser!CoreSC::Wait+0x62

00000000`034de450 000007fe`fc3d188a DUser!CoreSC::WaitMessage+0x6f

00000000`034de490 00000000`77bc538e DUser!MphWaitMessageEx+0x36

00000000`034de4c0 00000000`77cb6db6 USER32!_ClientWaitMessageExMPH+0x1a

00000000`034de510 00000000`77bbd2ba ntdll!KiUserCallbackDispatcherContinue

00000000`034de578 00000000`77bc5118 USER32!NtUserWaitMessage+0xa

00000000`034de580 00000000`77bc5770 USER32!DialogBox2+0×261

00000000`034de600 00000000`77bc57e6 USER32!InternalDialogBox+0×134

00000000`034de660 00000000`77bc5e18 USER32!DialogBoxIndirectParamAorW+0×58

00000000`034de6a0 000007fe`fcf349a6 USER32!DialogBoxIndirectParamW+0×18

[…]
- Dmitry Vostokov @ DumpAnalysis.org + TraceAnalysis.org -
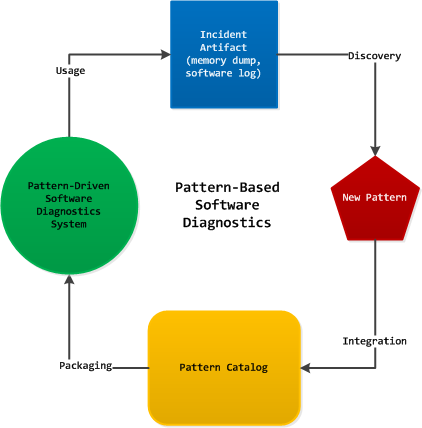
Pattern-Based Software Diagnostics
Sunday, October 21st, 2012Pattern-driven software post-construction problem solving involves using preexisting pattern languages and pattern catalogs for software diagnostics, troubleshooting and debugging. Pattern-based software post-construction problem solving addresses PLS (Pattern Life Cycle) - from the discovery of a new pattern through its integration into an existing catalog and language, testing, packaging and delivering to pattern consumers with subsequent usage, refactoring and writing case studies:
- Dmitry Vostokov @ DumpAnalysis.org + TraceAnalysis.org -
Trace Analysis Patterns (Part 55)
Sunday, October 21st, 2012Empty Trace is another trivial missing pattern that we need to add to make software log analysis pattern system complete. It ranges from a totally empty trace message list where only a meta-trace header (if any) describing overall trace structure is present to a few messages where we expect thousands. This is also an extreme case of Truncated Trace, No Activity and Missing Component patterns for a trace taken as a whole. Note, that an empty trace file doesn’t necessarily have a zero file size because a tracing architecture may preallocate some file space for block data writing.
- Dmitry Vostokov @ DumpAnalysis.org + TraceAnalysis.org -
Trace Analysis Patterns (Part 54)
Sunday, October 21st, 2012While working on Accelerated Windows Software Trace Analysis training I discovered some missing patterns needed for completeness despite their triviality. One of them is called Error Message. Here an error is reported either explicitly (”operation failed”) or implicitly as an operation status result such as 0xC00000XX. Sometimes, a trace message designer specifies that the number value was supplied for information only and should be ignored. Some error messages may contain information that is not relevant for the current software incident, the so called false positive errors. Some tracing architectures and tools include message information category for errors, such as Citrix CDF (ETW-based) where you filter by error category to get an adjoint thread. Note, that the association of a trace statement with an error category is left at the discretion of an engineer writing code and information category messages may contain implicit errors such as last error and return status reports.
- Dmitry Vostokov @ DumpAnalysis.org + TraceAnalysis.org -
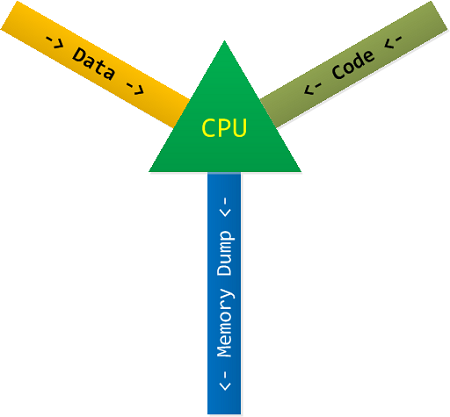
memCPU Architecture (Part 1)
Wednesday, October 17th, 2012In addition to MemOS (Memory OS) we propose memCPU architecture where software diagnostics is built from the start. Every CPU instruction from memISA (Memory Instruction Set Architecture) has its previous memory state saved in a memory dump. Plus there are special instructions to facilitate software tracing. All this will be discussed later but for now there is a conceptual diagram depicting data and code input streams and continuous output memory dump stream:
- Dmitry Vostokov @ DumpAnalysis.org + TraceAnalysis.org -
Phenomenology of Software Diagnostics: A First Sketch
Thursday, October 11th, 2012Influenced by stages of Husserlian phenomenological investigation I propose the following stages for the investigation of phenomena as it appears in software execution artifacts such as memory dumps, traces and logs:
1. Bracketing the outside source code as reduction to patterns of phenomena independent from causal software engineering explanations.
2. Constructing the computational world for the given incident (the so called horizon of computation).
3. Comparing with “computed-in” experience of past computational worlds from which all universal patterns of computational structural and behavioral phenomena emerged.
PS. According to the above software diagnostics is a phenomenological science of patterns. Most probably this sketch will be revised soon. In the mean time here’s a funny coincidence. The first step in a phenomenological method is the so called epoché. I provide my own interpretation of this - “exception processing of crash” hypothetical episteme. Similar to EPOCH metaphysical grand conjecture that our World is just one enormous exception processing handler after Big Bang.
- Dmitry Vostokov @ DumpAnalysis.org + TraceAnalysis.org -
Crash Dump Analysis Patterns (Part 183)
Wednesday, October 10th, 2012The case of an error reporting fault chain led me to First Fault Stack Trace memory dump analysis pattern that corresponds to First Fault software diagnostics pattern proper. Here the term first fault is used for an exception that was either ignored by surrounding code or led to other exceptions or error message boxes with stack traces that masked the first one. Typical examples where it is sometimes possible to get a first exception stack trace include but not limited to:
- Fault in error reporting started as a fault in in some other process
- Hidden exception in user or kernel space
- Double fault
- Nested exception in unmanaged and managed code
- Nested offender
It is also sometimes possible unless a stack region was paged out to get partial stack traces from execution residue when the sequence of return addresses was partially overwritten by subsequently executed code.
- Dmitry Vostokov @ DumpAnalysis.org + TraceAnalysis.org -
Crash Dump Analysis Patterns (Part 182)
Tuesday, October 9th, 2012This is a new pattern that we call Error Reporting Fault. It’s about the faults in error reporting infrastructure. The latter should be guarded against such faults and avoid recursion. Here is a summary example of such a pattern on Windows platforms that involve Windows Error Reporting (WER).
In a complete memory dump we notice thousands of WerFault.exe processes:
0: kd> !process 0 0

[...]

PROCESS fffffa8058010380

SessionId: 2  Cid: 488f0    Peb: 7efdf000  ParentCid: 27cb8

DirBase: 25640c000  ObjectTable: fffff8a06cd2ac50  HandleCount:  54.

Image: WerFault.exe
PROCESS fffffa805bbd5970

SessionId: 2  Cid: 4801c    Peb: 7efdf000  ParentCid: 27cb8

DirBase: 2c3f69000  ObjectTable: fffff8a040563af0  HandleCount:  54.

Image: WerFault.exe
PROCESS fffffa8078aec060

SessionId: 2  Cid: 3feac    Peb: 7efdf000  ParentCid: 488f0

DirBase: abd200000  ObjectTable: fffff8a07851a0a0  HandleCount:  59.

Image: WerFault.exe
PROCESS fffffa805bbe9a10

SessionId: 2  Cid: 3d8b8    Peb: 7efdf000  ParentCid: 4801c

DirBase: 261f91000  ObjectTable: fffff8a02d864d40  HandleCount:  56.

Image: WerFault.exe
PROCESS fffffa805bd29060

SessionId: 2  Cid: 1142c    Peb: 7efdf000  ParentCid: 3feac

DirBase: 429fb3000  ObjectTable: fffff8a0355b42e0  HandleCount:  58.

Image: WerFault.exe
PROCESS fffffa8053d853d0

SessionId: 2  Cid: 1fc4c    Peb: 7efdf000  ParentCid: 3d8b8

DirBase: 714371000  ObjectTable: fffff8a01cb6bba0  HandleCount:  58.

Image: WerFault.exe

[...]
Each process has only one thread running through WOW64 modules so we get its 32-bit stack trace:
0: kd> !process fffffa8075c21b30 ff

[...]

THREAD fffffa807c183b60 Cid 2d3c8.4334c Teb: 000000007efdb000 Win32Thread: fffff900c3f71010 WAIT: (UserRequest) UserMode Non-Alertable

[...]
0: kd> .load wow64exts
0: kd> .process /r /p fffffa8075c21b30

Implicit process is now fffffa80`75c21b30

Loading User Symbols

Loading Wow64 Symbols
0: kd> .thread /w fffffa807c183b60

Implicit thread is now fffffa80`7c183b60

x86 context set
0: kd:x86> k

*** Stack trace for last set context - .thread/.cxr resets it

ChildEBP          RetAddr

000bf474 77080bdd ntdll!ZwWaitForMultipleObjects+0x15

000bf510 76bb1a2c KERNELBASE!WaitForMultipleObjectsEx+0x100

000bf558 76bb4208 kernel32!WaitForMultipleObjectsExImplementation+0xe0

000bf574 76bd80a4 kernel32!WaitForMultipleObjects+0x18

000bf5e0 76bd7f63 kernel32!WerpReportFaultInternal+0x186

000bf5f4 76bd7858 kernel32!WerpReportFault+0x70

000bf604 76bd77d7 kernel32!BasepReportFault+0x20

000bf690 776674df kernel32!UnhandledExceptionFilter+0x1af

000bf698 776673bc ntdll!__RtlUserThreadStart+0x62

000bf6ac 77667261 ntdll!_EH4_CallFilterFunc+0x12

000bf6d4 7764b459 ntdll!_except_handler4+0x8e

000bf6f8 7764b42b ntdll!ExecuteHandler2+0x26

000bf71c 7764b3ce ntdll!ExecuteHandler+0x24

000bf7a8 77600133 ntdll!RtlDispatchException+0x127

000bf7b4 000bf7c0 ntdll!KiUserExceptionDispatcher+0xf

WARNING: Frame IP not in any known module. Following frames may be wrong.

000bfb00 77629ef2 0xbf7c0

[…]
We find exception processing and code on stack (return address belongs to stack range). This thread is waiting for another process and it is WerFault.exe too:
0: kd:x86> .effmach AMD64
0: kd> !process fffffa8075c21b30 ff

[...]

THREAD fffffa807c183b60 Cid 2d3c8.4334c Teb: 000000007efdb000 Win32Thread: fffff900c3f71010 WAIT: (UserRequest) UserMode Non-Alertable

fffffa80809c44e0 ProcessObject

[…]
0: kd> !process fffffa80809c44e0

PROCESS fffffa80809c44e0

SessionId: 2  Cid: 33844    Peb: 7efdf000  ParentCid: 2d3c8

DirBase: 9c53f0000  ObjectTable: fffff8a0423d4170  HandleCount: 978.

Image: WerFault.exe

[...]
We go back to our original WerFault process and in its PEB data we find it was called to report a fault from another process with PID 0n189240:
0: kd> !process fffffa8075c21b30 ff

[...]

CommandLine:  'C:\Windows\SysWOW64\WerFault.exe -u -p 189240 -s 3888′

[…]
And it’s WerFault.exe too:
0: kd> !process 0n189240

Searching for Process with Cid == 2e338
PROCESS fffffa8078b659e0

SessionId: 2  Cid: 2e338    Peb: 7efdf000  ParentCid: 47608

DirBase: 201796000  ObjectTable: fffff8a02e664380  HandleCount: 974.

Image: WerFault.exe

[...]
So we see a chain of WerFault.exe processes each processing a fault in the previous one. So there should be a first fault somewhere which we can find in stack trace collection (32-bit stack traces for this example) unless that exception stack trace was paged out due to insufficient memory occupied by WerFault.exe processes.
- Dmitry Vostokov @ DumpAnalysis.org + TraceAnalysis.org -
Trace Analysis Patterns (Part 53)
Monday, October 8th, 2012Periodic Message Block is similar to Periodic Error but not limited to errors or failure reports. One such example we recently encountered is when some adjoint activity (such as messages from specific PID) stop to appear after the middle of the trace and after that there are repeated blocks of similar messages from different PIDs with their threads checking for some condition (waiting for event and reporting timeouts):
- Dmitry Vostokov @ DumpAnalysis.org + TraceAnalysis.org -
Forthcoming Accelerated Windows Software Trace Analysis Training.
Software Diagnostics Report Schemes (Part 1)
Tuesday, October 2nd, 2012These are important meta-patterns of monitoring and software problem analysis reports. It is often the case that we have software artifacts and some problem description and we need to provide recommendations on further troubleshooting. Most of the time such an analysis and associated response fit into abstract schemes where we can just substitute variables for concrete states, actions, artifacts and behavioral descriptions. Sometimes we also have difficulty to write such analysis reports so we hope report schemes is of help here to provide organizing templates for thought process. The first such scheme we call Missing Cause Trace:
- If Action then Behavior
- We have a trace of Behavior
- We need a trace of Action and Behavior
The difference with Truncated Trace pattern here is that in a truncated trace it was intended to trace certain behaviour but the tracing session was stopped prematurely or started too late. In a missing cause trace only a part of necessary activity was traced and the missing part wasn’t thought of or considered for tracing.
- Dmitry Vostokov @ DumpAnalysis.org + TraceAnalysis.org -
Crash Dump Analysis Patterns (Part 181)
Monday, October 1st, 2012Very useful pattern for the analysis of memory dumps from terminal services environments is Incomplete Session. Normally the session processes include csrss.exe, winlogon.exe, wfshell.exe (in case of Citrix), explorer.exe and a few user defined processes such as winword.exe, for example:
0: kd> !session

Sessions on machine: 6

Valid Sessions: 0 1 3 5 6 8
0: kd> !sprocess 6

Dumping Session 6
_MM_SESSION_SPACE fffffa6009447000

_MMSESSION        fffffa6009447b40

PROCESS fffffa800fcee630

SessionId: 6  Cid: 1974    Peb: 7fffffd5000  ParentCid: 147c

DirBase: 158baf000  ObjectTable: fffff8801ef13b00  HandleCount: 532.

Image: csrss.exe
PROCESS fffffa800fc77040

SessionId: 6  Cid: 1ae4    Peb: 7fffffde000  ParentCid: 147c

DirBase: 15d2b4000  ObjectTable: fffff8802084b570  HandleCount: 238.

Image: winlogon.exe
PROCESS fffffa800fe61040

SessionId: 6  Cid: 1edc    Peb: 7efdf000  ParentCid: 1ec8

DirBase: 14df74000  ObjectTable: fffff88020f486e0  HandleCount: 313.

Image: wfshell.exe
PROCESS fffffa800ff5a660

SessionId: 6  Cid: 2054    Peb: 7fffffdf000  ParentCid: 1dbc

DirBase: 201a81000  ObjectTable: fffff88020dd56e0  HandleCount: 447.

Image: explorer.exe
PROCESS fffffa800fe28040

SessionId: 6  Cid: 1ce4    Peb: 7efdf000  ParentCid: 13a8

DirBase: 11f552000  ObjectTable: fffff8801fe96990  HandleCount: 1842.

Image: WINWORD.EXE
PROCESS fffffa800f119c10

SessionId: 6  Cid: 2074    Peb: 7efdf000  ParentCid: 2054

DirBase: 2d994f000  ObjectTable: fffff8801e76aec0  HandleCount: 673.

Image: iexplore.exe
If we compare with the last session #8 we see that the latter has only 2 processes:
0: kd> !sprocess 8

Dumping Session 8
_MM_SESSION_SPACE fffffa600bafc000

_MMSESSION        fffffa600bafcb40

PROCESS fffffa80103a4480

SessionId: 8  Cid: 2858    Peb: 7fffffdf000  ParentCid: 2660

DirBase: a04bb000  ObjectTable: fffff8801cb926a0  HandleCount: 534.

Image: csrss.exe
PROCESS fffffa801065b770

SessionId: 8  Cid: 2878    Peb: 7fffffdf000  ParentCid: 2660

DirBase: 5da40000  ObjectTable: fffff8801ce5e440  HandleCount: 235.

Image: winlogon.exe
Such anomalies may point to a disconnected session that failed to terminate due to some unresponsive session process or a session that is stuck in session initialization process launch sequence due to threads blocked in wait chains so process threads need to be analyzed.
- Dmitry Vostokov @ DumpAnalysis.org + TraceAnalysis.org -