Archive for April, 2024

Trace Analysis Patterns (Part 245)

Saturday, April 20th, 2024

Feynman Trace borrows ideas from the path integral formulation of quantum mechanics. Such a trace includes all possible traces from all possible traces generated from all possible executions including Trace Amplitudes, Empty Traces, Use Case Trails, and traces with Error Messages, but excluding Impossible Traces:

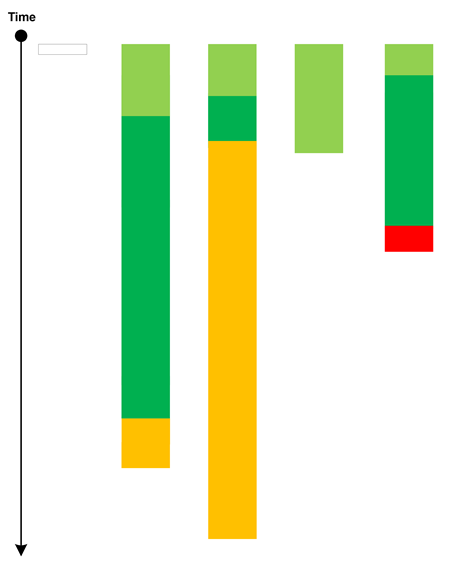
Code flow Declarative Trace analysis can be used to assess the relative contributions of trace and log variants. To reduce infinities arising from loops, Renormalization can be used.

- Dmitry Vostokov @ DumpAnalysis.org + TraceAnalysis.org -

Crash Dump Analysis Patterns (Part 65, Linux)

Wednesday, April 17th, 2024

This analysis pattern is a Linux variant of the previous Not My Version Windows crash dump analysis pattern. In case of segmentation faults/core dumps with Stack Traces involving OS and 3rd-party shared libraries it is worth noting directories they come from:

(gdb) info sharedlibrary
From To Syms Read Shared Object Library
0x00007fad170d5950 0x00007fad170e2dc8 Yes (*) /lib64/lib3rdparty.so.0
0x00007fad170c3130 0x00007fad170c3eb5 Yes /lib/x86_64-linux-gnu/libdl.so.2
0x00007fad16f24320 0x00007fad1706a14b Yes /lib/x86_64-linux-gnu/libc.so.6
0x00007fad17103090 0x00007fad17120b50 Yes /lib64/ld-linux-x86-64.so.2
0x00007fad16bfd300 0x00007fad16c03578 Yes /lib/x86_64-linux-gnu/libnss_files.so.2

If you use WinDbg to analyze Linux core dumps, you can use lmv command or its variant. It is worth noting that referenced libraries can be symbolic links to different versions than you expect. Unfortunately, it is not so easy to extract library timestamps, so it is recommended to additionally use Paratext analysis pattern to supply such information.

- Dmitry Vostokov @ DumpAnalysis.org + TraceAnalysis.org -