Archive for the ‘Structural Memory Patterns’ Category
Sunday, December 7th, 2025
The Latent Structure pattern addresses situations where a memory region appears raw and untyped yet shows early, incomplete signs of structural organization. Signals, such as small or pointer-like values, alignment regularities, recurring byte sequences, partial strings, or fragments that resemble fields, suggest that a real structure might exist, but cannot yet be interpreted safely or confidently. Latent Structure represents the pre-suspect stage in structural diagnostics: the point where the analyst notices potential form but must resist premature interpretation. Acting too early risks misclassifying problems and misidentifying root causes. Several forces complicate this stage: partial overwrites, coincidental alignments, ABI or version mismatches, and cognitive biases that encourage overinterpretation. This analysis pattern, therefore, emphasizes careful, hypothesis-driven exploration using techniques such as tentative structure casting, pointer-chain heuristics, checks for internal semantic coherence, software internals, and domain knowledge, all without assuming the structure’s validity. When enough evidence accumulates, a Latent Structure transitions into a Suspect Structure (subject of the next analysis pattern), where it becomes testable.
For example, we may see these fragment in Execution Residue:
00000029`e7efeb00  00001f80`0010004b

00000029`e7efeb08  0053002b`002b0033

00000029`e7efeb10  00000242`002b002b
Finally, we write the formal pattern structure card.
Intent
Detect hidden or unclear structural organization in raw memory regions that exhibit early indicators of structure-like form but whose types are not yet known.
Context
Appears in:
Execution Residue, Pointer Cone, Memory Region, and Region Strata.
Problem
A memory dump shows a region of raw bytes without explicit type information that contains hints suggesting that a structure may be present. Prematurely interpreting such memory can lead to false positives, misclassification, incorrect casting, and a chain of misleading hypotheses.
Forces
Data:
- Memory may contain partial structures
- Overwrites blur structure boundaries
- Random-looking regions may hide structured subregions
Semantics:
- Pointer-like values may be real or coincidental
- Partial strings
- Field alignments may appear regular due to chance
Modules:
- Coincidental symbols
- ABI or version mismatches
Cognitive biases:
- Insufficient domain knowledge
- Premature suspicion
Symptoms
- Structural hints in bytes
- Pointer-like values
- Strings and identity hints
- Alignment and regularity
- Recurring patterns across multiple memory locations
- Partial structure validity
- Incomplete or corrupt-like structure
Resolution Strategies
- Structure casting
- Heuristic field and pointer chain analysis
- Verification of internal semantic coherence
Resulting Context
Structure becomes Suspect and testable for validity.
Related Patterns
Hidden Artifact Patterns, Corrupt Structure, Module Hint, Falsity and Coincidence Patterns, Shared Buffer Overwrite, Value References, Small Value, Design Value, Shared Structure, and Regular Data.
Formal Card
- Dmitry Vostokov @ DumpAnalysis.org + TraceAnalysis.org -
Posted in Core Dump Analysis, Crash Dump Analysis, Crash Dump Patterns, Structural Diagnostics, Structural Memory Patterns, x64 Windows | Comments Off
Monday, August 8th, 2016
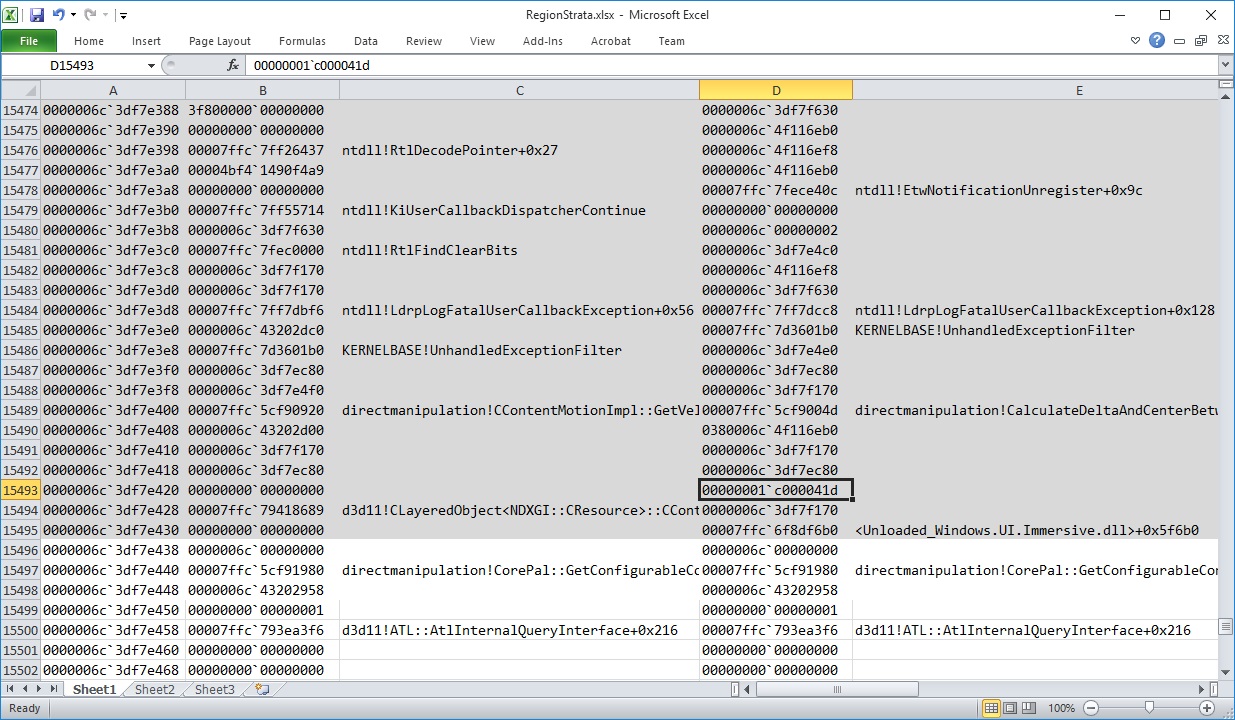
After almost a 6-year break we resume extending the catalog of structural memory patterns as a foundation of pattern-oriented memory forensics, root cause analysis, and software internals. The next pattern we add is borrowed from archaeology and is called Region Strata. When we have several memory snapshots we can analyze Memory Regions for their changes at different times:

For example, we got two memory dumps of the same process saved by WER with approx. one minute difference. We saved the raw stack region of the current thread using .writemem WinDbg command in text files (Strata1.txt and Strata2.txt) and then combined them into one Excel table (Strata.xlsx). In that table we can see memory region changes as shown in this picture (click to expand):
- Dmitry Vostokov @ DumpAnalysis.org + TraceAnalysis.org -
Posted in Archaeology of Computer Memory, Crash Dump Analysis, Structural Memory Patterns, x64 Windows | No Comments »
Monday, April 9th, 2012
Memory Dump Analysis Services organizes a free Webinar on Unified Software Diagnostics (USD) and the new scalable cost-effective software support model called Pattern-Driven Software Support devised to address various shortcomings in existing tiered software support organizations. Examples cover Windows, Mac OS and Linux.

Date: 22nd of June, 2012
Time: 17:00 (BST) 12:00 (EST) 09:00 (PST)
Duration: 60 minutes
Space is limited.
Reserve your Webinar seat now at:
https://www3.gotomeeting.com/register/172771078
- Dmitry Vostokov @ DumpAnalysis.org + TraceAnalysis.org -
Posted in Announcements, Best Practices, Crash Dump Analysis, Crash Dump Patterns, Debugging, Debugging Methodology, Debugging Trends, Economics, Escalation Engineering, Event Tracing for Windows (ETW), JIT Crash Analysis, JIT Memory Space Analysis, Malware Analysis, Malware Patterns, Memoretics, Memory Analysis Forensics and Intelligence, Memory Dump Analysis Methodology, Memory Dump Analysis Services, New Acronyms, New Debugging School, Pattern Prediction, Pattern-Driven Debugging, Pattern-Driven Software Support, Root Cause Analysis, Science of Memory Dump Analysis, Science of Software Tracing, Software Behavior DNA, Software Behavior Patterns, Software Behavioral Genome, Software Diagnostics, Software Engineering, Software Narratology, Software Problem Description Patterns, Software Problem Solving, Software Support Patterns, Software Technical Support, Software Trace Analysis, Software Troubleshooting Patterns, Software Victimology, Software and Economics, Structural Memory Patterns, Structural Trace Patterns, Systems Thinking, Testing, Tools, Trace Analysis Patterns, Training and Seminars, Troubleshooting Methodology, UI Problem Analysis Patterns, Unified Debugging Patterns, Unified Software Diagnostics, Victimware, Webinars, Workaround Patterns | No Comments »
Monday, December 12th, 2011
More than 4 years passed since I provided a longer structuralist definition. Recently I came to recognize a pattern-driven iterative and incremental nature of memory and software trace analysis and post-construction software problem solving in general and therefore a one sentence definition became necessary:
“Recognition and interpretation of patterns of software behavior”
- Dmitry Vostokov @ DumpAnalysis.org + TraceAnalysis.org -
Posted in Announcements, Crash Dump Analysis, Crash Dump Patterns, Malware Analysis, Malware Patterns, Memiotics (Memory Semiotics), Memoretics, Memory Analysis Forensics and Intelligence, Science of Memory Dump Analysis, Science of Software Tracing, Software Behavior Patterns, Software Narratology, Software Problem Solving, Software Trace Analysis, Structural Memory Patterns, Structural Trace Patterns, Trace Analysis Patterns, Victimware | No Comments »
Wednesday, September 21st, 2011
Memoretics promotes pattern-driven memory dump and software trace analysis which has many uses but not limited to:
- Software and site reliability
- Software Debugging
- QA and Software Testing
- Computer Security
- Software Troubleshooting
- Malware Research and Analysis
- Tools as a Service (TaaS)
- Supportability
- Software Diagnostics

- Dmitry Vostokov @ DumpAnalysis.org + TraceAnalysis.org -
Posted in Cloud Memory Dump Analysis, Computer Forensics, Crash Dump Analysis, Crash Dump Patterns, DebugWare Patterns, Debugging, Debugging Trends, Escalation Engineering, Malware Analysis, Malware Patterns, Memiotics (Memory Semiotics), Memoretics, Memory Analysis Forensics and Intelligence, Metadefect Template Library, Metamalware, Pattern Models, Pattern Prediction, Reverse Engineering, Root Cause Analysis, Science of Memory Dump Analysis, Science of Software Tracing, Security, Software Behavior DNA, Software Behavior Patterns, Software Behavioral Genome, Software Defect Construction, Software Engineering, Software Generalist, Software Narratology, Software Support Patterns, Software Technical Support, Software Trace Analysis, Software Troubleshooting Patterns, Structural Memory Patterns, Structural Trace Patterns, Systems Thinking, Testing, Tools, Trace Analysis Patterns, Troubleshooting Methodology, UI Problem Analysis Patterns, Unified Debugging Patterns, Victimware, Windows System Administration, Workaround Patterns | No Comments »
Wednesday, September 21st, 2011
Memoretics as a science of memory snapshots borrows many ideas from the following disciplines (the list is not exhaustive):
- Troubleshooting and Debugging
- Intelligence Analysis
- Critical Thinking
- Forensics
- Linguistics
- Archaeology
- Psychoanalysis
- History
- Mathematics: Sets and Categories
- Literary Criticism and Narratology
It also contributes many ideas back. The following diagram depicts such an interaction:

- Dmitry Vostokov @ DumpAnalysis.org + TraceAnalysis.org -
Posted in Archaeology of Computer Memory, Categorical Debugging, Computer Forensics, Computer Science, Countefactual Debugging, Crash Dump Analysis, Crash Dump De-analysis, Crash Dump Patterns, Debugging, Debugging Methodology, Dublin School of Security, Education and Research, Escalation Engineering, General Memory Analysis, Generative Debugging, Hermeneutics of Memory Dumps and Traces, History, Intelligence Analysis Patterns, M->analysis, Malware Analysis, Malware Patterns, Mathematics of Debugging, Memiotics (Memory Semiotics), Memoretics, Memory Analysis Forensics and Intelligence, Memory Dump Analysis and History, Memory Systems Language, Memory Visualization, Metadefect Template Library, Metamalware, New Debugging School, Paleo-debugging, Pattern Models, Pattern Prediction, Psychoanalysis of Software Maintenance and Support, Psychology, Reverse Engineering, Root Cause Analysis, Science of Memory Dump Analysis, Science of Software Tracing, Security, Software Architecture, Software Behavior DNA, Software Behavior Patterns, Software Behavioral Genome, Software Chorography, Software Chorology, Software Defect Construction, Software Engineering, Software Narratology, Software Technical Support, Software Trace Analysis, Software Trace Analysis and History, Software Trace Deconstruction, Software Trace Linguistics, Software Trace Reading, Software Trace Visualization, Software Tracing Implementation Patterns, Software Troubleshooting Patterns, Software Victimology, Software and History, Structural Memory Analysis and Social Sciences, Structural Memory Patterns, Structural Trace Patterns, Systems Thinking, Testing, Tools, Trace Analysis Patterns, Troubleshooting Methodology, UI Problem Analysis Patterns, Unified Debugging Patterns, Victimware, Virtualization, Visual Dump Analysis, Workaround Patterns | No Comments »
Sunday, August 14th, 2011
Due to the need to extend existing basic and intermediate Accelerated Windows Memory Dump Analysis training Memory Dump Analysis Services organises advanced training course. Here is the description and registration information:
Learn how to navigate through memory dump space and Windows data structures to troubleshoot and debug complex software incidents. We use a unique and innovative pattern-driven analysis approach to speed up the learning curve. The training consists of practical step-by-step exercises using WinDbg to diagnose structural and behavioral patterns in 32-bit and 64-bit process, kernel and complete memory dumps.

If you are registered you are allowed to optionally submit your memory dumps before the training. This will allow us in addition to the carefully constructed problems tailor extra examples to the needs of the attendees.
The training consists of one four-hour session and additional homework exercises. When you finish the training you additionally get:
- A full transcript in PDF format (retail price $200)
- 5 volumes of Memory Dump Analysis Anthology in PDF format (retail price $100)
- A personalized attendance certificate with unique CID (PDF format)
Prerequisites: Basic and intermediate level Windows memory dump analysis: ability to list processors, processes, threads, modules, apply symbols, walk through stack traces and raw stack data, diagnose patterns such as heap corruption, CPU spike, memory and handle leaks, access violation, stack overflow, critical section and resource wait chains and deadlocks. If you don’t feel comfortable with prerequisites then Accelerated Windows Memory Dump Analysis training is recommended to take (or purchase a corresponding book) before attending this course.
Audience: Software developers, software technical support and escalation engineers.
Session: December 9, 2011 4:00 PM - 8:00 PM GMT
Price: 210 USD
Space is limited.
Reserve your remote training seat now at:
https://student.gototraining.com/24s4l/register/3788047691824598784
- Dmitry Vostokov @ DumpAnalysis.org + TraceAnalysis.org -
Posted in Announcements, Complete Memory Dump Analysis, Crash Dump Analysis, Crash Dump Patterns, Debugging, Escalation Engineering, Kernel Development, Memory Dump Analysis Services, Multithreading, Reverse Engineering, Root Cause Analysis, Software Engineering, Software Technical Support, Structural Memory Patterns, Training and Seminars, Uses of UML, Vista, WinDbg Scripts, WinDbg Tips and Tricks, Windows 7, Windows Data Structures, Windows Server 2008, x64 Windows | No Comments »
Sunday, May 1st, 2011
To model software behavior at application and system levels, test generative debugging scenarious and construct software defects using metaprogramming I started working on MdTL (Metadefect Template Library). Its consists of C++ templates for structural and behavioral patterns. The simplest examples include Threads<Spike> and Spike<Thread>. The template classes can be more complex, of course, utilizing the full power of C++, STL, and existing libraries like Boost. The unique and novel feature of this library is the inclusion of dual classes of behaviour such as Leak<>, Deadlock<>, Overflow<>, Residue<>, Exception<>, Contention<>, etc. parameterized by various structural memory classes like Process<>, Thread<>, Heap<>, Stack<>, Region<>, Buffer<>, etc. MdTL also includes classes to model software tracing and this will be used for simultaneous software trace and memory dump analysis case study in the forthcoming presentation. I also plan to extend this metaprogramming approach in the future to model malware analysis patterns by introducing Metamalware Template Library (MmTL).
Forthcoming parts will introduce template classes and examples.
- Dmitry Vostokov @ DumpAnalysis.org + TraceAnalysis.org -
Posted in C and C++, Crash Dump Patterns, Debugging, Generative Debugging, Malware Analysis, Malware Patterns, Metadefect Template Library, Metamalware, New Acronyms, Software Behavior Patterns, Software Defect Construction, Structural Memory Patterns, Structural Trace Patterns, Tools, Trace Analysis Patterns, Victimware | No Comments »
Sunday, April 17th, 2011
I’m pleased to announce that MDAA, Volume 5 is available in PDF format:
www.dumpanalysis.org/Memory+Dump+Analysis+Anthology+Volume+5
It features:
- 25 new crash dump analysis patterns
- 11 new pattern interaction case studies (including software tracing)
- 16 new trace analysis patterns
- 7 structural memory patterns
- 4 modeling case studies for memory dump analysis patterns
- Discussion of 3 common analysis mistakes
- Malware analysis case study
- Computer independent architecture of crash analysis report service
- Expanded coverage of software narratology
- Metaphysical and theological implications of memory dump worldview
- More pictures of memory space and physicalist art
- Classification of memory visualization tools
- Memory visualization case studies
- Close reading of the stories of Sherlock Holmes: Dr. Watson’s observational patterns
- Fully cross-referenced with Volume 1, Volume 2, Volume 3, and Volume 4
Its table of contents is available here:
www.dumpanalysis.org/MDAA/MDA-Anthology-V5-TOC.pdf
Paperback and hardcover versions should be available in a week or two. I also started working on Volume 6 that should be available in November-December.
- Dmitry Vostokov @ DumpAnalysis.org + TraceAnalysis.org -
Posted in Aesthetics of Memory Dumps, Analysis Notation, Announcements, AntiPatterns, Archaeology of Computer Memory, Art, Assembly Language, Best Practices, Books, C and C++, CDF Analysis Tips and Tricks, Categorical Debugging, Citrix, Common Mistakes, Common Questions, Complete Memory Dump Analysis, Computer Forensics, Computer Science, Crash Analysis Report Environment (CARE), Crash Dump Analysis, Crash Dump De-analysis, Crash Dump Patterns, Crash Dumps for Dummies, Cyber Warfare, Debugging, Debugging Bureau, Debugging Industry, Debugging Methodology, Debugging Slang, Debugging Trends, Deep Down C++, Dr. Watson, Dublin School of Security, Education and Research, Escalation Engineering, Fun with Crash Dumps, Fun with Debugging, Fun with Software Traces, General Memory Analysis, Hermeneutics of Memory Dumps and Traces, Images of Computer Memory, Kernel Development, Malware Analysis, Mathematics of Debugging, Memiotics (Memory Semiotics), Memory Analysis Forensics and Intelligence, Memory Diagrams, Memory Dump Analysis Services, Memory Dumps in Myths, Memory Space Art, Memory Systems Language, Memory Visualization, Memory and Glitches, Metaphysics of Memory Worldview, Multithreading, Music for Debugging, New Acronyms, New Debugging School, New Words, Pattern Models, Philosophy, Physicalist Art, Publishing, Reverse Engineering, Science of Memory Dump Analysis, Science of Software Tracing, Security, Software Architecture, Software Behavior Patterns, Software Chorography, Software Chorology, Software Defect Construction, Software Engineering, Software Generalist, Software Maintenance Institute, Software Narratology, Software Technical Support, Software Trace Analysis, Software Trace Reading, Software Trace Visualization, Software Tracing for Dummies, Software Troubleshooting Patterns, Software Victimology, Structural Memory Patterns, Structural Trace Patterns, Systems Thinking, Testing, The Way of Philip Marlowe, Tools, Trace Analysis Patterns, Training and Seminars, Troubleshooting Methodology, Victimware, Vista, Webinars, WinDbg Scripting Extensions, WinDbg Scripts, WinDbg Tips and Tricks, WinDbg for GDB Users, Windows 7, Windows Server 2008, Windows System Administration, Workaround Patterns, x64 Windows | No Comments »
Friday, April 15th, 2011
Followed by my search for a periodic table of software defects I came up with a novel approach called Generative Debugging partially borrowed from principles and parameters generative linguistics framework. For debugging and post-construction software problem solving purposes we have Behavioral Principles and Structural Parameters. The parameters allow us to describe existing and even generate new software defects (I’m also considering Structural Principles and Behavioural Parameters but whether this is fruitful needs to be explored and seen. We may also consider the name “generative debugging” as a “naming” counterpart to software construction problem solving called generative programming. So the former could also be used to generate problem solutions faster in automatic fashion. Both, in the future, may be combined into a unified generative software problem solving.
As a first example, consider an application functional hang with a thread blocked by a pending I/O request packet (IRP). It is composed from general behavioral principle of blocked (or unresponsive) activity and structural parameters including Thread and IRP.
In the following parts many software incidents will be explored from this generative perspective.
- Dmitry Vostokov @ DumpAnalysis.org + TraceAnalysis.org -
Posted in Announcements, Debugging, Generative Debugging, Memory Systems Language, New Debugging School, Software Behavior Patterns, Structural Memory Patterns, Structural Trace Patterns | No Comments »
Saturday, March 26th, 2011
The presentation materials from the webinar (25th of March, 2011) are available for download:
http://www.dumpanalysis.com/PDSPSI-materials
Thanks to everyone who registered and attended!
- Dmitry Vostokov @ DumpAnalysis.org + TraceAnalysis.org -
Posted in Announcements, Crash Dump Analysis, Crash Dump Patterns, DebugWare Patterns, Debugging, Debugging Methodology, Escalation Engineering, Mac Crash Corner, Malware Analysis, Malware Patterns, Memory Analysis Forensics and Intelligence, Software Architecture, Software Behavior Patterns, Software Engineering, Software Technical Support, Software Trace Analysis, Software Tracing Implementation Patterns, Software Troubleshooting Patterns, Structural Memory Patterns, Structural Trace Patterns, Tools, Trace Analysis Patterns, Training and Seminars, Troubleshooting Methodology, Unified Debugging Patterns, Webinars, Workaround Patterns | No Comments »
Monday, March 7th, 2011

The first Webinar to start an in-depth discussion of pattern-driven software troubleshooting, debugging and maintenance:
Date: 25th of March 2011
Time: 18:30 (GMT) 14:30 (EST) 11:30 (PST)
Duration: 60 minutes
Space is limited.
Reserve your Webinar seat now at:
https://www3.gotomeeting.com/register/448268158
Topics include:
- A Short History of DumpAnalysis.org
- Memory Dump Analysis Patterns
- Troubleshooting and Debugging Tools (Debugware) Patterns
- Software Trace Analysis Patterns
- From Software Defects to Software Behavior
- Workaround Patterns
- Structural Memory Patterns
- Memory Analysis Domain Pattern Hierarchy
- New Directions
Prerequisites: experience in software troubleshooting and/or debugging.
- Dmitry Vostokov @ DumpAnalysis.org + TraceAnalysis.org -
Posted in .NET Debugging, Analysis Notation, Announcements, AntiPatterns, Best Practices, CDA Pattern Classification, Crash Dump Analysis, Crash Dump Patterns, DebugWare Patterns, Debugging, Debugging Methodology, Debugging Trends, Escalation Engineering, Java Debugging, Linux Crash Corner, Mac Crash Corner, Malware Analysis, Malware Patterns, Memory Analysis Forensics and Intelligence, Memory Dump Analysis Services, Pattern Models, Pattern Prediction, Presentations, Software Behavior Patterns, Software Chorology, Software Engineering, Software Narratology, Software Technical Support, Software Trace Analysis, Software Trace Reading, Software Tracing Implementation Patterns, Software Troubleshooting Patterns, Structural Memory Patterns, Structural Trace Patterns, Systems Thinking, Testing, Trace Analysis Patterns, Training and Seminars, Troubleshooting Methodology, Unified Debugging Patterns, Webinars, Workaround Patterns | No Comments »
Saturday, January 1st, 2011
With the new year starts the new initiative to integrate traditional multidisciplinary debugging approaches and methodologies with multiplatform pattern-driven software problem solving, unified debugging patterns, best practices in memory dump analysis and software tracing, computer security, economics, and the new emerging trends I’m going to write about during this year.
- Dmitry Vostokov @ DumpAnalysis.org + TraceAnalysis.org -
Posted in Announcements, Best Practices, Computer Forensics, Computer Science, Countefactual Debugging, Crash Analysis Report Environment (CARE), Crash Dump Analysis, Crash Dump Patterns, DebugWare Patterns, Debugging, Debugging Industry, Debugging Methodology, Debugging Trends, Dublin School of Security, Economics, Education and Research, Escalation Engineering, First Fault Problem Solving, Malware Analysis, Malware Patterns, Mathematics of Debugging, Memiotics (Memory Semiotics), Memoretics, Memory Analysis Forensics and Intelligence, Memory Analysis Report System, Memory Dump Analysis Services, Memory Systems Language, Memory Visualization, New Debugging School, Science of Memory Dump Analysis, Science of Software Tracing, Security, Software Behavior Patterns, Software Defect Construction, Software Engineering, Software Generalist, Software Maintenance Institute, Software Narratology, Software Trace Analysis, Software Trace Visualization, Software Tracing Implementation Patterns, Software Troubleshooting Patterns, Structural Memory Patterns, Structural Trace Patterns, Systems Thinking, Testing, Tool Objects, Tools, Trace Analysis Patterns, Training and Seminars, Troubleshooting Methodology, Unified Debugging Patterns, Victimware, Visual Dump Analysis, Webinars, Workaround Patterns | No Comments »
Friday, December 24th, 2010
Borrowing routine activity theory (RAT) from criminology I would like to introduce the similar approach to abnormal software behavior with patterning activities that adds additional unmotivated offenders to combine malware (software rats) with unintentional ordinary common bugware:
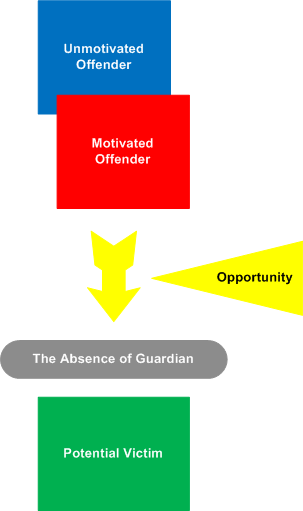
The application of RAT to software can be metaphorically named as Function Activity Theory (FAT).
- Dmitry Vostokov @ DumpAnalysis.org + TraceAnalysis.org -
Posted in Malware Analysis, Security, Software Behavior Patterns, Software Victimology, Structural Memory Patterns, Victimware | No Comments »
Friday, December 17th, 2010
As the new decade is approaching (2011-2020) we would like to make a few previews and predictions:
- Increased complexity of software will bring more methods from biological, social sciences and humanities in addition to existing methods of automated debugging and computer science techniques
- Focus on first fault software problem solving (when aspect)
- Focus on pattern-driven software problem solving (how aspect)
- Fusion of debugging and malware analysis into a unified structural and behavioral pattern framework
- Visual debugging, memory and software trace visualization techniques
- Software maintenance certification
- Focus on domain-driven troubleshooting and debugging tools as a service (debugware TaaS)
- Focus on security issues related to memory dumps and software traces
- New scripting languages and programming language extensions for debugging
- The maturation of the science of memory snapshots and software traces (memoretics)
Imagining is not not limited to the above and more to come and explain in the forthcoming parts.
- Dmitry Vostokov @ DumpAnalysis.org + TraceAnalysis.org -
Posted in Announcements, Anthropology, Archaeology of Computer Memory, Biology, Certification, Computer Science, Countefactual Debugging, Crash Analysis Report Environment (CARE), Crash Dump Analysis, Crash Dump Patterns, DebugWare Patterns, Debugging, Debugging Industry, Debugging Methodology, Debugging Trends, Dublin School of Security, EasyDbg, Economics, Escalation Engineering, Evolution, First Fault Problem Solving, Futuristic Memory Dump Analysis, General Memory Analysis, General Science, Geography, Hardware, Hermeneutics of Memory Dumps and Traces, History, Humanities, Language, Laws of Troubleshooting and Debugging, Logic, Malware Analysis, Malware Patterns, Mathematics of Debugging, Memiotics (Memory Semiotics), Memoretics, Memory Analysis Forensics and Intelligence, Memory Analysis Report System, Memory Dump Analysis and History, Memory Systems Language, Memory Visualization, Paleo-debugging, Pattern Models, Pattern Prediction, Physics, Psychology, Publishing, Science of Memory Dump Analysis, Science of Software Tracing, Security, Social Media, Social Sciences, Software Architecture, Software Behavior Patterns, Software Chorography, Software Chorology, Software Defect Construction, Software Engineering, Software Generalist, Software Maintenance Institute, Software Narrative Fiction, Software Narratology, Software Technical Support, Software Trace Analysis, Software Trace Analysis and History, Software Trace Deconstruction, Software Trace Linguistics, Software Trace Visualization, Software Troubleshooting Patterns, Software Victimology, Statistics, Structural Memory Analysis and Social Sciences, Structural Memory Patterns, Structural Trace Patterns, Systems Thinking, Testing, Tools, Trace Analysis Patterns, Troubleshooting Methodology, Unified Debugging Patterns, Uses of UML, Victimware, Virtualization, Visual Dump Analysis, Windows System Administration, Workaround Patterns | No Comments »
Tuesday, November 30th, 2010
MAaaS includes 2 complementary DA+TA services:
1. Dump Analysis as a Service (DAaaS)
2. Trace Analysis as a Service (TAaaS)
Memory Dump Analysis Services is the first organization to provide such a service at an audit and certification levels.
- Dmitry Vostokov @ DumpAnalysis.org + TraceAnalysis.org -
Posted in Certification, Complete Memory Dump Analysis, Crash Analysis Report Environment (CARE), Crash Dump Analysis, Crash Dump Patterns, Debugging, Dublin School of Security, Escalation Engineering, Malware Analysis, Malware Patterns, Memiotics (Memory Semiotics), Memoretics, Memory Analysis Forensics and Intelligence, Memory Analysis Report System, Memory Dump Analysis Services, Minidump Analysis, Security, Software Behavior Patterns, Software Technical Support, Software Trace Analysis, Software Trace Reading, Structural Memory Patterns, Structural Trace Patterns, Tools, Trace Analysis Patterns, Windows System Administration | No Comments »
Friday, November 12th, 2010
Five volumes of cross-disciplinary Anthology (dubbed by the author “The Summa Memorianica”) lay the foundation of the scientific discipline of Memoretics (study of computer memory snapshots and their evolution in time) that is also called Memory Dump and Software Trace Analysis.ca
The 5th volume contains revised, edited, cross-referenced, and thematically organized selected DumpAnalysis.org blog posts about crash dump, software trace analysis and debugging written in February 2010 - October 2010 for software engineers developing and maintaining products on Windows platforms, quality assurance engineers testing software on Windows platforms, technical support and escalation engineers dealing with complex software issues, and security researchers, malware analysts and reverse engineers. The fifth volume features:
- 25 new crash dump analysis patterns
- 11 new pattern interaction case studies (including software tracing)
- 16 new trace analysis patterns
- 7 structural memory patterns
- 4 modeling case studies for memory dump analysis patterns
- Discussion of 3 common analysis mistakes
- Malware analysis case study
- Computer independent architecture of crash analysis report service
- Expanded coverage of software narratology
- Metaphysical and theological implications of memory dump worldview
- More pictures of memory space and physicalist art
- Classification of memory visualization tools
- Memory visualization case studies
- Close reading of the stories of Sherlock Holmes: Dr. Watson’s observational patterns
- Fully cross-referenced with Volume 1, Volume 2, Volume 3, and Volume 4
Product information:
- Title: Memory Dump Analysis Anthology, Volume 5
- Author: Dmitry Vostokov
- Language: English
- Product Dimensions: 22.86 x 15.24
- Paperback: 400 pages
- Publisher: Opentask (10 December 2010)
- ISBN-13: 978-1-906717-96-4
- Hardcover: 400 pages
- Publisher: Opentask (10 December 2010)
- ISBN-13: 978-1-906717-97-1

Back cover features memory space art image Hot Computation: Memory on Fire.
- Dmitry Vostokov @ DumpAnalysis.org + TraceAnalysis.org -
Posted in Aesthetics of Memory Dumps, Announcements, Archaeology of Computer Memory, Art, Assembly Language, Books, C and C++, CDF Analysis Tips and Tricks, Categorical Debugging, Common Mistakes, Complete Memory Dump Analysis, Computer Science, Crash Analysis Report Environment (CARE), Crash Dump Analysis, Crash Dump De-analysis, Crash Dump Patterns, Debugging, Debugging Methodology, Debugging Slang, Deep Down C++, Dr. Watson, Dublin School of Security, Education and Research, Escalation Engineering, Fun with Crash Dumps, Fun with Debugging, Fun with Software Traces, General Memory Analysis, Hermeneutics of Memory Dumps and Traces, Images of Computer Memory, Kernel Development, Malware Analysis, Malware Patterns, Mathematics of Debugging, Memiotics (Memory Semiotics), Memoidealism, Memoretics, Memory Analysis Culture, Memory Analysis Forensics and Intelligence, Memory Analysis Report System, Memory Diagrams, Memory Dreams, Memory Dump Analysis Jobs, Memory Dump Analysis Services, Memory Dump Analysis and History, Memory Dumps in Movies, Memory Dumps in Myths, Memory Religion (Memorianity), Memory Space Art, Memory Systems Language, Memory Visualization, Memory and Glitches, Memuonics, Metaphysical Society of Ireland, Minidump Analysis, Movies and Debugging, Multithreading, Museum of Debugging, Music for Debugging, Music of Computation, New Acronyms, New Words, Paleo-debugging, Pattern Models, Pattern Prediction, Philosophy, Physicalist Art, Psychoanalysis of Software Maintenance and Support, Publishing, Science of Memory Dump Analysis, Science of Software Tracing, Security, Software Architecture, Software Behavior Patterns, Software Chorography, Software Chorology, Software Defect Construction, Software Engineering, Software Generalist, Software Maintenance Institute, Software Narratology, Software Technical Support, Software Trace Analysis, Software Trace Analysis and History, Software Trace Deconstruction, Software Trace Reading, Software Trace Visualization, Software Tracing for Dummies, Software Troubleshooting Patterns, Software Victimology, Stack Trace Collection, Structural Memory Analysis and Social Sciences, Structural Memory Patterns, Structural Trace Patterns, Systems Thinking, Testing, Theology, Tool Objects, Tools, Trace Analysis Patterns, Training and Seminars, Troubleshooting Methodology, Uses of UML, Victimware, Virtualization, Vista, Visual Dump Analysis, Webinars, WinDbg Scripts, WinDbg Tips and Tricks, WinDbg for GDB Users, Windows 7, Windows Server 2008, Windows System Administration, Workaround Patterns, x64 Windows | No Comments »
Wednesday, November 3rd, 2010
I have discovered rules that make it possible to devise a memory dump and software trace analysis equivalent of the Periodic Table of Elements in Chemistry. It allows prediction of abnormal software behaviour and structural defects and what patterns to look for after deploying software and collecting its artifacts. More on this is in the next part of these series.
- Dmitry Vostokov @ DumpAnalysis.org + TraceAnalysis.org -
Posted in Announcements, Chemistry, Crash Dump Analysis, Crash Dump Patterns, Debugging, Pattern Prediction, Software Behavior Patterns, Software Trace Analysis, Structural Memory Patterns, Structural Trace Patterns, Trace Analysis Patterns | No Comments »
Saturday, October 23rd, 2010
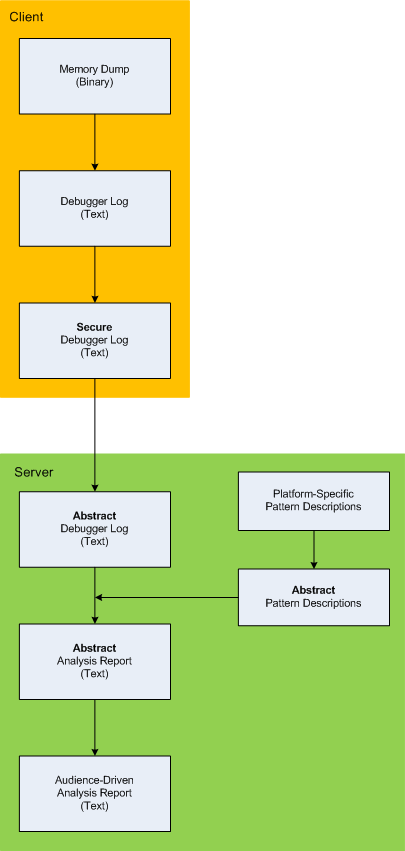
Here is the description of a high-level architecture of the previously announced project CARE (Crash Analysis Report Environment). To remind, the main idea of the project is to process memory dumps on a client to save debugger logs. They can be sent to a server for pattern-driven analysis of software behaviour. Textual logs can also be inspected by a client security team before sending. Certain sensitive information can be excluded or modified to have generic meaning according to the built-in processing rules like renaming (for example, server names and folders). Before processing, verified secured logs are converted to abstract debugger logs. Abstracting platform-specific debugger log format allows reuse of the same architecture for different computer platforms. We call it CIA (Computer Independent Architecture). Do not confuse it with ICA (Independent Computer Architecture) and CIA acronym is more appropriate for memory analysis (like similar MAFIA acronym, Memory Analysis Forensics and Intelligence Architecture). These abstract logs are checked for various patterns (in abstracted form) using abstract debugger commands and an abstract report is generated according to various checklists. Abstract reports are then converted to structured reports for the required audience level. Abstract memory analysis pattern descriptions are prepared from platform-specific pattern descriptions. In certain architectural component deployment configurations both client and server parts can reside on the same machine. Here’s the simple diagram depicting the flow of processing:
- Dmitry Vostokov @ DumpAnalysis.org + TraceAnalysis.org -
Posted in Announcements, Crash Analysis Report Environment (CARE), Crash Dump Analysis, Crash Dump Patterns, Debugging, Memory Analysis Forensics and Intelligence, New Acronyms, Security, Software Architecture, Software Behavior Patterns, Software Technical Support, Structural Memory Patterns, Tools | No Comments »
Friday, October 22nd, 2010
I detour for MARS expedition. You may also call it Memory Analysis Report System as malware analysis is always exploration of memory (in general). Why is this sudden change of course? After reading Gilles Deleuze I want to broaden the concept of “malware” and give it new orientation and direction of thinking. Beside that I also want new challenges after many years of research in pattern-driven memory dump and software trace analysis of abnormal software behaviour.
You may have also noticed small restructuring (rebranding) of this blog and DumpAnalysis.org headers.
See you there 
- Dmitry Vostokov @ DumpAnalysis.org + TraceAnalysis.org -
Posted in Announcements, Archaeology of Computer Memory, Assembly Language, Computer Science, Education and Research, General Memory Analysis, Malware Analysis, Malware Patterns, Memiotics (Memory Semiotics), Memoretics, Memory Analysis Forensics and Intelligence, Memory Analysis Report System, Memory Dump Analysis Services, New Acronyms, Philosophy, Science of Memory Dump Analysis, Science of Software Tracing, Security, Software Trace Analysis, Software Victimology, Structural Memory Patterns, Systems Thinking, Tools, Trace Analysis Patterns, Victimware, Windows System Administration | No Comments »