Archive for the ‘Debugging Industry’ Category
Friday, July 13th, 2012
For some time I was struggling with finding a good name for memory dump and software trace analysis activities. The name Memoretics I use for the science of memory dump analysis (that also incorporates software traces) seems not so good to describe the whole practical activity that should be transparent to everyone in IT. Fortunately, I timely understood that all these activities constitute the essence of software diagnostics that previously lacked any solid foundation. Thus, Software Diagnostics Institute was reborn from the previous Crash Dump Analysis Portal. This institute does pure and applied research and scientific activities and in recent years was funded mainly from OpenTask publisher and recently from Memory Dump Analysis Services. The latter company also recognized that the broadening of its commercial activities requires a new name. So, Software Diagnostics Services was reborn:
The First Comprehensive Software Diagnostics Service
- Dmitry Vostokov @ DumpAnalysis.org + TraceAnalysis.org -
Posted in Announcements, Cloud Memory Dump Analysis, Complete Memory Dump Analysis, Core Dump Analysis, Crash Analysis Report Environment (CARE), Crash Dump Analysis, Debugging, Debugging Bureau, Debugging Industry, Debugging Methodology, Debugging Today, Debugging Trends, Education, Education and Research, Escalation Engineering, Event Tracing for Windows (ETW), First Fault Software Diagnostics, Generative Debugging, JIT Crash Analysis, JIT Memory Space Analysis, Java Debugging, Kernel Development, Kernel Memory Dump Analysis, Linux Crash Corner, MFC Debugging, Mac Crash Corner, Mac OS X, Malware Analysis, Memoretics, Memory Analysis Forensics and Intelligence, Memory Analysis Report System, Memory Dump Analysis Methodology, Memory Dump Analysis Services, Minidump Analysis, New Debugging School, Pattern-Driven Debugging, Pattern-Driven Software Support, Performance Monitoring, Root Cause Analysis, SQL Debugging, Security, Software Debugging Services, Software Diagnostics, Software Diagnostics Institute, Software Diagnostics Services, Software Engineering, Software Problem Solving, Software Technical Support, Software Trace Analysis, Software Trace Analysis Report Environment (STARE), Tools, Training and Seminars, Troubleshooting Methodology, Unified Software Diagnostics, Windows 7, Windows 8, Windows Azure, Windows Mobile, Windows Server 2008, Windows System Administration, x64 Mac OS X, x64 Windows | No Comments »
Sunday, April 1st, 2012
This is a story I would like to present for a possible discussion. A leading debugging services company A was contacted by a company B to analyze dozens of crash dumps for a modest fee*. No NDA was signed and the work was done promptly. Unfortunately there was no response to an invoice and after some time a representative from the company A contacted the company B and got an immediate reply that they were bought by a company C. The new invoice was requested and promptly sent by the company A to the company C. More time passed beyond any reasonable time frame and a representative from the company A contacted the company C again and didn’t get an immediate reply as before. After some time out of the blue came a group reply from all high execs saying that the modest fee cannot be paid because it had to be done by the company B that they bought. And by the way all guys from the company B dealing with the company A were no longer with the company C. The company A pointed out that by an implicit agreement an act of nonpayment from the company B due to unforeseen circumstances automatically made all crash dumps submitted to the company A a property of the company A.
Many would say please contact a lawyer but the modest fee doesn’t worth such a contact. When I devise a happy ending I write a second part.
* an average one day exec salary or less
- Dmitry Vostokov @ DumpAnalysis.org + TraceAnalysis.org -
Posted in Crash Dump Analysis, Crash Dumps and Legal, Debugging, Debugging Industry | 1 Comment »
Sunday, April 1st, 2012
The founder of pattern-driven debugging was invited to HQ a few years ago to join the Corporation and work on what would become the killer of current debuggers and disassemblers.
- Dmitry Vostokov @ DumpAnalysis.org + TraceAnalysis.org -
Posted in Announcements, Debugging, Debugging Industry, Memory Dreams, Pattern-Driven Debugging | No Comments »
Thursday, November 3rd, 2011
The new 6th volume contains revised, edited, cross-referenced, and thematically organized selected DumpAnalysis.org blog posts about memory dump and software trace analysis, software troubleshooting and debugging written in November 2010 - October 2011 for software engineers developing and maintaining products on Windows platforms, quality assurance engineers testing software on Windows platforms, technical support and escalation engineers dealing with complex software issues, and security researchers, malware analysts and reverse engineers. The sixth volume features:
- 56 new crash dump analysis patterns including 14 new .NET memory dump analysis patterns
- 4 new pattern interaction case studies
- 11 new trace analysis patterns
- New Debugware pattern
- Introduction to UI problem analysis patterns
- Introduction to intelligence analysis patterns
- Introduction to unified debugging pattern language
- Introduction to generative debugging, metadefect template library and DNA of software behaviour
- The new school of debugging and trends
- .NET memory dump analysis checklist
- Software trace analysis checklist
- Introduction to close and deconstructive readings of a software trace
- Memory dump analysis compass
- Computical and Stack Trace Art
- The abductive reasoning of Philip Marlowe
- Orbifold memory space and cloud computing
- Memory worldview
- Interpretation of cyberspace
- Relationship of memory dumps to religion
- Fully cross-referenced with Volume 1, Volume 2, Volume 3, Volume 4, and Volume 5
Product information:
- Title: Memory Dump Analysis Anthology, Volume 6
- Author: Dmitry Vostokov
- Language: English
- Product Dimensions: 22.86 x 15.24
- Paperback: 300 pages
- Publisher: Opentask (December 2011)
- ISBN-13: 978-1-908043-19-1
- Hardcover: 300 pages
- Publisher: Opentask (January 2012)
- ISBN-13: 978-1-908043-20-7

Back cover features 3d memory space visualization image created with ParaView.
- Dmitry Vostokov @ DumpAnalysis.org + TraceAnalysis.org -
Posted in .NET Debugging, Announcements, Art, Books, Cloud Computing, Cloud Memory Dump Analysis, Common Mistakes, Complete Memory Dump Analysis, Computer Science, Computicart (Computical Art), Crash Dump Analysis, Crash Dump Patterns, Cyber Intelligence, Cyber Problems, Cyber Security, Cyber Space, Cyber Warfare, DebugWare Patterns, Debugging, Debugging Industry, Debugging Methodology, Debugging Slang, Debugging Trends, Escalation Engineering, Generative Debugging, Intelligence Analysis Patterns, Kernel Development, Memoidealism, Memoretics, Memory Visualization, Metadefect Template Library, New Debugging School, Philosophy, Physicalist Art, Publishing, Root Cause Analysis, Science of Memory Dump Analysis, Science of Software Tracing, Security, Software Behavior DNA, Software Behavior Patterns, Software Behavioral Genome, Software Engineering, Software Narratology, Software Technical Support, Software Trace Analysis, Software Trace Deconstruction, Software Trace Reading, Software Victimology, Testing, The Way of Philip Marlowe, Tools, Trace Analysis Patterns, Training and Seminars, Troubleshooting Methodology, UI Problem Analysis Patterns, Unified Debugging Patterns, Victimware, WinDbg Tips and Tricks, Windows 7, Windows Azure, Windows Data Structures, Windows Server 2008, Windows System Administration, x64 Windows | No Comments »
Sunday, April 17th, 2011
I’m pleased to announce that MDAA, Volume 5 is available in PDF format:
www.dumpanalysis.org/Memory+Dump+Analysis+Anthology+Volume+5
It features:
- 25 new crash dump analysis patterns
- 11 new pattern interaction case studies (including software tracing)
- 16 new trace analysis patterns
- 7 structural memory patterns
- 4 modeling case studies for memory dump analysis patterns
- Discussion of 3 common analysis mistakes
- Malware analysis case study
- Computer independent architecture of crash analysis report service
- Expanded coverage of software narratology
- Metaphysical and theological implications of memory dump worldview
- More pictures of memory space and physicalist art
- Classification of memory visualization tools
- Memory visualization case studies
- Close reading of the stories of Sherlock Holmes: Dr. Watson’s observational patterns
- Fully cross-referenced with Volume 1, Volume 2, Volume 3, and Volume 4
Its table of contents is available here:
www.dumpanalysis.org/MDAA/MDA-Anthology-V5-TOC.pdf
Paperback and hardcover versions should be available in a week or two. I also started working on Volume 6 that should be available in November-December.
- Dmitry Vostokov @ DumpAnalysis.org + TraceAnalysis.org -
Posted in Aesthetics of Memory Dumps, Analysis Notation, Announcements, AntiPatterns, Archaeology of Computer Memory, Art, Assembly Language, Best Practices, Books, C and C++, CDF Analysis Tips and Tricks, Categorical Debugging, Citrix, Common Mistakes, Common Questions, Complete Memory Dump Analysis, Computer Forensics, Computer Science, Crash Analysis Report Environment (CARE), Crash Dump Analysis, Crash Dump De-analysis, Crash Dump Patterns, Crash Dumps for Dummies, Cyber Warfare, Debugging, Debugging Bureau, Debugging Industry, Debugging Methodology, Debugging Slang, Debugging Trends, Deep Down C++, Dr. Watson, Dublin School of Security, Education and Research, Escalation Engineering, Fun with Crash Dumps, Fun with Debugging, Fun with Software Traces, General Memory Analysis, Hermeneutics of Memory Dumps and Traces, Images of Computer Memory, Kernel Development, Malware Analysis, Mathematics of Debugging, Memiotics (Memory Semiotics), Memory Analysis Forensics and Intelligence, Memory Diagrams, Memory Dump Analysis Services, Memory Dumps in Myths, Memory Space Art, Memory Systems Language, Memory Visualization, Memory and Glitches, Metaphysics of Memory Worldview, Multithreading, Music for Debugging, New Acronyms, New Debugging School, New Words, Pattern Models, Philosophy, Physicalist Art, Publishing, Reverse Engineering, Science of Memory Dump Analysis, Science of Software Tracing, Security, Software Architecture, Software Behavior Patterns, Software Chorography, Software Chorology, Software Defect Construction, Software Engineering, Software Generalist, Software Maintenance Institute, Software Narratology, Software Technical Support, Software Trace Analysis, Software Trace Reading, Software Trace Visualization, Software Tracing for Dummies, Software Troubleshooting Patterns, Software Victimology, Structural Memory Patterns, Structural Trace Patterns, Systems Thinking, Testing, The Way of Philip Marlowe, Tools, Trace Analysis Patterns, Training and Seminars, Troubleshooting Methodology, Victimware, Vista, Webinars, WinDbg Scripting Extensions, WinDbg Scripts, WinDbg Tips and Tricks, WinDbg for GDB Users, Windows 7, Windows Server 2008, Windows System Administration, Workaround Patterns, x64 Windows | No Comments »
Saturday, January 1st, 2011
With the new year starts the new initiative to integrate traditional multidisciplinary debugging approaches and methodologies with multiplatform pattern-driven software problem solving, unified debugging patterns, best practices in memory dump analysis and software tracing, computer security, economics, and the new emerging trends I’m going to write about during this year.
- Dmitry Vostokov @ DumpAnalysis.org + TraceAnalysis.org -
Posted in Announcements, Best Practices, Computer Forensics, Computer Science, Countefactual Debugging, Crash Analysis Report Environment (CARE), Crash Dump Analysis, Crash Dump Patterns, DebugWare Patterns, Debugging, Debugging Industry, Debugging Methodology, Debugging Trends, Dublin School of Security, Economics, Education and Research, Escalation Engineering, First Fault Problem Solving, Malware Analysis, Malware Patterns, Mathematics of Debugging, Memiotics (Memory Semiotics), Memoretics, Memory Analysis Forensics and Intelligence, Memory Analysis Report System, Memory Dump Analysis Services, Memory Systems Language, Memory Visualization, New Debugging School, Science of Memory Dump Analysis, Science of Software Tracing, Security, Software Behavior Patterns, Software Defect Construction, Software Engineering, Software Generalist, Software Maintenance Institute, Software Narratology, Software Trace Analysis, Software Trace Visualization, Software Tracing Implementation Patterns, Software Troubleshooting Patterns, Structural Memory Patterns, Structural Trace Patterns, Systems Thinking, Testing, Tool Objects, Tools, Trace Analysis Patterns, Training and Seminars, Troubleshooting Methodology, Unified Debugging Patterns, Victimware, Visual Dump Analysis, Webinars, Workaround Patterns | No Comments »
Friday, December 17th, 2010
As the new decade is approaching (2011-2020) we would like to make a few previews and predictions:
- Increased complexity of software will bring more methods from biological, social sciences and humanities in addition to existing methods of automated debugging and computer science techniques
- Focus on first fault software problem solving (when aspect)
- Focus on pattern-driven software problem solving (how aspect)
- Fusion of debugging and malware analysis into a unified structural and behavioral pattern framework
- Visual debugging, memory and software trace visualization techniques
- Software maintenance certification
- Focus on domain-driven troubleshooting and debugging tools as a service (debugware TaaS)
- Focus on security issues related to memory dumps and software traces
- New scripting languages and programming language extensions for debugging
- The maturation of the science of memory snapshots and software traces (memoretics)
Imagining is not not limited to the above and more to come and explain in the forthcoming parts.
- Dmitry Vostokov @ DumpAnalysis.org + TraceAnalysis.org -
Posted in Announcements, Anthropology, Archaeology of Computer Memory, Biology, Certification, Computer Science, Countefactual Debugging, Crash Analysis Report Environment (CARE), Crash Dump Analysis, Crash Dump Patterns, DebugWare Patterns, Debugging, Debugging Industry, Debugging Methodology, Debugging Trends, Dublin School of Security, EasyDbg, Economics, Escalation Engineering, Evolution, First Fault Problem Solving, Futuristic Memory Dump Analysis, General Memory Analysis, General Science, Geography, Hardware, Hermeneutics of Memory Dumps and Traces, History, Humanities, Language, Laws of Troubleshooting and Debugging, Logic, Malware Analysis, Malware Patterns, Mathematics of Debugging, Memiotics (Memory Semiotics), Memoretics, Memory Analysis Forensics and Intelligence, Memory Analysis Report System, Memory Dump Analysis and History, Memory Systems Language, Memory Visualization, Paleo-debugging, Pattern Models, Pattern Prediction, Physics, Psychology, Publishing, Science of Memory Dump Analysis, Science of Software Tracing, Security, Social Media, Social Sciences, Software Architecture, Software Behavior Patterns, Software Chorography, Software Chorology, Software Defect Construction, Software Engineering, Software Generalist, Software Maintenance Institute, Software Narrative Fiction, Software Narratology, Software Technical Support, Software Trace Analysis, Software Trace Analysis and History, Software Trace Deconstruction, Software Trace Linguistics, Software Trace Visualization, Software Troubleshooting Patterns, Software Victimology, Statistics, Structural Memory Analysis and Social Sciences, Structural Memory Patterns, Structural Trace Patterns, Systems Thinking, Testing, Tools, Trace Analysis Patterns, Troubleshooting Methodology, Unified Debugging Patterns, Uses of UML, Victimware, Virtualization, Visual Dump Analysis, Windows System Administration, Workaround Patterns | No Comments »
Sunday, November 28th, 2010
Do we need to debug, really? (Selling the Debug Ethic1)
Whilst debugging leads to wealth
and will keep you in good health,
so its best to be contented with your bugs.
Debug, boys, debug and be contented,
As long as you’ve enough to buy a computer.
The man, you may rely, will be wealthy by and by,
If he’ll only put his finger to the debugger.
Harry Clifton (1824-1872)
1Bugtated the title of the book I’m reading now and a song from it: Selling the Work Ethic: From Puritan Pulpit to Corporate PR

- Dmitry Vostokov @ DumpAnalysis.org + TraceAnalysis.org -
Posted in Books, Bugtations, Debugging, Debugging Industry, Fun with Debugging, Social Sciences | No Comments »
Thursday, November 25th, 2010
Posted in Announcements, Complete Memory Dump Analysis, Crash Analysis Report Environment (CARE), Crash Dump Analysis, Crash Dump De-analysis, Crash Dump Patterns, Debugging, Debugging Industry, Escalation Engineering, Kernel Development, Memory Analysis Forensics and Intelligence, Memory Dump Analysis Services, Minidump Analysis, Software Behavior Patterns, Software Engineering, Software Technical Support, Software Trace Analysis, Software Troubleshooting Patterns, Tools, Trace Analysis Patterns, Vista, Windows 7, Windows Server 2008, Windows System Administration, Workaround Patterns, x64 Windows | No Comments »
Tuesday, October 5th, 2010
The choice of webinars below mostly reflects my personal preferences and long time desire to speak on topics like systems thinking, troubleshooting tool design and development. The other topic about BSOD minidump analysis was requested by participants in an ongoing survey. There will be more topics in 2011. All forthcoming webinars will be hosted by Memory Dump Analysis Services. The planning list includes:
Systems Thinking in Memory Dump and Software Trace Analysis
Software Troubleshooting and Debugging Tools: Objects, Components, Patterns and Frameworks with UML
- UML basics
- DebugWare patterns
- Unified Troubleshooting Framework
- RADII software development process
- Hands-on exercise: designing and building a tool
Blue Screen Of Death Analysis Done Right: Minidump Investigation for System Administrators
- Making sense of !analyze –v output
- Get extra troubleshooting information with additional WinDbg commands
- Guessing culprits with raw stack analysis
- Who’s responsible: hardware or software?
- Checklist and patterns
- Including hands-on exercises: send your own minidumps
More detailed information will be available soon.
- Dmitry Vostokov @ DumpAnalysis.org + TraceAnalysis.org -
Posted in Announcements, CDF Analysis Tips and Tricks, Common Mistakes, Common Questions, Crash Analysis Report Environment (CARE), Crash Dump Analysis, Crash Dump De-analysis, Crash Dump Patterns, Crash Dumps for Dummies, DebugWare Patterns, Debugging, Debugging Industry, Debugging Methodology, Escalation Engineering, General Memory Analysis, Hermeneutics of Memory Dumps and Traces, Memory Systems Language, Minidump Analysis, Software Architecture, Software Behavior Patterns, Software Engineering, Software Technical Support, Software Trace Analysis, Software Tracing for Dummies, Structural Memory Patterns, Systems Thinking, Tools, Trace Analysis Patterns, Training and Seminars, Troubleshooting Methodology, Vista, Webinars, WinDbg Tips and Tricks, Windows 7, Windows Server 2008, Windows System Administration, x64 Windows | No Comments »
Thursday, September 30th, 2010
The title of these blog post series was motivated by a book I enjoyed reading this summer:
The Altenberg 16: An Exposé of the Evolution Industry

Finally, after thinking and keeping silence (this blog post was in draft folder for several months) I plan an interview next month for a start.
- Dmitry Vostokov @ DumpAnalysis.org + TraceAnalysis.org -
Posted in Announcements, Books, Crash Dump Analysis, Debugging, Debugging Industry, Evolution, Interviews | No Comments »
Thursday, September 30th, 2010
My April fool’s joke about the 5th dump type partially came true. I’ve just noticed the new tab “Silent Process Exit” in gflags.exe on my W2K8 R2 server:
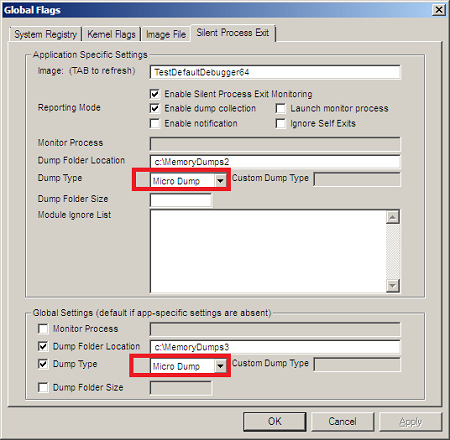
The registry keys corresponding to settings are:
HKEY_LOCAL_MACHINE \ SOFTWARE \ Microsoft \ Windows NT \CurrentVersion \ SilentProcessExit

HKEY_LOCAL_MACHINE \ SOFTWARE \ Microsoft \ Windows NT \ CurrentVersion \ SilentProcessExit \ TestDefaultDebugger64

DumpType (DWORD) 0x88
I continue my investigation and report more later.
- Dmitry Vostokov @ DumpAnalysis.org + TraceAnalysis.org -
Posted in Announcements, Crash Dump Analysis, Debugging, Debugging Industry, Fun with Crash Dumps, Fun with Debugging | No Comments »