Archive for November, 2011
Tuesday, November 29th, 2011
A page to reference all different kinds of exception related patterns is necessary, so I created this post:
I’ll update it as soon as I add more similar patterns.
- Dmitry Vostokov @ DumpAnalysis.org + TraceAnalysis.org -
Posted in Crash Dump Analysis, Crash Dump Patterns, Debugging | No Comments »
Tuesday, November 29th, 2011
One pattern I missed is called FPU Exception and it sometimes happens where you least expect it. Here’s extract from one crash dump raw stack analysis showing exception context, record and the usage of r WinDbg command variant to display FPU registers:
0:002> dps 056c1000 057c0000

[...]

057bdee0  00000008

057bdee4  00000000

057bdee8  057bed6c

057bdeec  0d6e3130

057bdef0  057c0000

057bdef4  057b9000

057bdef8  006e3138

057bdefc  057be200

057bdf00  7c90e48a ntdll!KiUserExceptionDispatcher+0xe

057bdf04  057bed6c

057bdf08  057bdf2c

057bdf0c  057bdf14

057bdf10  057bdf2c

057bdf14  c0000090

057bdf18  00000010

057bdf1c  00000000

057bdf20  79098cc0 mscorjit!Compiler::FlatFPIsSameAsFloat+0xd

057bdf24  00000001

057bdf28  00000000

057bdf2c  0001003f

057bdf30  00000000

057bdf34  00000000

057bdf38  00000000

057bdf3c  00000000

057bdf40  00000000

057bdf44  00000000

057bdf48  ffff1372

057bdf4c  fffffda1

057bdf50  ffffbfff

[…]
0:002> .cxr 057bdf2c

eax=c0000090 ebx=00000000 ecx=c0000090 edx=00000000 esi=057be244 edi=001d4388

eip=79f5236b esp=057be1f8 ebp=057be200 iopl=0         nv up ei ng nz ac pe cy

cs=001b  ss=0023  ds=0023  es=0023  fs=003b  gs=0000             efl=00010297

mscorwks!SOTolerantBoundaryFilter+0x22:

79f5236b d9059823f579    fld     dword ptr [mscorwks!_real (79f52398)] ds:0023:79f52398=40800000
0:002> .exr 057bdf14

ExceptionAddress: 79098cc0 (mscorjit!Compiler::FlatFPIsSameAsFloat+0x0000000d)

   ExceptionCode: c0000090

  ExceptionFlags: 00000010

NumberParameters: 1

   Parameter[0]: 00000000
0:002> !error c0000090

Error code: (NTSTATUS) 0xc0000090 (3221225616) - {EXCEPTION}  Floating-point invalid operation.
0:002> rMF

Last set context:

eax=c0000090 ebx=00000000 ecx=c0000090 edx=00000000 esi=057be244 edi=001d4388

eip=79f5236b esp=057be1f8 ebp=057be200 iopl=0         nv up ei ng nz ac pe cy

cs=001b  ss=0023  ds=0023  es=0023  fs=003b  gs=0000             efl=00010297

fpcw=1372: rn 64 pu–d-  fpsw=FDA1: top=7 cc=1101 b-p—-i  fptw=BFFF

fopcode=045D  fpip=001b:79098cc0  fpdp=0023:057bea7c

st0=-1.#IND00000000000000000e+0000  st1= 0.006980626232475338220e-4916

st2= 6.543831490564206840810e-4932  st3=-0.003025663186207448300e+2614

st4= 2.000000000000000000000e+0000  st5= 6.291456000000000000000e+0006

st6= 1.000000000000000000000e+0000  st7= 2.500000000000000000000e-0001

mscorwks!SOTolerantBoundaryFilter+0×22:

79f5236b d9059823f579    fld     dword ptr [mscorwks!_real (79f52398)] ds:0023:79f52398=40800000
- Dmitry Vostokov @ DumpAnalysis.org + TraceAnalysis.org -
Posted in Crash Dump Analysis, Crash Dump Patterns, Debugging, WinDbg Tips and Tricks | No Comments »
Tuesday, November 22nd, 2011
If memory is the foundation of everything and the first principle then what about matter? We view matter as curvature of memory (currently metaphorically) and also as a constraining “filter” device that limits (and processes) memories. The latter view of limits is similar to some theories viewing brain (body) as a constraining device for mental reality (consciousness)*.
(*) Irreducible Mind (Kelly & Kelly et al.), pp. 28-29
- Dmitry Vostokov @ DumpAnalysis.org + TraceAnalysis.org -
Posted in Memoidealism, Metaphysics of Memory Worldview, Philosophy | No Comments »
Tuesday, November 22nd, 2011
Frequently we observe that several trace messages form a single semantic unit we call Macrofunction where individual trace messages serve the role of microfunctions. We borrowed this idea and distinction from functionalist linguistics. An example would be a software trace fragment where messages log an attempt to update a database:
#     Module   PID  TID   Time         Message

[...]

42582 DBClient 5492 9476  11:04:33.398 Opening connection

[...]

42585 DBClient 5492 9476  11:04:33.398 Sending SQL command

[...]

42589 DBServer 6480 10288 11:04:33.399 Executing SQL command

[...]

42592 DBClient 5492 9476  11:04:33.400 Closing connection

[...]
Please note that these macrofunctions need not be from the same ATID in the traditional sense like in the example above unless we form adjoint threads from certain fragments like “DB”.
- Dmitry Vostokov @ DumpAnalysis.org + TraceAnalysis.org -
Posted in Debugging, Software Narratology, Software Trace Analysis, Software Trace Linguistics, Trace Analysis Patterns | No Comments »
Thursday, November 17th, 2011
LoL - Law of Large
Examples: Q. How did you resolve this support case? A. LoL number!
Explanation: The more support incidents you get, the larger their tracking numbers. So at some stage the law of large numbers comes into effect: there is always a similar incident in the past. Don’t confuse with LOL.
- Dmitry Vostokov @ DumpAnalysis.org + TraceAnalysis.org -
Posted in Debugging, Debugging Slang, Escalation Engineering, Fun with Debugging, Laws of Troubleshooting and Debugging, Mathematics of Technical Support, Software Technical Support | No Comments »
Monday, November 14th, 2011
This is a new exiting book project I’m working on now scheduled for release in 2012 with ISBN 978-1908043337. If your company would like to have its programs considered for inclusion please let me know and send a copy just in case I would need to include screenshots. I’ll update about this project soon.
Posted in Announcements, Books, Software and History | No Comments »
Sunday, November 13th, 2011
During the previous several months some companies and individuals expressed their interest in the training (the next one is scheduled for January) but its time was not suitable due to different geographic time zones. So I have decided to publish this training in a book format (currently in PDF) and make it available in paperback on Amazon and B&N later. Book details:
- Title: Accelerated .NET Memory Dump Analysis: Training Course Transcript and WinDbg Practice Exercises with Notes
- Description: The full transcript of Memory Dump Analysis Services Training with 7 step-by-step exercises, notes, source code of specially created modeling applications and selected Q&A. Covers 20 .NET memory dump analysis patterns plus additional unmanaged patterns.
- Authors: Dmitry Vostokov, Memory Dump Analysis Services
- Publisher: OpenTask (November 2011)
- Language: English
- Product Dimensions: 28.0 x 21.6
- Paperback: 204 pages
- ISBN-13: 978-1908043320
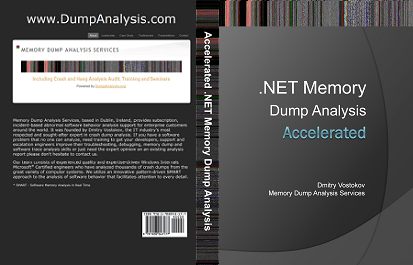
Table of Contents
Now available for sale in PDF format from Memory Dump Analysis Services.
- Dmitry Vostokov @ DumpAnalysis.org + TraceAnalysis.org -
Posted in .NET Debugging, Announcements, Books, Crash Dump Analysis, Crash Dump Patterns, Debugging, Escalation Engineering, Medicine, Memory Dump Analysis Services, Publishing, Software Engineering, Software Technical Support, Testing, Tools, Training and Seminars, WinDbg Tips and Tricks | No Comments »
Friday, November 11th, 2011
This is a name for a virtual country where I’m a virtual citizen. This coined word is the latest addition to Citrixware and Citrixofication together with I Love Citrix social media logo.
- Dmitry Vostokov @ DumpAnalysis.org + TraceAnalysis.org -
Posted in Citrix, Cloud Computing, History, New Words, Social Media, Virtualization | No Comments »
Friday, November 11th, 2011
This is a second long-term initiative for 2012 to design and develop memory-oriented operating system where memory is the foundation of the whole architecture from the ground up. More on this later as the announcement date and time memory pattern 11-11-11 11:11 is quickly approaching 
- Dmitry Vostokov @ DumpAnalysis.org + TraceAnalysis.org -
Posted in Announcements, Computer Science, Memory OS, Software Architecture | 1 Comment »
Friday, November 11th, 2011
One of the new initiatives for 2012 is the development of SPDL (Software Problem Description Language). Its purpose is automatic generation of a software troubleshooting tool(s) based on the description of a problem. Here software problem means a post-construction problem as outlined in Introduction to Pattern-Driven Software Problem Solving. The tool construction will utilize an expanded set of DebugWare and Workaround patterns together with the refind version of RADII software development process. This will also provide necessary effectiveness, efficiency and enhanced problem solving capabilities to existing TaaS (Tools as a Service) implementations that are limited in the number of tools they offer.
- Dmitry Vostokov @ DumpAnalysis.org + TraceAnalysis.org -
Posted in Announcements, Computer Science, Crash Dump Analysis, DebugWare Patterns, Debugging, Generative Debugging, New Acronyms, New Debugging School, SPDL, Software Behavior DNA, Software Behavior Patterns, Software Behavioral Genome, Software Engineering, Software Problem Solving, Software Technical Support, Software Trace Analysis, Software Troubleshooting Patterns, Software and Modeling, TaaS, Testing, Tool Objects, Tools, Troubleshooting Methodology, Unified Debugging Patterns, Windows System Administration | No Comments »
Thursday, November 10th, 2011
Hidden Parameter pattern is a variant of Execution Residue and String Parameter where we have parameters left out from stack trace due to register calling conventions and compiler optimizations. However, raw stack analysis in a region around stack frames of interest we find what we are looking for. Here’s an example from an x64 system blocked thread waiting for data from a named pipe:
0: kd> kL

  *** Stack trace for last set context - .thread/.cxr resets it

Child-SP          RetAddr           Call Site

fffffa60`2c3627d0 fffff800`018b90fa nt!KiSwapContext+0x7f

fffffa60`2c362910 fffff800`018add3b nt!KiSwapThread+0x13a

fffffa60`2c362980 fffff800`01b2121f nt!KeWaitForSingleObject+0x2cb

fffffa60`2c362a10 fffff800`01b319b6 nt!IopXxxControlFile+0xdeb

fffffa60`2c362b40 fffff800`018b68f3 nt!NtFsControlFile+0x56

fffffa60`2c362bb0 00000000`778d6eaa nt!KiSystemServiceCopyEnd+0x13

00000000`11f4da68 00000000`77767b6e ntdll!ZwFsControlFile+0xa

00000000`11f4da70 000007fe`ff94abc8 kernel32!WaitNamedPipeW+0×22f

00000000`11f4db60 000007fe`ff98a32d RPCRT4!NdrProxyForwardingFunction255+0×814d

00000000`11f4dc30 000007fe`ff98918b RPCRT4!OSF_CCONNECTION::TransOpen+0xcd

00000000`11f4dcc0 000007fe`ff988f9b RPCRT4!OSF_CCONNECTION::OpenConnectionAndBind+0×17b

00000000`11f4dd90 000007fe`ff988ec6 RPCRT4!OSF_CCALL::BindToServer+0xbb

00000000`11f4de40 000007fe`ff983368 RPCRT4!OSF_BINDING_HANDLE::InitCCallWithAssociation+0xa5

00000000`11f4dea0 000007fe`ff983220 RPCRT4!OSF_BINDING_HANDLE::AllocateCCall+0×118

00000000`11f4dfd0 000007fe`ffa1f740 RPCRT4!OSF_BINDING_HANDLE::NegotiateTransferSyntax+0×30

00000000`11f4e020 000007fe`ffa1fecb RPCRT4!Ndr64pClientSetupTransferSyntax+0×200

00000000`11f4e080 000007fe`ffa20281 RPCRT4!NdrpClientCall3+0×6b

00000000`11f4e2d0 000007fe`fe087c8c RPCRT4!NdrClientCall3+0xdd

[…]
Even if we disassemble the return address of a caller of WaitNamedPipeW function we won’t easily find the passed first string parameter (named pipe name) unless we do a substancial reverse engineering and data flow analysis:
0: kd> ub 000007fe`ff94abc8

RPCRT4!_imp_load_getaddrinfo+0×7:

000007fe`ff94ab9f jmp     RPCRT4!_tailMerge_WS2_32_dll (000007fe`ff94cef8)

000007fe`ff94aba4 call    qword ptr [RPCRT4!_imp_GetLastError (000007fe`ffa2d528)]

000007fe`ff94abaa mov     r12d,eax

000007fe`ff94abad cmp     r12d,0E7h

000007fe`ff94abb4 jne     RPCRT4!NdrProxyForwardingFunction255+0×8193 (000007fe`ff99c8fb)

000007fe`ff94abba mov     edx,3E8h

000007fe`ff94abbf mov     rcx,rsi

000007fe`ff94abc2 call    qword ptr [RPCRT4!_imp_WaitNamedPipeW (000007fe`ffa2d3f8)]
So dumping raw stack date around corresponding frames give us pipe name clue and possible service to look further:
0: kd> dpu 00000000`11f4da70

00000000`11f4da70  00000000`11f4dba8 “\\.\PIPE\ServiceArpc”

00000000`11f4da78  00000000`00000000

00000000`11f4da80  00000000`00000000

00000000`11f4da88  00000000`000003e8

00000000`11f4da90  00000000`11f4db30

00000000`11f4da98  00000000`00110018

00000000`11f4daa0  00000000`0d9001a0

00000000`11f4daa8  00000000`0000001a

00000000`11f4dab0  00000000`00000000

00000000`11f4dab8  00000000`00000000

00000000`11f4dac0  00000000`0020000c

00000000`11f4dac8  00000000`0d9001e2 “ServiceArpc”

00000000`11f4dad0  00000000`00000000

00000000`11f4dad8  00000000`00000000

00000000`11f4dae0  00000000`00240022
- Dmitry Vostokov @ DumpAnalysis.org + TraceAnalysis.org -
Posted in Crash Dump Analysis, Crash Dump Patterns, Debugging, x64 Windows | 1 Comment »
Sunday, November 6th, 2011
Posted in .NET Debugging, Crash Dump Analysis, Crash Dump Patterns, Debugging, Escalation Engineering, Memory Dump Analysis Services, Software Engineering, Software Technical Support, Testing, Training and Seminars, WinDbg Tips and Tricks | 2 Comments »
Thursday, November 3rd, 2011
The new 6th volume contains revised, edited, cross-referenced, and thematically organized selected DumpAnalysis.org blog posts about memory dump and software trace analysis, software troubleshooting and debugging written in November 2010 - October 2011 for software engineers developing and maintaining products on Windows platforms, quality assurance engineers testing software on Windows platforms, technical support and escalation engineers dealing with complex software issues, and security researchers, malware analysts and reverse engineers. The sixth volume features:
- 56 new crash dump analysis patterns including 14 new .NET memory dump analysis patterns
- 4 new pattern interaction case studies
- 11 new trace analysis patterns
- New Debugware pattern
- Introduction to UI problem analysis patterns
- Introduction to intelligence analysis patterns
- Introduction to unified debugging pattern language
- Introduction to generative debugging, metadefect template library and DNA of software behaviour
- The new school of debugging and trends
- .NET memory dump analysis checklist
- Software trace analysis checklist
- Introduction to close and deconstructive readings of a software trace
- Memory dump analysis compass
- Computical and Stack Trace Art
- The abductive reasoning of Philip Marlowe
- Orbifold memory space and cloud computing
- Memory worldview
- Interpretation of cyberspace
- Relationship of memory dumps to religion
- Fully cross-referenced with Volume 1, Volume 2, Volume 3, Volume 4, and Volume 5
Product information:
- Title: Memory Dump Analysis Anthology, Volume 6
- Author: Dmitry Vostokov
- Language: English
- Product Dimensions: 22.86 x 15.24
- Paperback: 300 pages
- Publisher: Opentask (December 2011)
- ISBN-13: 978-1-908043-19-1
- Hardcover: 300 pages
- Publisher: Opentask (January 2012)
- ISBN-13: 978-1-908043-20-7

Back cover features 3d memory space visualization image created with ParaView.
- Dmitry Vostokov @ DumpAnalysis.org + TraceAnalysis.org -
Posted in .NET Debugging, Announcements, Art, Books, Cloud Computing, Cloud Memory Dump Analysis, Common Mistakes, Complete Memory Dump Analysis, Computer Science, Computicart (Computical Art), Crash Dump Analysis, Crash Dump Patterns, Cyber Intelligence, Cyber Problems, Cyber Security, Cyber Space, Cyber Warfare, DebugWare Patterns, Debugging, Debugging Industry, Debugging Methodology, Debugging Slang, Debugging Trends, Escalation Engineering, Generative Debugging, Intelligence Analysis Patterns, Kernel Development, Memoidealism, Memoretics, Memory Visualization, Metadefect Template Library, New Debugging School, Philosophy, Physicalist Art, Publishing, Root Cause Analysis, Science of Memory Dump Analysis, Science of Software Tracing, Security, Software Behavior DNA, Software Behavior Patterns, Software Behavioral Genome, Software Engineering, Software Narratology, Software Technical Support, Software Trace Analysis, Software Trace Deconstruction, Software Trace Reading, Software Victimology, Testing, The Way of Philip Marlowe, Tools, Trace Analysis Patterns, Training and Seminars, Troubleshooting Methodology, UI Problem Analysis Patterns, Unified Debugging Patterns, Victimware, WinDbg Tips and Tricks, Windows 7, Windows Azure, Windows Data Structures, Windows Server 2008, Windows System Administration, x64 Windows | No Comments »
Wednesday, November 2nd, 2011
Sometimes we have Linked Messages through some common parameter or attribute. One such example can be found in ETW traces related to kernel process creation notifications. Here we got adjoint thread for module PIDNotify:
#      Module    PID  TID  Time         Message

[...]

128762 PIDNotify 1260 6208 15:53:15.691 Create: ParentID 0x000004EC PID 0×000018D4

[…]

128785 PIDNotify 6356 6388 15:53:15.693 Load: ImageName \Device\HarddiskVolume1\Windows\System32\abscript.exe PID 0×000018D4

[…]

131137 PIDNotify 6356 4568 15:53:15.936 Create: ParentID 0×000018D4 PID 0×00001888

[…]

131239 PIDNotify 6280 6376 15:53:15.958 Load: ImageName \Device\HarddiskVolume1\Windows\System32\wscript.exe PID 0×00001888

[…]

132899 PIDNotify 6356 5704 15:53:16.462 Create: ParentID 0×000018D4 PID 0×00001FD0

[…]

132906 PIDNotify 8144 7900 15:53:16.464 Load: ImageName \Device\HarddiskVolume1\Windows\System32\cmd.exe PID 0×00001FD0

[…]
We see that messages 128762 and 128785 are linked through PID parameter and linked to messages 131137 and 132899 through PID - ParentID parameter relationship. Similar linkages exist for messages 131137 / 131239 and 132899 / 132906.
- Dmitry Vostokov @ DumpAnalysis.org + TraceAnalysis.org -
Posted in CDF Analysis Tips and Tricks, Debugging, Software Trace Analysis, Trace Analysis Patterns | 1 Comment »