Archive for the ‘Software Trace Linguistics’ Category
Wednesday, July 8th, 2026
A single trace may reveal only a partial diagnostic world. An application trace may show requests and exceptions. A security trace may show tokens, scopes, and access decisions. An operations trace may show retries, timeouts, latency, and resource pressure. An AI/ML trace may show prompts, tool calls, agent decisions, model responses, and memory updates:
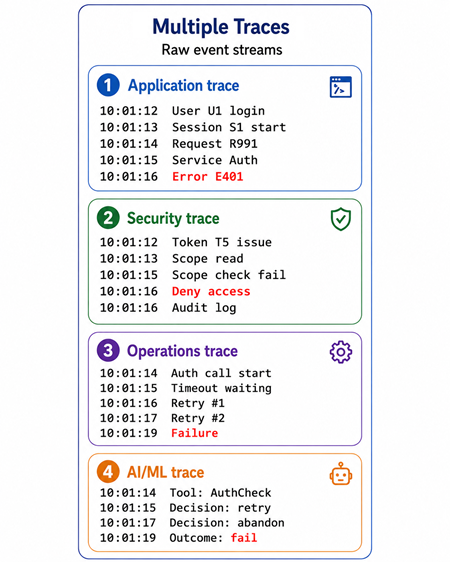
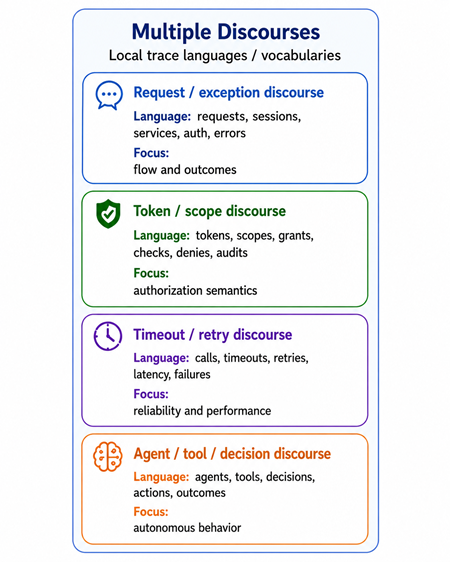
However, different traces are not only different in content. They may also belong to different Implementation Discourses. The earlier Implementation Discourse analysis pattern observes that non-trivial traces contain different discourses because components are written in different languages and follow different runtime environments, binary models, and interface frameworks. These implementation variations influence the structure, syntax, and semantics of trace messages; for example, .NET traces differ from file system driver traces or COM debugging messages:
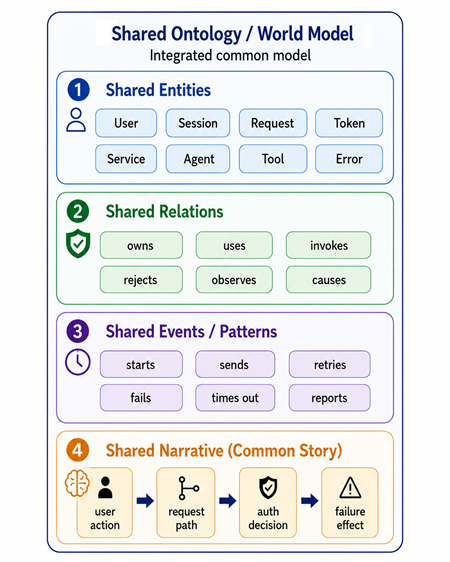
Trace World builds on this idea: it is a trace and log analysis pattern in which multiple traces, logs, telemetry streams, and diagnostic Trace Viewpoints contribute to a shared ontology of entities, relations, events, and narratives. The key idea is that multiple traces do not merely sit side by side. They share and enrich the same diagnostic ontology. As more traces are added, the Trace World becomes richer: new entities appear, existing entities are connected, relations become clearer, and the common narrative becomes more complete:
Therefore, Implementation Discourse is the local linguistic form of trace evidence, while Trace World is the shared world model that allows those local discourses to be translated, aligned, and used together. Implementation Discourse: How this component, runtime, framework, or language speaks in the trace. Trace World: How many such trace languages contribute to one shared diagnostic world. This also clarifies the relationship to Trace Ontology, which extracts entities, events, and relations from a trace, whereas Trace World allows multiple traces and multiple implementation discourses to share and enrich the same ontology.
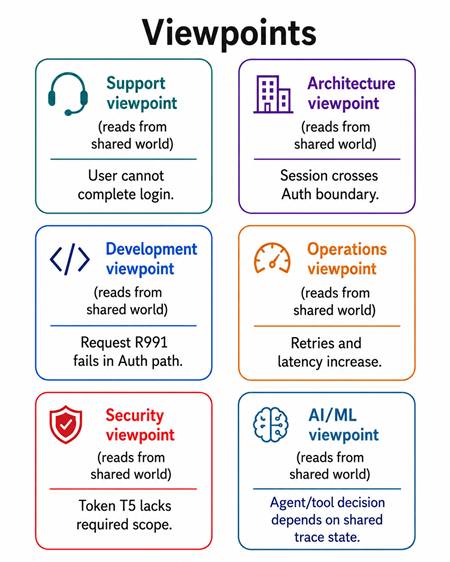
Compared to Trace Viewpoints, which are different ways of reading the same trace world, and Implementation Discourses, which are different trace languages used to express evidence, Trace World is the common diagnostic world that persists when we move across both viewpoints and implementation discourses:
In agentic AI systems, this becomes especially important. Prompt traces, tool-call traces, memory traces, policy traces, model inference traces, application logs, and infrastructure telemetry may all speak different implementation discourses. Trace World provides the common diagnostic world where agents, tools, prompts, observations, memories, users, services, policies, and failures can be connected.
In summary, Trace World is the shared diagnostic world formed when multiple trace discourses enrich the same ontology, allowing analysts to move across viewpoints without losing entity identity, relations, or narrative continuity.
This analysis pattern is useful when:
- Several traces describe the same incident from different systems.
- Components use different trace languages, formats, and conventions.
- Different runtimes or frameworks produce structurally different messages, including Embedded Traces.
- The same entity appears under different names in different traces.
- A failure crosses application, infrastructure, security, data, or AI boundaries.
- A single trace discourse is insufficient to reconstruct the diagnostic story.
For constructing the Trace World, typical analysis steps may be these:
- Identify the Implementation Discourse of each trace.
- Extract Basic Facts from each discourse.
- Identify local entities, events, and relations.
- Map equivalent entities across discourses.
- Merge them into a shared Trace World ontology.
- Add relations that become visible only across traces.
- Build a common narrative across implementation boundaries.
- Use Trace Viewpoints to read the same world from different skill perspectives.
However, there might be some problems when using Trace World analysis pattern:
- Discourse isolation: each trace language remains separate.
- Translation gap: no mapping exists between local trace terms.
- Identity mismatch: the same entity has different names in different discourses.
- Semantic drift or incompatible Semantic Mappings: similar words mean different things in different traces.
- Partial or incompatible Trace Ontologies: one discourse lacks entities needed to explain another.
- Conflicting narrative: traces imply different causal stories.
- Unenriched world: traces are collected but not integrated.
- Dmitry Vostokov @ DumpAnalysis.org + TraceAnalysis.org -
Posted in Agentic AI, Log Analysis, Software Narratology, Software Trace Analysis, Software Trace Linguistics, Trace Analysis Patterns | Comments Off
Tuesday, February 7th, 2023
For any Message Complex, we can choose the corresponding Tracemes and assign them to points. If we keep ourselves only to line segments, we call these arrangements Trace Molecules. One example is illustrated in the following diagram:
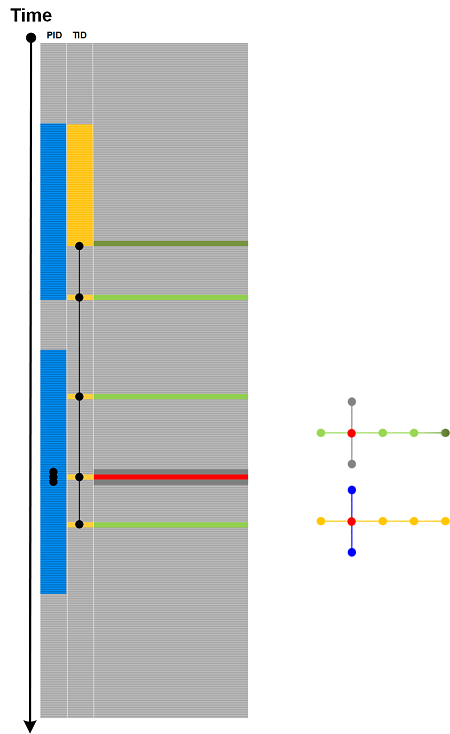
This molecular approach was inspired by semic molecules in semic analysis. On the other hand, ultimately, the whole trace is one giant molecule similar to the traces and logs as proteins metaphor. This approach differs from the earlier artificial chemistry approach to trace and log analysis where molecules are patterns.
- Dmitry Vostokov @ DumpAnalysis.org + TraceAnalysis.org -
Posted in Chemistry, Log Analysis, Semantics, Semiotics, Software Trace Analysis, Software Trace Linguistics, Trace Analysis Patterns | Comments Off
Monday, February 6th, 2023
Consider the following trace message:
object: 0x77F468AB100 ref: 2
It contains several Tracemes, the smallest units of tracing (trace meaning, by analogy with semes), corresponding to Message Invariants and their data: //object memory address//, and //reference count//. However, they are structurally higher in the semantic hierarchy when compared with sememes. Traceme is pronounced /tɹeɪˈsiːm/ and can also be interpreted as trace me.
- Dmitry Vostokov @ DumpAnalysis.org + TraceAnalysis.org -
Posted in Log Analysis, Semantics, Semiotics, Software Trace Analysis, Software Trace Linguistics, Trace Analysis Patterns | Comments Off
Sunday, October 25th, 2020
Ideally a trace or log message should contain only one piece of information including associated data. However, some Multidimensional Messages may contain unrelated information, including several Message Invariants and variable data places, for example: “Entry GetData. Error opening file: 0×5″ or “Window handle: 0xa60834 pHandler: 0×456210F0″. Such messages may be split into several independent messages and, if necessary, additional ATIDs (new Adjoint Threads of Activity) may be added like depicted in this diagram of Combed Trace:
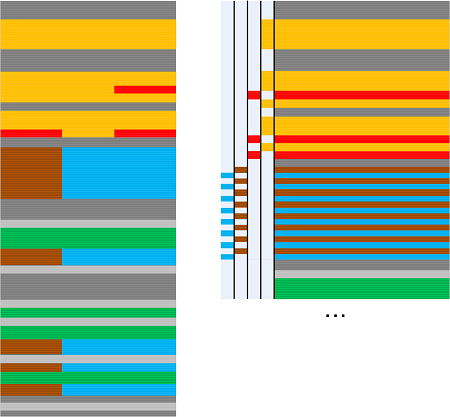
Another example is Exception Stack Trace messages in some logging implementations.
- Dmitry Vostokov @ DumpAnalysis.org + TraceAnalysis.org -
Posted in Log Analysis, Software Trace Analysis, Software Trace Linguistics, Trace Analysis Patterns | No Comments »
Friday, July 31st, 2020
Semantic Field is a set of messages that belong to particular category or subject:
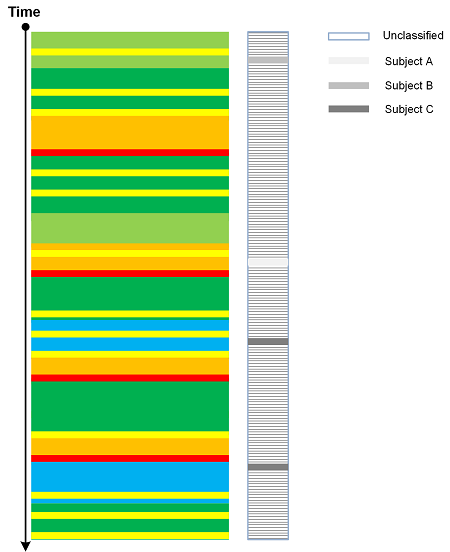
It is different from Trace Field which is a function, not an already prepared codomain of mapping.
Some Semantic Fields may be formed by the analysis of Implementation Discourse, for example using machine learning techniques.
The pattern name was inspired by semantic field in linguistics and came to our attention when reading “German Loanwords in English: An Historical Dictionary” book.
- Dmitry Vostokov @ DumpAnalysis.org + TraceAnalysis.org -
Posted in Log Analysis, Software Trace Analysis, Software Trace Linguistics, Trace Analysis Patterns | No Comments »
Thursday, March 14th, 2013
If Implementation Discourse focuses on objective technology specific discourse then Traces of Individuality pattern focuses on subjective elements in a software log and its messages. Here we mean some specific naming or tracing conventions either from an individual engineer habit or from some corporate coding standard. As an example of it consider a trace message from a catch statement:
"Surprise, surprise, should have never been caught"
More examples for this pattern will be added later.
- Dmitry Vostokov @ DumpAnalysis.org + TraceAnalysis.org -
Posted in Software Trace Analysis, Software Trace Deconstruction, Software Trace Linguistics, Software Trace Reading, Software Trace Stylistics, Trace Analysis Patterns | No Comments »
Sunday, April 15th, 2012
In a week this short full color book should appear in online bookstores:
- Title: Software Narratology: An Introduction to the Applied Science of Software Stories
- Authors: Dmitry Vostokov, Memory Dump Analysis Services
- Description: This is a transcript of Memory Dump Analysis Services Webinar about Software Narratology: an exciting new discipline and a field of research founded by DumpAnalysis.org. When software executes it gives us its stories in the form of UI events, software traces and logs. Such stories can be analyzed for their structure and patterns for troubleshooting, debugging and problem resolution purposes. Topics also include software narremes and their types, anticipatory software construction and software diagnostics.
- Publisher: OpenTask (April 2012)
- Language: English
- Product Dimensions: 28.0 x 21.6
- Paperback: 26 pages
- ISBN-13: 978-1908043078

- Dmitry Vostokov @ DumpAnalysis.org + TraceAnalysis.org -
Posted in Announcements, Books, CDF Analysis Tips and Tricks, Code Reading, Computer Science, Debugging, Debugging Methodology, Debugging Trends, Education and Research, Escalation Engineering, Event Tracing for Windows (ETW), Hermeneutics of Memory Dumps and Traces, Ideas, Narralog Programming Language, New Debugging School, Pattern-Driven Debugging, Pattern-Driven Software Support, Presentations, Publishing, Root Cause Analysis, SPDL, Science of Software Tracing, Software Behavior DNA, Software Behavior Patterns, Software Behavioral Genome, Software Diagnostics, Software Engineering, Software Narrative Fiction, Software Narrative Science, Software Narratology, Software Narremes, Software Problem Description Patterns, Software Problem Solving, Software Technical Support, Software Trace Analysis, Software Trace Analysis and History, Software Trace Deconstruction, Software Trace Linguistics, Software Trace Modeling, Software Trace Reading, Software Trace Visualization, Software Tracing Implementation Patterns, Software Troubleshooting Patterns, Structural Trace Patterns, Systems Thinking, Testing, Tools, Trace Analysis Patterns, Training and Seminars, Troubleshooting Methodology, UI Problem Analysis Patterns, Unified Debugging Patterns, Unified Software Diagnostics, Webinars | No Comments »
Sunday, March 11th, 2012
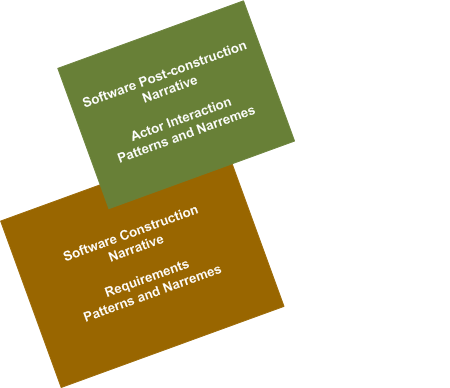
Based on an idea of expression and content planes from glossematics with a basic unit of glosseme we can organize software traces with corresponding patterns and software trace narremes (basic units of software narrative such as traces and event logs) into 2 planes: software trace narrative plane (expression) with narremes and the corresponding program lines of traces (PLOTs) source code and design plane (content) with their own set of construction narremes such as collaboration of software constructs. All this corresponds to the following diagram:

The same can be said about actor interaction level of software construction (what ought to be) and post-construction (what is) phases having their own construction and post-construction narratives, patterns and narremes such as in requirements (use cases) and in problem and software incident descriptions:
In the forthcoming articles I provide more examples and explanations including specific software narremes useful from the practical post-construction software problem solving perspective. Please also register for the forthcoming free Webinar: Introduction to Software Narratology where I plan to provide a coherent overview of this new field.
- Dmitry Vostokov @ DumpAnalysis.org + TraceAnalysis.org -
Posted in Computer Science, Science of Software Tracing, Software Narratology, Software Narremes, Software Problem Solving, Software Trace Analysis, Software Trace Linguistics | No Comments »
Sunday, February 19th, 2012
Memory Dump Analysis Services (DumpAnalysis.com) organizes a free Webinar about software narratology: an application of ideas from narratology to software narrative stories.

Learn about this exciting new discipline and a field of research. When software executes it gives us its stories in the form of UI events, software traces and logs. Such stories can be analyzed for their structure and patterns for troubleshooting, debugging and problem resolution purposes.
Prerequisites: basic software troubleshooting and ability to read software generated logs.
Audience: anyone can benefit from this new perspective: from software users to software engineers and managers.
Space is limited.
Reserve your Webinar seat now at:
https://www3.gotomeeting.com/register/603136294
- Dmitry Vostokov @ DumpAnalysis.org + TraceAnalysis.org -
Posted in Announcements, Computer Science, Debugging, Escalation Engineering, Intelligence Analysis Patterns, Memory Dump Analysis Services, SPDL, Science of Software Tracing, Security, Software Behavior DNA, Software Behavior Patterns, Software Behavioral Genome, Software Engineering, Software Narrative Fiction, Software Narratology, Software Problem Description Patterns, Software Problem Solving, Software Technical Support, Software Trace Analysis, Software Trace Deconstruction, Software Trace Linguistics, Software Trace Modeling, Software Trace Reading, Software Trace Visualization, Software Tracing Implementation Patterns, Software Tracing for Dummies, Software Troubleshooting Patterns, Software Victimology, Structural Trace Patterns, Testing, Tools, Trace Analysis Patterns, Troubleshooting Methodology, UI Problem Analysis Patterns, Unified Debugging Patterns, Unit Testing, Victimware, Webinars, Windows System Administration | No Comments »
Monday, January 2nd, 2012
Based on ideas of Roman Jakobson about “marked” and “unmarked” categories we propose another pattern called Marked Message that groups trace messages based on having some feature or property. For example, marked messages may point to some domain of software activity such related to functional requirements and therefore may help in troubleshooting and debugging. Unmarked messages include all other messages that don’t say anything about such activities (although may include messages pointing to such activities indirectly we unaware of) or messages that say explicitly that no such activity has occurred. We can even borrow a notation of distinctive features from phonology and annotate any trace or log after analysis to compare it with a master trace, for example, compose the following list of software trace distinctive features:
session database queries [+]
session initialization [-]
socket activity [+]
process A launched [+]
process B launched [-]
process A exited [-]
[…]
Here [+] means the activity is present in the trace and [-] means the activity is either undetected or definitely not present. Sometime a non-present activity can be a marked activity corresponding to all inclusive unmarked present activity (see, for example, No Activity pattern).
- Dmitry Vostokov @ DumpAnalysis.org + TraceAnalysis.org -
Posted in Debugging, Science of Software Tracing, Software Narratology, Software Trace Analysis, Software Trace Linguistics, Software Trace Reading, Trace Analysis Patterns | No Comments »
Saturday, December 17th, 2011
The number of software trace analysis patterns approaches the critical mass of 50 and we have decided to focus on software tracing and logging in the forthcoming year. Some books on tracing including Volume 7 of Memory Dump Analysis Anthology will be published by OpenTask during that year and our efforts will be to further advance software narratology, software trace linguistics, and software trace analysis in the context of memory dump analysis, generative debugging and modeling software behavior.
- Dmitry Vostokov @ DumpAnalysis.org + TraceAnalysis.org -
Posted in Announcements, CDF Analysis Tips and Tricks, Debugging, Generative Debugging, Memoretics, Science of Software Tracing, Software Behavior DNA, Software Behavior Patterns, Software Behavioral Genome, Software Narratology, Software Trace Analysis, Software Trace Analysis and History, Software Trace Deconstruction, Software Trace Linguistics, Software Trace Reading, Software Trace Visualization, Software Tracing Implementation Patterns, Software Tracing for Dummies, Trace Analysis Patterns | No Comments »
Tuesday, November 22nd, 2011
Frequently we observe that several trace messages form a single semantic unit we call Macrofunction where individual trace messages serve the role of microfunctions. We borrowed this idea and distinction from functionalist linguistics. An example would be a software trace fragment where messages log an attempt to update a database:
#     Module   PID  TID   Time         Message

[...]

42582 DBClient 5492 9476  11:04:33.398 Opening connection

[...]

42585 DBClient 5492 9476  11:04:33.398 Sending SQL command

[...]

42589 DBServer 6480 10288 11:04:33.399 Executing SQL command

[...]

42592 DBClient 5492 9476  11:04:33.400 Closing connection

[...]
Please note that these macrofunctions need not be from the same ATID in the traditional sense like in the example above unless we form adjoint threads from certain fragments like “DB”.
- Dmitry Vostokov @ DumpAnalysis.org + TraceAnalysis.org -
Posted in Debugging, Software Narratology, Software Trace Analysis, Software Trace Linguistics, Trace Analysis Patterns | No Comments »
Wednesday, September 21st, 2011
Memoretics as a science of memory snapshots borrows many ideas from the following disciplines (the list is not exhaustive):
- Troubleshooting and Debugging
- Intelligence Analysis
- Critical Thinking
- Forensics
- Linguistics
- Archaeology
- Psychoanalysis
- History
- Mathematics: Sets and Categories
- Literary Criticism and Narratology
It also contributes many ideas back. The following diagram depicts such an interaction:

- Dmitry Vostokov @ DumpAnalysis.org + TraceAnalysis.org -
Posted in Archaeology of Computer Memory, Categorical Debugging, Computer Forensics, Computer Science, Countefactual Debugging, Crash Dump Analysis, Crash Dump De-analysis, Crash Dump Patterns, Debugging, Debugging Methodology, Dublin School of Security, Education and Research, Escalation Engineering, General Memory Analysis, Generative Debugging, Hermeneutics of Memory Dumps and Traces, History, Intelligence Analysis Patterns, M->analysis, Malware Analysis, Malware Patterns, Mathematics of Debugging, Memiotics (Memory Semiotics), Memoretics, Memory Analysis Forensics and Intelligence, Memory Dump Analysis and History, Memory Systems Language, Memory Visualization, Metadefect Template Library, Metamalware, New Debugging School, Paleo-debugging, Pattern Models, Pattern Prediction, Psychoanalysis of Software Maintenance and Support, Psychology, Reverse Engineering, Root Cause Analysis, Science of Memory Dump Analysis, Science of Software Tracing, Security, Software Architecture, Software Behavior DNA, Software Behavior Patterns, Software Behavioral Genome, Software Chorography, Software Chorology, Software Defect Construction, Software Engineering, Software Narratology, Software Technical Support, Software Trace Analysis, Software Trace Analysis and History, Software Trace Deconstruction, Software Trace Linguistics, Software Trace Reading, Software Trace Visualization, Software Tracing Implementation Patterns, Software Troubleshooting Patterns, Software Victimology, Software and History, Structural Memory Analysis and Social Sciences, Structural Memory Patterns, Structural Trace Patterns, Systems Thinking, Testing, Tools, Trace Analysis Patterns, Troubleshooting Methodology, UI Problem Analysis Patterns, Unified Debugging Patterns, Victimware, Virtualization, Visual Dump Analysis, Workaround Patterns | No Comments »
Friday, December 17th, 2010
As the new decade is approaching (2011-2020) we would like to make a few previews and predictions:
- Increased complexity of software will bring more methods from biological, social sciences and humanities in addition to existing methods of automated debugging and computer science techniques
- Focus on first fault software problem solving (when aspect)
- Focus on pattern-driven software problem solving (how aspect)
- Fusion of debugging and malware analysis into a unified structural and behavioral pattern framework
- Visual debugging, memory and software trace visualization techniques
- Software maintenance certification
- Focus on domain-driven troubleshooting and debugging tools as a service (debugware TaaS)
- Focus on security issues related to memory dumps and software traces
- New scripting languages and programming language extensions for debugging
- The maturation of the science of memory snapshots and software traces (memoretics)
Imagining is not not limited to the above and more to come and explain in the forthcoming parts.
- Dmitry Vostokov @ DumpAnalysis.org + TraceAnalysis.org -
Posted in Announcements, Anthropology, Archaeology of Computer Memory, Biology, Certification, Computer Science, Countefactual Debugging, Crash Analysis Report Environment (CARE), Crash Dump Analysis, Crash Dump Patterns, DebugWare Patterns, Debugging, Debugging Industry, Debugging Methodology, Debugging Trends, Dublin School of Security, EasyDbg, Economics, Escalation Engineering, Evolution, First Fault Problem Solving, Futuristic Memory Dump Analysis, General Memory Analysis, General Science, Geography, Hardware, Hermeneutics of Memory Dumps and Traces, History, Humanities, Language, Laws of Troubleshooting and Debugging, Logic, Malware Analysis, Malware Patterns, Mathematics of Debugging, Memiotics (Memory Semiotics), Memoretics, Memory Analysis Forensics and Intelligence, Memory Analysis Report System, Memory Dump Analysis and History, Memory Systems Language, Memory Visualization, Paleo-debugging, Pattern Models, Pattern Prediction, Physics, Psychology, Publishing, Science of Memory Dump Analysis, Science of Software Tracing, Security, Social Media, Social Sciences, Software Architecture, Software Behavior Patterns, Software Chorography, Software Chorology, Software Defect Construction, Software Engineering, Software Generalist, Software Maintenance Institute, Software Narrative Fiction, Software Narratology, Software Technical Support, Software Trace Analysis, Software Trace Analysis and History, Software Trace Deconstruction, Software Trace Linguistics, Software Trace Visualization, Software Troubleshooting Patterns, Software Victimology, Statistics, Structural Memory Analysis and Social Sciences, Structural Memory Patterns, Structural Trace Patterns, Systems Thinking, Testing, Tools, Trace Analysis Patterns, Troubleshooting Methodology, Unified Debugging Patterns, Uses of UML, Victimware, Virtualization, Visual Dump Analysis, Windows System Administration, Workaround Patterns | No Comments »
Tuesday, December 7th, 2010
If we look at any non-trivial trace we would see different Implementation Discourses. Components are written in different languages and adhere to different runtime environments, binary models and interface frameworks. All these implementation variations influence the structure, syntax and semantics of trace messages. For example, .NET debugging traces differ from file system driver or COM debugging messages. Therefore we establish the new field of Software Trace Linguistics as a science of software trace languages. Some parallels can be drawn here towards software linguistics (the science of software languages) although we came to that conclusion independently while thinking about applying “ethnography of speaking” to software trace narration. More on this in the following posts.
- Dmitry Vostokov @ DumpAnalysis.org + TraceAnalysis.org -
Posted in CDF Analysis Tips and Tricks, Debugging, Software Narratology, Software Trace Analysis, Software Trace Linguistics, Software Trace Reading, Trace Analysis Patterns | No Comments »