Archive for the ‘Visual Dump Analysis’ Category
Saturday, March 30th, 2024
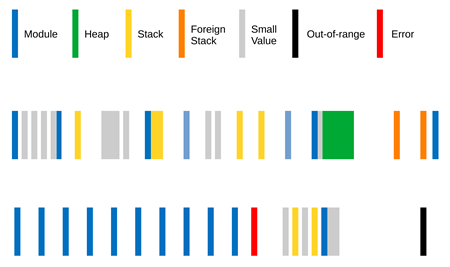
Values in memory regions, when interpreted as addresses, such as stack can be classified according to their categories such as zero, module (code and data), heap, stack, Foreign Stack, Small Value, error, and out-of-range (for example, kernel space address in user space). Such classification can be encoded and optionally visualized as Region Spectrum:
- Dmitry Vostokov @ DumpAnalysis.org + TraceAnalysis.org -
Posted in Core Dump Analysis, Crash Dump Analysis, Crash Dump Patterns, Machine Learning, Memory Visualization, Visual Dump Analysis | Comments Off
Thursday, September 15th, 2016
In case of parallel memory leak for process heap and .NET heap (or generally with several dynamic memory allocators) we are interested in relative growth to see whether they are interdependent, i.e. managed heap objects have pointers to process heap entries. When we have a set of consecutive memory dumps we can construct a table of heap sizes and plot the graph where the axes represents memory snapshot numbers and total heap size in bytes:
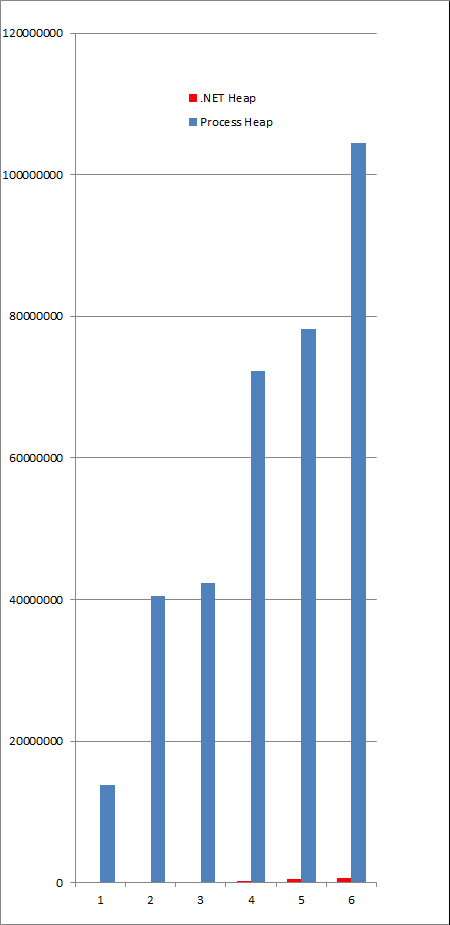
Unfortunately, the relative growth sizes can be disproportionate as the picture above shows. To overcome this, we can normalize size by the lowest corresponding heap size, i.e. Sn/S1:
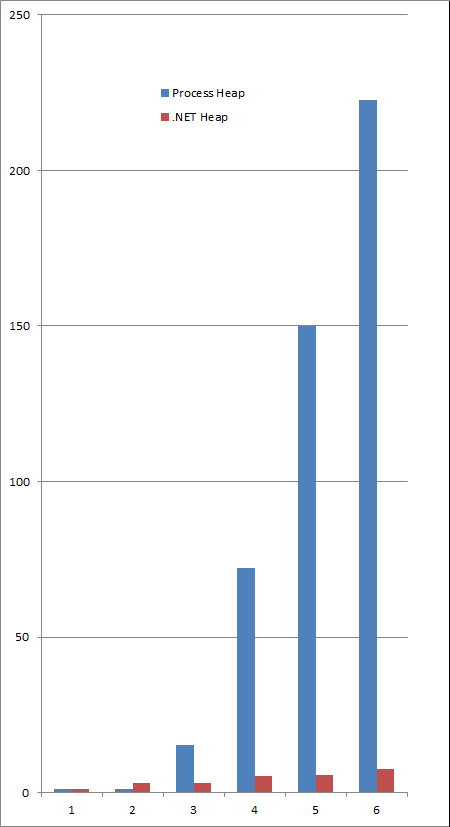
Still this doesn’t show the absence of correlation if there is no such. We can plot the relative growth, i.e. Sn/Sn-1, n > 1:
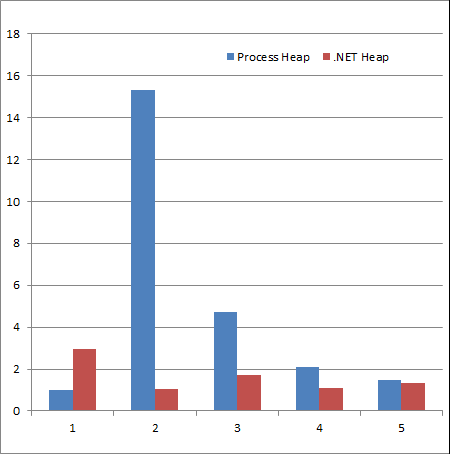
The graph shows that there is no obvious correlation between Relative Heap Leaks. Similar graphs can be constructed for relative object distributions.
- Dmitry Vostokov @ DumpAnalysis.org + TraceAnalysis.org -
Posted in Crash Dump Analysis, Crash Dump Patterns, Visual Dump Analysis | No Comments »
Friday, April 18th, 2014
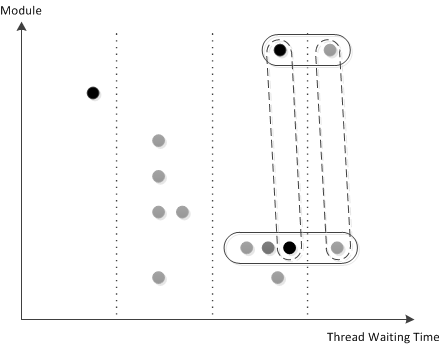
One of useful patterns for the analysis of system hangs is Thread Waiting Time. If there are many such threads of interest they can be partitioned by waiting time and modules of interest from their stack traces. Modules of interest may include Directing, Coupled, Blocking, Top, and/or Problem modules depending on the problem description. We call the resulting composite pattern Thread Cluster. Extra-dimensional information can also be added such as the number of threads having the same or similar waiting time and other attributes by using different colours. For example, on this diagram, illustrating a real system hang, we see clustering of threads running through one 3rd-party module of interest and having the longest waiting time. Also we are able to identify possibly coupled (semantically related) threads running through another module of interest:
- Dmitry Vostokov @ DumpAnalysis.org + TraceAnalysis.org -
Posted in Complete Memory Dump Analysis, Crash Dump Analysis, Crash Dump Patterns, Visual Dump Analysis | 1 Comment »
Wednesday, September 21st, 2011
Memoretics as a science of memory snapshots borrows many ideas from the following disciplines (the list is not exhaustive):
- Troubleshooting and Debugging
- Intelligence Analysis
- Critical Thinking
- Forensics
- Linguistics
- Archaeology
- Psychoanalysis
- History
- Mathematics: Sets and Categories
- Literary Criticism and Narratology
It also contributes many ideas back. The following diagram depicts such an interaction:

- Dmitry Vostokov @ DumpAnalysis.org + TraceAnalysis.org -
Posted in Archaeology of Computer Memory, Categorical Debugging, Computer Forensics, Computer Science, Countefactual Debugging, Crash Dump Analysis, Crash Dump De-analysis, Crash Dump Patterns, Debugging, Debugging Methodology, Dublin School of Security, Education and Research, Escalation Engineering, General Memory Analysis, Generative Debugging, Hermeneutics of Memory Dumps and Traces, History, Intelligence Analysis Patterns, M->analysis, Malware Analysis, Malware Patterns, Mathematics of Debugging, Memiotics (Memory Semiotics), Memoretics, Memory Analysis Forensics and Intelligence, Memory Dump Analysis and History, Memory Systems Language, Memory Visualization, Metadefect Template Library, Metamalware, New Debugging School, Paleo-debugging, Pattern Models, Pattern Prediction, Psychoanalysis of Software Maintenance and Support, Psychology, Reverse Engineering, Root Cause Analysis, Science of Memory Dump Analysis, Science of Software Tracing, Security, Software Architecture, Software Behavior DNA, Software Behavior Patterns, Software Behavioral Genome, Software Chorography, Software Chorology, Software Defect Construction, Software Engineering, Software Narratology, Software Technical Support, Software Trace Analysis, Software Trace Analysis and History, Software Trace Deconstruction, Software Trace Linguistics, Software Trace Reading, Software Trace Visualization, Software Tracing Implementation Patterns, Software Troubleshooting Patterns, Software Victimology, Software and History, Structural Memory Analysis and Social Sciences, Structural Memory Patterns, Structural Trace Patterns, Systems Thinking, Testing, Tools, Trace Analysis Patterns, Troubleshooting Methodology, UI Problem Analysis Patterns, Unified Debugging Patterns, Victimware, Virtualization, Visual Dump Analysis, Workaround Patterns | No Comments »
Saturday, January 1st, 2011
With the new year starts the new initiative to integrate traditional multidisciplinary debugging approaches and methodologies with multiplatform pattern-driven software problem solving, unified debugging patterns, best practices in memory dump analysis and software tracing, computer security, economics, and the new emerging trends I’m going to write about during this year.
- Dmitry Vostokov @ DumpAnalysis.org + TraceAnalysis.org -
Posted in Announcements, Best Practices, Computer Forensics, Computer Science, Countefactual Debugging, Crash Analysis Report Environment (CARE), Crash Dump Analysis, Crash Dump Patterns, DebugWare Patterns, Debugging, Debugging Industry, Debugging Methodology, Debugging Trends, Dublin School of Security, Economics, Education and Research, Escalation Engineering, First Fault Problem Solving, Malware Analysis, Malware Patterns, Mathematics of Debugging, Memiotics (Memory Semiotics), Memoretics, Memory Analysis Forensics and Intelligence, Memory Analysis Report System, Memory Dump Analysis Services, Memory Systems Language, Memory Visualization, New Debugging School, Science of Memory Dump Analysis, Science of Software Tracing, Security, Software Behavior Patterns, Software Defect Construction, Software Engineering, Software Generalist, Software Maintenance Institute, Software Narratology, Software Trace Analysis, Software Trace Visualization, Software Tracing Implementation Patterns, Software Troubleshooting Patterns, Structural Memory Patterns, Structural Trace Patterns, Systems Thinking, Testing, Tool Objects, Tools, Trace Analysis Patterns, Training and Seminars, Troubleshooting Methodology, Unified Debugging Patterns, Victimware, Visual Dump Analysis, Webinars, Workaround Patterns | No Comments »