Archive for November, 2010
Tuesday, November 30th, 2010
MAaaS includes 2 complementary DA+TA services:
1. Dump Analysis as a Service (DAaaS)
2. Trace Analysis as a Service (TAaaS)
Memory Dump Analysis Services is the first organization to provide such a service at an audit and certification levels.
- Dmitry Vostokov @ DumpAnalysis.org + TraceAnalysis.org -
Posted in Certification, Complete Memory Dump Analysis, Crash Analysis Report Environment (CARE), Crash Dump Analysis, Crash Dump Patterns, Debugging, Dublin School of Security, Escalation Engineering, Malware Analysis, Malware Patterns, Memiotics (Memory Semiotics), Memoretics, Memory Analysis Forensics and Intelligence, Memory Analysis Report System, Memory Dump Analysis Services, Minidump Analysis, Security, Software Behavior Patterns, Software Technical Support, Software Trace Analysis, Software Trace Reading, Structural Memory Patterns, Structural Trace Patterns, Tools, Trace Analysis Patterns, Windows System Administration | No Comments »
Monday, November 29th, 2010
Invalid Parameter is a general pattern of passing unexpected values to functions. Here we look at invalid heap block parameter specialization. It is different from heap corruption or double free pattern because no corruption happens in heap structures before detection and the parameter value has never been correct before its use. For example, we have this stack trace:
0:003> kL 100

ChildEBP RetAddr

01b2e6f0 77f27d0c ntdll!ZwWaitForSingleObject+0x15

01b2e774 77f27e3a ntdll!RtlReportExceptionEx+0x14b

01b2e7cc 77f4dc2e ntdll!RtlReportException+0x86

01b2e7e0 77f4dcab ntdll!RtlpTerminateFailureFilter+0x14

01b2e7ec 77ef05c4 ntdll!RtlReportCriticalFailure+0x67

01b2e800 77ef0469 ntdll!_EH4_CallFilterFunc+0x12

01b2e828 77ed8799 ntdll!_except_handler4+0x8e

01b2e84c 77ed876b ntdll!ExecuteHandler2+0x26

01b2e8fc 77e9010f ntdll!ExecuteHandler+0x24

01b2e8fc 77f4dc9b ntdll!KiUserExceptionDispatcher+0xf

01b2ecc4 77f4eba1 ntdll!RtlReportCriticalFailure+0x57

01b2ecd4 77f4ec81 ntdll!RtlpReportHeapFailure+0x21

01b2ed08 77efdda0 ntdll!RtlpLogHeapFailure+0xa1

01b2ed38 76bc14d1 ntdll!RtlFreeHeap+0×64

01b2ed4c 75694c39 kernel32!HeapFree+0×14

01b2ed98 726f167d msvcr80!free+0xcd

01b2eda4 7270613d DllA!FreeData+0xd

[…]

01b2fe38 77eb9d42 kernel32!BaseThreadInitThunk+0xe

01b2fe78 77eb9d15 ntdll!__RtlUserThreadStart+0×70

01b2fe90 00000000 ntdll!_RtlUserThreadStart+0×1b
We see that the failure was detected and logged immediately without any instrumentation information:
0:003> !gflag

Current NtGlobalFlag contents: 0x00000000
If we enable full page heap we get this default analysis output and the following stack trace:
0:003> !gflag

Current NtGlobalFlag contents: 0x02000000

    hpa - Place heap allocations at ends of pages
0:003> !analyze -v
[...]
APPLICATION_VERIFIER_HEAPS_CORRUPTED_HEAP_BLOCK_EXCEPTION_RAISED_FOR_PROBING (c)

Exception raised while verifying the heap block.

This situation happens if we really cannot determine any particular type of corruption for the block. For instance you will get this if during a heap free operation you pass an address that points to a non-accessible memory area.

This can also happen for double free situations if we do not find the block among full page heap blocks and we probe it as a light page heap block.

Arguments:

Arg1: 05eb1000, Heap handle used in the call.

Arg2: 00720071, Heap block involved in the operation.

Arg3: 00000000, Size of the heap block.

Arg4: c0000005, Reserved.
[...]
0:003> kL 100

ChildEBP RetAddr

0818dca4 75fa0962 ntdll!ZwWaitForMultipleObjects+0x15

0818dd40 76bc162d KERNELBASE!WaitForMultipleObjectsEx+0x100

0818dd88 76bc1921 kernel32!WaitForMultipleObjectsExImplementation+0xe0

0818dda4 76be9b0d kernel32!WaitForMultipleObjects+0x18

0818de10 76be9baa kernel32!WerpReportFaultInternal+0x186

0818de24 76be98d8 kernel32!WerpReportFault+0x70

0818de34 76be9855 kernel32!BasepReportFault+0x20

0818dec0 77ef06e7 kernel32!UnhandledExceptionFilter+0x1af

0818dec8 77ef05c4 ntdll!__RtlUserThreadStart+0x62

0818dedc 77ef0469 ntdll!_EH4_CallFilterFunc+0x12

0818df04 77ed8799 ntdll!_except_handler4+0x8e

0818df28 77ed876b ntdll!ExecuteHandler2+0x26

0818dfd8 77e9010f ntdll!ExecuteHandler+0x24

0818dfd8 71a6ba58 ntdll!KiUserExceptionDispatcher+0xf

0818e344 71a69ee0 verifier!VerifierStopMessage+0x1f8

0818e3a8 71a66f11 verifier!AVrfpDphReportCorruptedBlock+0x2b0

0818e3bc 71a819ec verifier!AVrfpDphFindBusyMemoryNoCheck+0x141

0818e3d0 71a8174e verifier!_EH4_CallFilterFunc+0x12

0818e3f8 77ed8799 verifier!_except_handler4+0x8e

0818e41c 77ed876b ntdll!ExecuteHandler2+0x26

0818e4cc 77e9010f ntdll!ExecuteHandler+0x24

0818e4cc 71a66e88 ntdll!KiUserExceptionDispatcher+0xf

0818e868 71a66f95 verifier!AVrfpDphFindBusyMemoryNoCheck+0xb8

0818e88c 71a67240 verifier!AVrfpDphFindBusyMemory+0x15

0818e8a8 71a69080 verifier!AVrfpDphFindBusyMemoryAndRemoveFromBusyList+0x20

0818e8c4 77f50aac verifier!AVrfDebugPageHeapFree+0x90

0818e90c 77f0a8ff ntdll!RtlDebugFreeHeap+0x2f

0818ea00 77eb2a32 ntdll!RtlpFreeHeap+0x5d

0818ea20 76bc14d1 ntdll!RtlFreeHeap+0x142

0818ea34 75694c39 kernel32!HeapFree+0x14

0818ea80 726f167d msvcr80!free+0xcd

0818ea8c 7270613d DllA!FreeData+0xd

[...]

0818fb20 77eb9d42 kernel32!BaseThreadInitThunk+0xe

0818fb60 77eb9d15 ntdll!__RtlUserThreadStart+0x70

0818fb78 00000000 ntdll!_RtlUserThreadStart+0x1b
In both examples above we see that 00720071 was passed to free function (we also verify from the code using ub command that there was no parameter optimization):
0:003> kv

ChildEBP RetAddr  Args to Child

[...]

01b2ed98 726f167d 00720071 01b2edb0 7270613d msvcr80!free+0xcd (FPO: [SEH])

[…]
We recognize that value as Unicode (as an example of a wild pointer but parameters need not be pointers in general case). We can also consider Invalid Handle pattern as another specialization of Invalid Parameter pattern.
- Dmitry Vostokov @ DumpAnalysis.org + TraceAnalysis.org -
Posted in Crash Dump Analysis, Crash Dump Patterns, Debugging | No Comments »
Monday, November 29th, 2010
Crash dump makes noise.
Suzanne Vega, Blood Makes Noise
- Dmitry Vostokov @ DumpAnalysis.org + TraceAnalysis.org -
Posted in Bugtations, Crash Dump Analysis, Fun with Crash Dumps | No Comments »
Sunday, November 28th, 2010
God Bless the Debugger and his relations and keep us in our proper winstations!
18th century English verse
- Dmitry Vostokov @ DumpAnalysis.org + TraceAnalysis.org -
Posted in Bugtations, Debugging, Fun with Debugging | No Comments »
Sunday, November 28th, 2010
Do we need to debug, really? (Selling the Debug Ethic1)
Whilst debugging leads to wealth
and will keep you in good health,
so its best to be contented with your bugs.
Debug, boys, debug and be contented,
As long as you’ve enough to buy a computer.
The man, you may rely, will be wealthy by and by,
If he’ll only put his finger to the debugger.
Harry Clifton (1824-1872)
1Bugtated the title of the book I’m reading now and a song from it: Selling the Work Ethic: From Puritan Pulpit to Corporate PR

- Dmitry Vostokov @ DumpAnalysis.org + TraceAnalysis.org -
Posted in Books, Bugtations, Debugging, Debugging Industry, Fun with Debugging, Social Sciences | No Comments »
Friday, November 26th, 2010
A variation of the answer to the perennial question:
The Past is a Memory Dump.
Dmitry Vostokov, Founder of Memory Dump Worldview, the philosophy of Memoidealism, and the religion of Memorianity (Memory Religion)
- Dmitry Vostokov @ DumpAnalysis.org + TraceAnalysis.org -
Posted in Bugtations, Memoidealism, Philosophy | No Comments »
Friday, November 26th, 2010
Have you ever noticed some pessimism on the faces of the prominent debuggers?
You will debug like a dog for no good reason.
Ernest Hemingway, Notes on the Next Debugging
- Dmitry Vostokov @ DumpAnalysis.org + TraceAnalysis.org -
Posted in Bugtations, Debugging, Fun with Debugging | No Comments »
Thursday, November 25th, 2010
Posted in Announcements, Complete Memory Dump Analysis, Crash Analysis Report Environment (CARE), Crash Dump Analysis, Crash Dump De-analysis, Crash Dump Patterns, Debugging, Debugging Industry, Escalation Engineering, Kernel Development, Memory Analysis Forensics and Intelligence, Memory Dump Analysis Services, Minidump Analysis, Software Behavior Patterns, Software Engineering, Software Technical Support, Software Trace Analysis, Software Troubleshooting Patterns, Tools, Trace Analysis Patterns, Vista, Windows 7, Windows Server 2008, Windows System Administration, Workaround Patterns, x64 Windows | No Comments »
Thursday, November 25th, 2010
Our next pattern is called System Description Snapshot. The tool or component compiles the list of system properties and collections, like hardware resources, selected file names from file systems, registry and other configuration information. Two or several snapshots can be compared either visually or automatically to highlight state differences that help in troubleshooting, debugging and problem resolution.
- Dmitry Vostokov @ DumpAnalysis.org + TraceAnalysis.org -
Posted in DebugWare Patterns, Debugging, Escalation Engineering, Software Architecture, Software Engineering, Software Technical Support, Tools | No Comments »
Wednesday, November 24th, 2010
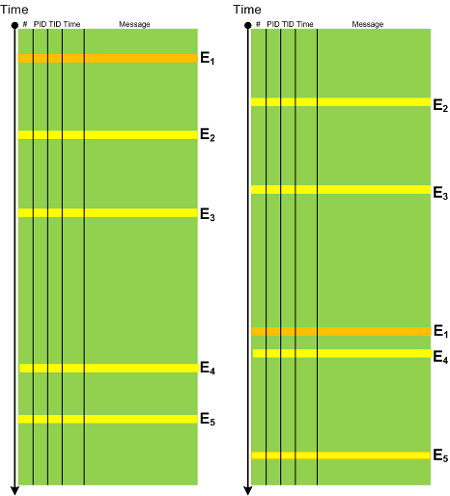
In any system there is an expected Event Sequence Order as a precondition to its normal behaviour. Any out-of-order events should raise the suspicion bar as they might result or lead to synchronization problems. It need not be a sequence of trace messages from different threads but also between processes, for example, image load events in CDF / ETW traces can indicate a misconfiguration in service startup order. The following diagram depicts a possible pattern scenario:
- Dmitry Vostokov @ DumpAnalysis.org + TraceAnalysis.org -
Posted in CDF Analysis Tips and Tricks, Debugging, Software Trace Analysis, Trace Analysis Patterns | No Comments »
Wednesday, November 24th, 2010
I was flying a kite with my son last month when a short Irish rain suddenly happened. After that we were happy to observe a double rainbow from Salthill (Monkstown):

- Dmitry Vostokov @ DumpAnalysis.org + TraceAnalysis.org -
Posted in Debugging and Nature, History | No Comments »
Wednesday, November 24th, 2010
Visited Dublin Zoo with my family during last Halloween weekend where my daughter pointed me to this funny message box:

- Dmitry Vostokov @ DumpAnalysis.org + TraceAnalysis.org -
Posted in Debugging and Nature, History | No Comments »
Wednesday, November 24th, 2010
When looking for the shortest book titles found this little book with a buzzing bug on its cover: Cdb!

CDB also stands for Console DeBugger from Microsoft Debugging Tools for Windows. It can be used in place of WinDbg for user space targets if you don’t like graphical interface or when GUI interferes with debugging.
I’m ordering it now to teach my son symbols! Although I should write my own book for OpenTask Baby Turing series.
- Dmitry Vostokov @ DumpAnalysis.org + TraceAnalysis.org -
Posted in Baby Turing Series, Books, Debugging for Children, Fun with Debugging | No Comments »
Tuesday, November 23rd, 2010
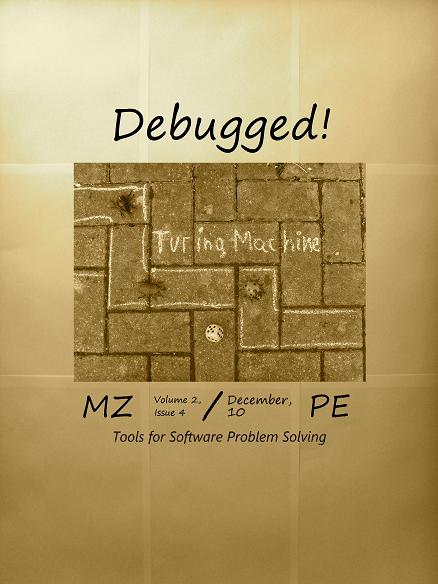
This is the main topic of the forthcoming December Debugged! MZ/PE magazine issue:
Debugged! MZ/PE: Tools for Software Problem Solving, December, 2010 (Paperback, ISBN: 978-1908043023)
The draft front cover symbolizes an element of randomness and chance exceptions in software problem solving.
- Dmitry Vostokov @ DumpAnalysis.org + TraceAnalysis.org -
Posted in Announcements, Books, Debugged! MZ/PE, Debugging, Publishing, Software Technical Support, Software Trace Analysis, Tools | No Comments »
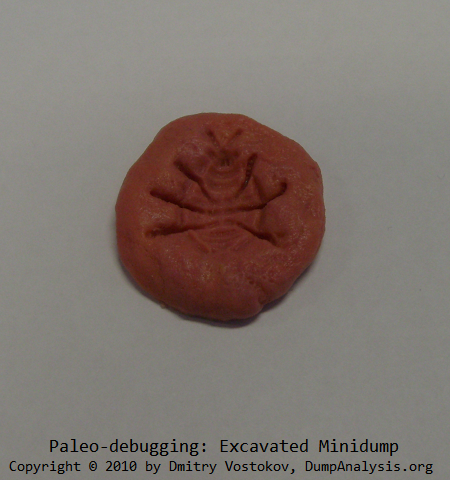
Monday, November 22nd, 2010
Posted in Aesthetics of Memory Dumps, Announcements, Art, Baby Turing Series, Books, Bugtations, Cartoons, Crash Dump Analysis, Debugging, Fun with Crash Dumps, Fun with Debugging, Memory Space Art, Memory Visualization, Software Engineering | No Comments »
Saturday, November 20th, 2010
During repeated execution either on one computer or in parallel on many computers with a uniform software / hardware the given process VM size tends to cluster around some value range, for example, 40 - 60 Mb. If we get a collection of user process memory dumps taken from several production servers, say 20 files, we can either employ scripts to process all of them or compare their file size and look for a bigger ones for a starter, for example, 85 or 110 Mb. For certain processes, for example, a print spooler, after a problem the process size tends to increase compared to normal execution. For other processes, certain error processing modules might be loaded increasing VM size or in case of incoming requests for a hang process certain memory regions like heap could increase as well contributing to dump file size increase. We call this pattern Fat Process Dump. If we have fat and thin clients we should also have thin and fat process dumps as well. A case study is following.
- Dmitry Vostokov @ DumpAnalysis.org + TraceAnalysis.org -
Posted in Crash Dump Analysis, Crash Dump Patterns, Debugging | No Comments »