Archive for September, 2011
Monday, September 26th, 2011
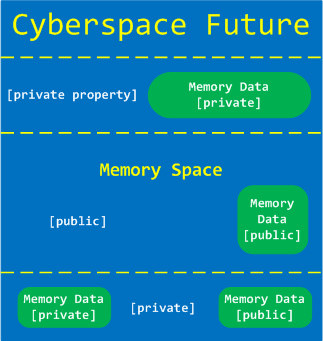
Memoretics views Cyber Space as Memory Space + Memory Data. Here Memory Space consists of many different memory spaces. Although data is private property memory space where it is located is not:
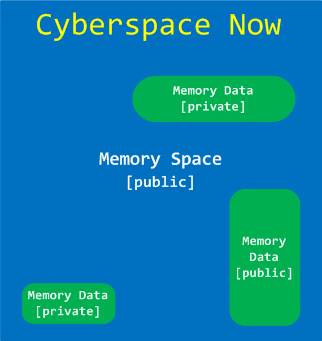
We propose private property on memory spaces and their partitions as a solution to various Cyber problems such as Cyber Crime and Cyber War:
- Dmitry Vostokov @ DumpAnalysis.org + TraceAnalysis.org -
Posted in Announcements, Cyber Intelligence, Cyber Problems, Cyber Security, Cyber Space, Cyber Warfare, Memory Analysis Forensics and Intelligence, Security | No Comments »
Monday, September 26th, 2011
The idea of this bugtation came to me when I was browsing Wrotten English: A Celebration of Literary Misprints, Mistakes and Mishaps book in a local Costa:

In a chapter on funny book titles I could find:
Dumps (The story of a plain app and its struggles in computation).
Dumps by Meade (Chambers, 1905)
- Dmitry Vostokov @ DumpAnalysis.org + TraceAnalysis.org -
Posted in Bugtations, Crash Dump Analysis, Fun with Crash Dumps | No Comments »
Wednesday, September 21st, 2011
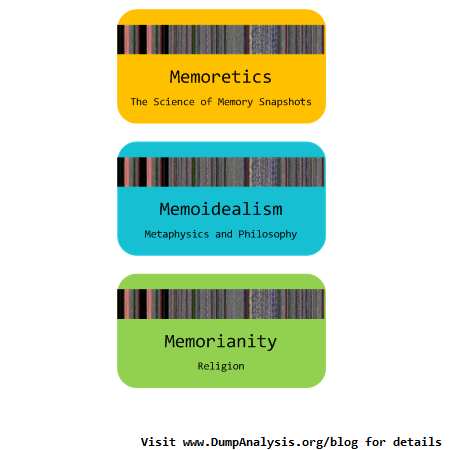
The Memory Worldview consists of 3 parts:
1. The Science of Memoretics
2. The Philosophy of Memoidealism (including Memory as the first principle)
3. The Memory Religion (Memorianity)
- Dmitry Vostokov @ DumpAnalysis.org + TraceAnalysis.org -
Posted in Computer Science, Memoidealism, Memoretics, Memory Religion (Memorianity), Metaphysics of Memory Worldview, Philosophy, Religion, Science of Memory Dump Analysis, Science of Software Tracing | No Comments »
Wednesday, September 21st, 2011
Memoretics promotes pattern-driven memory dump and software trace analysis which has many uses but not limited to:
- Software and site reliability
- Software Debugging
- QA and Software Testing
- Computer Security
- Software Troubleshooting
- Malware Research and Analysis
- Tools as a Service (TaaS)
- Supportability
- Software Diagnostics

- Dmitry Vostokov @ DumpAnalysis.org + TraceAnalysis.org -
Posted in Cloud Memory Dump Analysis, Computer Forensics, Crash Dump Analysis, Crash Dump Patterns, DebugWare Patterns, Debugging, Debugging Trends, Escalation Engineering, Malware Analysis, Malware Patterns, Memiotics (Memory Semiotics), Memoretics, Memory Analysis Forensics and Intelligence, Metadefect Template Library, Metamalware, Pattern Models, Pattern Prediction, Reverse Engineering, Root Cause Analysis, Science of Memory Dump Analysis, Science of Software Tracing, Security, Software Behavior DNA, Software Behavior Patterns, Software Behavioral Genome, Software Defect Construction, Software Engineering, Software Generalist, Software Narratology, Software Support Patterns, Software Technical Support, Software Trace Analysis, Software Troubleshooting Patterns, Structural Memory Patterns, Structural Trace Patterns, Systems Thinking, Testing, Tools, Trace Analysis Patterns, Troubleshooting Methodology, UI Problem Analysis Patterns, Unified Debugging Patterns, Victimware, Windows System Administration, Workaround Patterns | No Comments »
Wednesday, September 21st, 2011
Memoretics as a science of memory snapshots borrows many ideas from the following disciplines (the list is not exhaustive):
- Troubleshooting and Debugging
- Intelligence Analysis
- Critical Thinking
- Forensics
- Linguistics
- Archaeology
- Psychoanalysis
- History
- Mathematics: Sets and Categories
- Literary Criticism and Narratology
It also contributes many ideas back. The following diagram depicts such an interaction:

- Dmitry Vostokov @ DumpAnalysis.org + TraceAnalysis.org -
Posted in Archaeology of Computer Memory, Categorical Debugging, Computer Forensics, Computer Science, Countefactual Debugging, Crash Dump Analysis, Crash Dump De-analysis, Crash Dump Patterns, Debugging, Debugging Methodology, Dublin School of Security, Education and Research, Escalation Engineering, General Memory Analysis, Generative Debugging, Hermeneutics of Memory Dumps and Traces, History, Intelligence Analysis Patterns, M->analysis, Malware Analysis, Malware Patterns, Mathematics of Debugging, Memiotics (Memory Semiotics), Memoretics, Memory Analysis Forensics and Intelligence, Memory Dump Analysis and History, Memory Systems Language, Memory Visualization, Metadefect Template Library, Metamalware, New Debugging School, Paleo-debugging, Pattern Models, Pattern Prediction, Psychoanalysis of Software Maintenance and Support, Psychology, Reverse Engineering, Root Cause Analysis, Science of Memory Dump Analysis, Science of Software Tracing, Security, Software Architecture, Software Behavior DNA, Software Behavior Patterns, Software Behavioral Genome, Software Chorography, Software Chorology, Software Defect Construction, Software Engineering, Software Narratology, Software Technical Support, Software Trace Analysis, Software Trace Analysis and History, Software Trace Deconstruction, Software Trace Linguistics, Software Trace Reading, Software Trace Visualization, Software Tracing Implementation Patterns, Software Troubleshooting Patterns, Software Victimology, Software and History, Structural Memory Analysis and Social Sciences, Structural Memory Patterns, Structural Trace Patterns, Systems Thinking, Testing, Tools, Trace Analysis Patterns, Troubleshooting Methodology, UI Problem Analysis Patterns, Unified Debugging Patterns, Victimware, Virtualization, Visual Dump Analysis, Workaround Patterns | No Comments »
Monday, September 19th, 2011
R.E.M. album Out of Time is a great joy to listen for Win32 API debugging veterans familiar with Visual Basic
 .
.

I put my own track title names here:
1. I Can’t Find It!
2. Losing My Data
3. LOWORD
4. Near A Wild Pointer (*pa, *pa, *ppa, …)
5. End Of Session
6. Happy Customers
7. Be LONG
8. Half A Word Away! (A Miracle)
9. Printer Driver (Can’t Spell Its Name)
10. Customer Feedback (One, Two, Three, …)
11. Found Me In Dumps
- Dmitry Vostokov @ DumpAnalysis.org + TraceAnalysis.org -
Posted in Debugging, Fun with Crash Dumps, Fun with Debugging, Music for Debugging | No Comments »
Saturday, September 17th, 2011
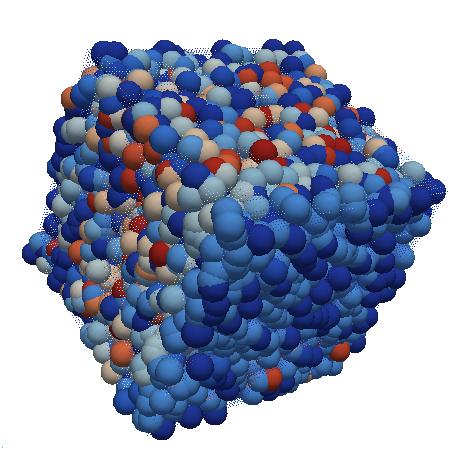
Whereas DNA of a ruptured computation is a coarse grained, software behavioral genome in general is fine grained consisting of multiple behavioral patterns such as seen in memory dumps and software traces. I will elaborate more on it later especially in relation to software behavior profiles. Here’s a nice “memory DNA” metaphorical picture from 3D memory visualization post:
- Dmitry Vostokov @ DumpAnalysis.org + TraceAnalysis.org -
Posted in Announcements, Crash Dump Patterns, Memory Visualization, Software Behavior DNA, Software Behavior Patterns, Software Behavioral Genome, Trace Analysis Patterns | No Comments »
Wednesday, September 14th, 2011
Original Message pattern deals with software trace messages where certain activity is repeated several times but the only the first message occurrence or specific message vocabulary has significance for analysis activity. Typical example from CDF/ETW tracing is module load events:
#     Module  PID   TID   Time         Message

[...]

35835 ModuleA 11000 11640 17:27:28.720 LoadImageEvent: \Device\HarddiskVolume2\Windows\System32\userinit.exe PId 5208

[…]

37684 ModuleA 12332 9576  17:27:29.063 LoadImageEvent: \Windows\System32\userinit.exe PId 573C

[…]

37687 ModuleA 12332 9576  17:27:29.064 LoadImageEvent: \Windows\System32\userinit.exe PId 573C

[…]
What we are looking here is for message invariant like “.exe” but interested in the occurrence of specific path structures like \Device\HarddiskVolume because in our troubleshooting context they signify process launch sequence during terminal session initialization.
- Dmitry Vostokov @ DumpAnalysis.org + TraceAnalysis.org -
Posted in CDF Analysis Tips and Tricks, Debugging, Software Trace Analysis, Software Trace Reading, Trace Analysis Patterns | No Comments »
Monday, September 12th, 2011
If you like the completeness, grand complete memory dumps, multi-volume oeuvres (the more volumes the better) and natural memory visualization you would then like to open this box and listen to this complete performance achievement to get energy and inspiration for long debugging sessions:
Liszt: The Complete Piano Music

- Dmitry Vostokov @ DumpAnalysis.org + TraceAnalysis.org -
Posted in Complete Memory Dump Analysis, Crash Dump Analysis, Debugging, Memory Visualization, Music for Debugging | No Comments »
Monday, September 12th, 2011
In 3×3 format:
Q. What philosophical school do I belong to?
A. I consider myself the last Presocratic philosopher.
Q. What is my difference from the first Presocratics?
A. The philosophy of Memoidealism that I founded postulates that Memory is the essence of things, the first principle, like fire.
Q. Can I name 3 great philosophers?
A. 3 V’s: Giambattista Vico, Circle Vienna, Dmitry Vostokov (*). The circle is not one philosopher though but a cloud memory aggregate. If you insist on a person I would then replace it with Voltaire.
(*) The idea came to me after reading that Ayn Rand could only recommend 3 A’s - Aristotle, Aquinas, and Ayn Rand.
- Dmitry Vostokov @ DumpAnalysis.org + TraceAnalysis.org -
Posted in Interviews, Memoidealism, Metaphysics of Memory Worldview, Philosophy | No Comments »
Monday, September 12th, 2011
Just noticed this book and pre-ordered it:
Practical Malware Analysis: The Hands-On Guide to Dissecting Malicious Software

I like the cover picture - I recently bought a Dell Alienware laptop just to do malware and victimware analysis 
- Dmitry Vostokov @ DumpAnalysis.org + TraceAnalysis.org -
Posted in Books, Malware Analysis, Victimware | 3 Comments »
Wednesday, September 7th, 2011
Whereas Stack Trace Collection pattern covers all thread stack traces from a memory dump Stack Trace Set pattern covers only unique non-duplicated thread stack traces differing for example, in stack frame modules and function names. In user process memory dumps it is !uniqstack WinDbg command (don’t forget that command has optional parameters, for example, -v to simulate verbose ~*kv output):
0:000> ~

.  0  Id: f00.f04 Suspend: 0 Teb: 7efdd000 Unfrozen

   1  Id: f00.f18 Suspend: 1 Teb: 7efda000 Unfrozen

   2  Id: f00.f1c Suspend: 1 Teb: 7efd7000 Unfrozen
0:000> ~*kc
. 0 Id: f00.f04 Suspend: 0 Teb: 7efdd000 Unfrozen
ntdll!NtWaitForMultipleObjects

KERNELBASE!WaitForMultipleObjectsEx

kernel32!WaitForMultipleObjectsExImplementation

kernel32!WaitForMultipleObjects

kernel32!WerpReportFaultInternal

kernel32!WerpReportFault

kernel32!BasepReportFault

kernel32!UnhandledExceptionFilter

ntdll!__RtlUserThreadStart

ntdll!_EH4_CallFilterFunc

ntdll!_except_handler4

ntdll!ExecuteHandler2

ntdll!ExecuteHandler

ntdll!KiUserExceptionDispatcher

KERNELBASE!DebugBreak

ApplicationK!main

ApplicationK!__tmainCRTStartup

kernel32!BaseThreadInitThunk

ntdll!__RtlUserThreadStart

ntdll!_RtlUserThreadStart
1 Id: f00.f18 Suspend: 1 Teb: 7efda000 Unfrozen
ntdll!NtDelayExecution

KERNELBASE!SleepEx

KERNELBASE!Sleep

kernel32!WerpReportFault

kernel32!BasepReportFault

kernel32!UnhandledExceptionFilter

ntdll!__RtlUserThreadStart

ntdll!_EH4_CallFilterFunc

ntdll!_except_handler4

ntdll!ExecuteHandler2

ntdll!ExecuteHandler

ntdll!KiUserExceptionDispatcher

ApplicationK!thread_two

ApplicationK!_callthreadstart

ApplicationK!_threadstart

kernel32!BaseThreadInitThunk

ntdll!__RtlUserThreadStart

ntdll!_RtlUserThreadStart
2 Id: f00.f1c Suspend: 1 Teb: 7efd7000 Unfrozen
ntdll!NtDelayExecution

KERNELBASE!SleepEx

KERNELBASE!Sleep

kernel32!WerpReportFault

kernel32!BasepReportFault

kernel32!UnhandledExceptionFilter

ntdll!__RtlUserThreadStart

ntdll!_EH4_CallFilterFunc

ntdll!_except_handler4

ntdll!ExecuteHandler2

ntdll!ExecuteHandler

ntdll!KiUserExceptionDispatcher

ApplicationK!thread_two

ApplicationK!_callthreadstart

ApplicationK!_threadstart

kernel32!BaseThreadInitThunk

ntdll!__RtlUserThreadStart

ntdll!_RtlUserThreadStart
0:000> !uniqstack

Processing 3 threads, please wait
.  0  Id: f00.f04 Suspend: 0 Teb: 7efdd000 Unfrozen

      Start: ApplicationK!mainCRTStartup (013a137c)

      Priority: 0  Priority class: 32  Affinity: 3

ChildEBP RetAddr

0037f1a4 770d0bdd ntdll!NtWaitForMultipleObjects+0x15

0037f240 7529162d KERNELBASE!WaitForMultipleObjectsEx+0x100

0037f288 75291921 kernel32!WaitForMultipleObjectsExImplementation+0xe0

0037f2a4 752b9b2d kernel32!WaitForMultipleObjects+0x18

0037f310 752b9bca kernel32!WerpReportFaultInternal+0x186

0037f324 752b98f8 kernel32!WerpReportFault+0x70

0037f334 752b9875 kernel32!BasepReportFault+0x20

0037f3c0 77b10df7 kernel32!UnhandledExceptionFilter+0x1af

0037f3c8 77b10cd4 ntdll!__RtlUserThreadStart+0x62

0037f3dc 77b10b71 ntdll!_EH4_CallFilterFunc+0x12

0037f404 77ae6ac9 ntdll!_except_handler4+0x8e

0037f428 77ae6a9b ntdll!ExecuteHandler2+0x26

0037f4d8 77ab010f ntdll!ExecuteHandler+0x24

0037f4d8 770d280c ntdll!KiUserExceptionDispatcher+0xf

0037f824 013a1035 KERNELBASE!DebugBreak+0x2

0037f828 013a1325 ApplicationK!main+0x25

0037f870 75293677 ApplicationK!__tmainCRTStartup+0xfb

0037f87c 77ad9f02 kernel32!BaseThreadInitThunk+0xe

0037f8bc 77ad9ed5 ntdll!__RtlUserThreadStart+0x70

0037f8d4 00000000 ntdll!_RtlUserThreadStart+0x1b
.  1  Id: f00.f18 Suspend: 1 Teb: 7efda000 Unfrozen

      Start: ApplicationK!_threadstart (013a10d1)

      Priority: 0  Priority class: 32  Affinity: 3

ChildEBP RetAddr

0080f9ac 770d31bb ntdll!NtDelayExecution+0x15

0080fa14 770d3a8b KERNELBASE!SleepEx+0x65

0080fa24 752d28dd KERNELBASE!Sleep+0xf

0080fa38 752b98f8 kernel32!WerpReportFault+0x3f

0080fa48 752b9875 kernel32!BasepReportFault+0x20

0080fad4 77b10df7 kernel32!UnhandledExceptionFilter+0x1af

0080fadc 77b10cd4 ntdll!__RtlUserThreadStart+0x62

0080faf0 77b10b71 ntdll!_EH4_CallFilterFunc+0x12

0080fb18 77ae6ac9 ntdll!_except_handler4+0x8e

0080fb3c 77ae6a9b ntdll!ExecuteHandler2+0x26

0080fbec 77ab010f ntdll!ExecuteHandler+0x24

0080fbec 013a1000 ntdll!KiUserExceptionDispatcher+0xf

0080ff38 013a10ab ApplicationK!thread_two

0080ff70 013a1147 ApplicationK!_callthreadstart+0x1b

0080ff78 75293677 ApplicationK!_threadstart+0x76

0080ff84 77ad9f02 kernel32!BaseThreadInitThunk+0xe

0080ffc4 77ad9ed5 ntdll!__RtlUserThreadStart+0x70

0080ffdc 00000000 ntdll!_RtlUserThreadStart+0x1b
Total threads: 3

Duplicate callstacks: 1(windbg thread #s follow):

2
Generally, any property can be chosen to form such a set from a collection of stack traces.
- Dmitry Vostokov @ DumpAnalysis.org + TraceAnalysis.org -
Posted in Crash Dump Analysis, Crash Dump Patterns, Debugging, Stack Trace Collection, WinDbg Tips and Tricks | 1 Comment »
Wednesday, September 7th, 2011
A few weeks ago when I was asked about my opinion whether the current economic crisis will deepen an idea came to me that Cloud Computing is the last Model piece of MVC (Model-View-Controller) where View is Social Media such as Facebook, LinkedIn, Twitter, etc. and Controller is Internet itself. With the final piece of the puzzle the World needs new MVC Revolution in order to get back on track.
Posted in Cloud Computing, Software Generalist Worldview, Software and Economics, Software and Future, Software and History, Software and Modeling, Software and Politics, Software and Sociology | No Comments »