Archive for the ‘Metrics’ Category

Trace Analysis Patterns (Part 234)
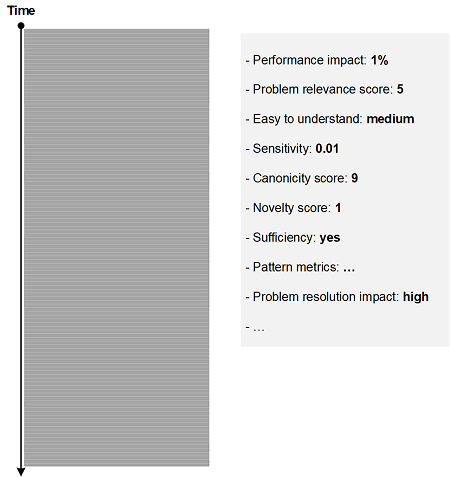
Sunday, September 17th, 2023

When comparing traces we may be interested in their Trace Benchmarks, for example (not limited to, just a proposal):

  • Performance impact (impact this trace collection has on system performance)
  • Problem relevance score (was it really relevant or missed the problem repro?)
  • Easy to understand (is there any room for improvement for trace messages?)
  • Sensitivity (does it have any sensitive information?)
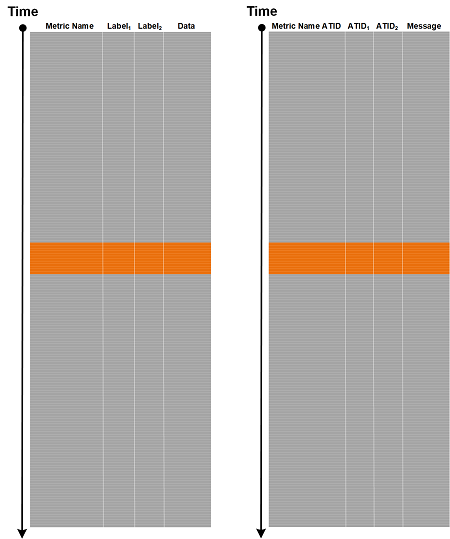
  • Canonicity score (does it contain all required ATIDs?)
  • Novelty score (any surprises?)
  • Sufficiency (does it require supplemental log from other tools?)
  • Pattern metrics (number of distinct error messages, etc., based on trace and log analysis patterns)
  • Problem resolution impact (was it the trace that provided missing insights?)

This post-analysis pattern may also be useful for problem postmortems and case studies. This pattern is different from Trace Summary which is a pre-analysis information.

- Dmitry Vostokov @ DumpAnalysis.org + TraceAnalysis.org -

Trace Analysis Patterns (Part 213)

Thursday, January 13th, 2022

Various types of Measurements are important in software diagnostics. We consider traces and logs, and general software narratives (and even hardware narratives) as a medium for all types of possible measurements. Even a small display in a handheld device showing a number is an example of Singleton Trace.

Typical trace and log measurement analysis patterns include Time Delta, Statement Density and Current, and Trace Acceleration. Numeric analysis patterns include Counter Value, Trace Field, Signal in general, and the forthcoming Trace Distance that uses various metrics, for example, the number of messages, Activity Regions, or just hops.

- Dmitry Vostokov @ DumpAnalysis.org + TraceAnalysis.org -

Trace Analysis Patterns (Part 203)

Sunday, January 10th, 2021

Various metrics are covered by Counter Value trace and log analysis pattern. However, metric labels or metric metadata as implemented by monitoring tools such as Prometheus can be mapped directly to Adjoint Threads of Activity in our trace and log analysis pattern catalog:

<Metric Name>{<Label Name>=<Label Value>, ...}=<Metric Value> (from Prometheus data model)

{<Metric Name ATID>=<ATID Value>, <ATID Name>=<ATID Value>, ..., <Message (Metric Value)>}

This allows the application of many trace and log analysis patterns related to threading and adjoint threading (multibraiding).

We call this analysis pattern Message Metadata. It is illustrated for time series in the following diagram where we have the same Labels for all metric names (in general labels may be different):

- Dmitry Vostokov @ DumpAnalysis.org + TraceAnalysis.org -