Online Training: Accelerated Windows Memory Dump Analysis
Monday, November 22nd, 2021I resume online training sessions. You can now register: https://www.patterndiagnostics.com/accelerated-windows-memory-dump-analysis
I resume online training sessions. You can now register: https://www.patterndiagnostics.com/accelerated-windows-memory-dump-analysis
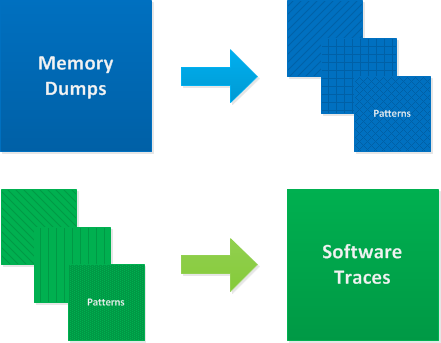
Doing memory dump analysis training for more than 2 years I found that students are divided into 2 types: those who prefer to see source code first and those who want to see a memory dump first. We actually prefer to show a memory dump first and then explore it to find certain patterns of abnormal structure and behavior. Software Diagnostics Services used this approach to design its Accelerated Windows Memory Dump Analysis and Accelerated .NET Memory Dump Analysis courses. Students explore memory dumps and debugger logs to find memory dump analysis patterns which are introduced when necessary. After that they can check source code of modeling applications if they have development experience. Accelerated Windows Software Trace Analysis course uses a different approach. It introduces all software trace analysis patterns at once because they are patterns from software narratology independent from programming languages and software platforms. After that they explore and analyze software traces and logs. We can summarize these 2 approaches on this diagram:
- Dmitry Vostokov @ DumpAnalysis.org + TraceAnalysis.org -
For some time I was struggling with finding a good name for memory dump and software trace analysis activities. The name Memoretics I use for the science of memory dump analysis (that also incorporates software traces) seems not so good to describe the whole practical activity that should be transparent to everyone in IT. Fortunately, I timely understood that all these activities constitute the essence of software diagnostics that previously lacked any solid foundation. Thus, Software Diagnostics Institute was reborn from the previous Crash Dump Analysis Portal. This institute does pure and applied research and scientific activities and in recent years was funded mainly from OpenTask publisher and recently from Memory Dump Analysis Services. The latter company also recognized that the broadening of its commercial activities requires a new name. So, Software Diagnostics Services was reborn:
The First Comprehensive Software Diagnostics Service
- Dmitry Vostokov @ DumpAnalysis.org + TraceAnalysis.org -
This is a second Webinar from Memory Dump Analysis Services on software diagnostics. The first one is about pattern recognition. During this Webinar you will learn how to apply systems theory and systems thinking for effective and efficient abnormal software behavior diagnostics: the foundation of software troubleshooting and debugging. The seminar summarizes 6 years of research done by Software Diagnostics Institute started with a short blog post Dumps and Systems Theory.

Title: Introduction to Systemic Software Diagnostics: Systems Thinking in Memory Dump and Software Trace Analysis
Date: 3rd of September, 2012
Time: 17:00 (BST) 12:00 (EST) 09:00 (PST)
Duration: 60 minutes
Space is limited.
Reserve your Webinar seat now at:
https://www3.gotomeeting.com/register/377382766
- Dmitry Vostokov @ DumpAnalysis.org + TraceAnalysis.org -
In a week this short full color book should appear in online bookstores:

- Dmitry Vostokov @ DumpAnalysis.org + TraceAnalysis.org -
Due to many questions on recommended books to learn assembly language asked during Accelerated Windows Memory Dump Analysis training sessions we provide these references:
Windows Debugging: Practical Foundations
x64 Windows Debugging: Practical Foundations
Each book can be read independently although some platform-independent content overlaps. x64 bit book focuses on 64-bit only.
We believe these books provide all necessary motivation, context and practical foundation for other in-depth assembly language textbooks on the market.
I’m also working on the similar book for x64 Mac OS X.
- Dmitry Vostokov @ DumpAnalysis.org + TraceAnalysis.org -
Memory Dump Analysis Services organizes a free Webinar on Unified Software Diagnostics (USD) and the new scalable cost-effective software support model called Pattern-Driven Software Support devised to address various shortcomings in existing tiered software support organizations. Examples cover Windows, Mac OS and Linux.

Date: 22nd of June, 2012
Time: 17:00 (BST) 12:00 (EST) 09:00 (PST)
Duration: 60 minutes
Space is limited.
Reserve your Webinar seat now at:
https://www3.gotomeeting.com/register/172771078
- Dmitry Vostokov @ DumpAnalysis.org + TraceAnalysis.org -

Memory Dump Analysis Services organizes a new training course:
Description: Learn how to analyze app crashes and freezes, navigate through process core memory dump space and diagnose corruption, memory leaks, CPU spikes, blocked threads, deadlocks, wait chains, and much more. We use a unique and innovative pattern-driven analysis approach to speed up the learning curve. The training consists of practical step-by-step exercises using Xcode and GDB environments highlighting various patterns diagnosed in 64-bit process core memory dumps. The training also includes an overview of relevant similarities and differences between Windows and Mac OS X user space memory dump analysis useful for engineers with Wintel background.
If you are registered you are allowed to optionally submit your app core dumps before the training. This will allow us in addition to the carefully constructed problems tailor additional examples to the needs of the attendees.
The training consists of 2 two-hour sessions. When you finish the training you additionally get:
Prerequisites: Basic Mac OS X troubleshooting and debugging
Audience: Software technical support and escalation engineers, system administrators, software developers and quality assurance engineers.
Session 1: October 19, 2012 4:00 PM - 6:00 PM BST
Session 2: October 22, 2012 4:00 PM - 6:00 PM BST
Price: 210 USD
Space is limited.
Reserve your remote training seat now at:
https://student.gototraining.com/r/3803636572165653760
If you are mainly interested in Windows memory dump analysis there is another course available:
Accelerated Windows Memory Dump Analysis
- Dmitry Vostokov @ DumpAnalysis.org + TraceAnalysis.org -
Memory Dump Analysis Services starts providing debugging training and assistance in addition to (based on) memory dump and software trace analysis. It has recently registered www.debugging.pro domain and is working on extending its courses to cover live debugging and additional OS platforms this year.
- Dmitry Vostokov @ DumpAnalysis.org + TraceAnalysis.org -
Advanced training sessions time may not suitable due to different geographic time zones. So I have decided to publish this training in a book format (currently in PDF) and make it available in paperback on Amazon and B&N later. Book details:
Now available for sale in PDF format from Memory Dump Analysis Services.
- Dmitry Vostokov @ DumpAnalysis.org + TraceAnalysis.org -
This is the first initiative for the year of software trace analysis: the first and unique software trace and log analysis training based entirely on patterns of software behavior. No longer you will be frustrated when opening a software trace with millions of messages from hundreds of software components, threads and processes.
Memory Dump Analysis Services (DumpAnalysis.com) organizes a training course:
Learn how to efficiently and effectively analyze software traces and logs from complex software environments. Covered popular software logs and trace formats from Microsoft and Citrix products and tools including Event Tracing for Windows (ETW) and Citrix Common Diagnostics Format (CDF). Learn how to use pioneering and innovative pattern-driven software problem behavior analysis to troubleshoot and debug software incidents.
If your are registered you are allowed to optionally submit your software traces and logs before the training. This will allow us in addition to the carefully constructed problems tailor additional examples to the needs of the attendees.
The training consists of 2 two-hour sessions and additional homework exercises. When you finish the training you additionally get:
Prerequisites: Basic Windows troubleshooting.
Audience: Software technical support and escalation engineers, software maintenance engineers, system administrators.
Session 1: October 12, 2012 4:00 PM - 6:00 PM BST
Session 2: October 15, 2012 4:00 PM - 6:00 PM BST
Price: 210 USD
Space is limited.
Reserve your remote training seat now at:
https://student.gototraining.com/r/5287623225237732608

- Dmitry Vostokov @ DumpAnalysis.org + TraceAnalysis.org -
Certain System Objects can be found in object directory and can be useful to see additional system and other product activity. For example, in a complete memory dump from Accelerated .NET Memory Dump Analysis training we see that LowCommitCondition event is signalled:
1: kd> !object \KernelObjects

Object: 85a08030  Type: (82b38ed0) Directory

    ObjectHeader: 85a08018 (old version)

    HandleCount: 0  PointerCount: 19

    Directory Object: 85a074c0  Name: KernelObjects
    Hash Address  Type          Name

    ---- -------  ----          ----

     02  82b7b0b8 Event         HighCommitCondition

     04  82b7b780 Event         HighMemoryCondition

     10  82b7b178 Event         LowNonPagedPoolCondition

     11  82b7b138 Event         HighNonPagedPoolCondition

     17  82b7b0f8 Event         LowCommitCondition

     20  82b78d08 Event         SuperfetchParametersChanged

         82b6eb58 Event         BootLoaderTraceReady

     23  84bfdd58 Session       Session0

         82b78c88 Event         PrefetchTracesReady

     24  84b7d1f8 Session       Session1

     25  82b78cc8 Event         SuperfetchScenarioNotify

         82b7b740 Event         LowPagedPoolCondition

     26  82b7b1b8 Event         HighPagedPoolCondition

         82b7a030 Event         MemoryErrors

     28  82b78c48 Event         SuperfetchTracesReady

     32  82b7b7c0 Event         LowMemoryCondition

         85a09d00 KeyedEvent    CritSecOutOfMemoryEvent

     34  82b7b078 Event         MaximumCommitCondition
1: kd> dt _DISPATCHER_HEADER 82b7b0f8

ntdll!_DISPATCHER_HEADER

   +0x000 Type             : 0 ''

   +0x001 Abandoned        : 0 ''

   +0x001 Absolute         : 0 ''

   +0x001 NpxIrql          : 0 ''

   +0x001 Signalling       : 0 ''

   +0x002 Size             : 0x4 ''

   +0x002 Hand             : 0x4 ''

   +0x003 Inserted         : 0 ''

   +0x003 DebugActive      : 0 ''

   +0x003 DpcActive        : 0 ''

   +0x000 Lock             : 0n262144

   +0×004 SignalState      : 0n1

   +0×008 WaitListHead     : _LIST_ENTRY [ 0×82b7b100 - 0×82b7b100 ]
If we check virtual memory statistics we see lots of free space for the currrent physical memory and pagefile:
1: kd> !vm
*** Virtual Memory Usage ***

 Physical Memory:      261872 (   1047488 Kb)

 Page File: \??\C:\pagefile.sys

   Current:   1354688 Kb  Free Space:     53120 Kb

   Minimum:   1354688 Kb  Maximum:      4194304 Kb

 Available Pages:      180984 (    723936 Kb)

 ResAvail Pages:       216475 (    865900 Kb)

 Locked IO Pages:           0 (         0 Kb)

 Free System PTEs:     352925 (   1411700 Kb)

 Modified Pages:          129 (       516 Kb)

 Modified PF Pages:        94 (       376 Kb)

 NonPagedPool Usage:        0 (         0 Kb)

 NonPagedPoolNx Usage:  16894 (     67576 Kb)

 NonPagedPool Max:     192350 (    769400 Kb)

 PagedPool 0 Usage:      5957 (     23828 Kb)

 PagedPool 1 Usage:      3218 (     12872 Kb)

 PagedPool 2 Usage:       965 (      3860 Kb)

 PagedPool 3 Usage:      1311 (      5244 Kb)

 PagedPool 4 Usage:      1064 (      4256 Kb)

 PagedPool Usage:       12515 (     50060 Kb)

 PagedPool Maximum:    523264 (   2093056 Kb)

 Session Commit:         5021 (     20084 Kb)

 Shared Commit:         15023 (     60092 Kb)

 Special Pool:              0 (         0 Kb)

 Shared Process:         1938 (      7752 Kb)

 PagedPool Commit:      12523 (     50092 Kb)

 Driver Commit:          2592 (     10368 Kb)

 Committed pages:      402494 (   1609976 Kb)

 Commit limit:         589254 (   2357016 Kb)

[...]
Another example is from Windows 7 memory dump I used for Fundamentals of Complete Crash and Hang Memory Dump Analysis presentation. Here we can find WER reporting mutant in session 1 object directory and get problem PID from its name:
0: kd> !object \Sessions\1\BaseNamedObjects\

Object: fffff8a0016eb290  Type: (fffffa800426df30) Directory

    ObjectHeader: fffff8a0016eb260 (new version)

    HandleCount: 57  PointerCount: 217

    Directory Object: fffff8a0016e9220  Name: BaseNamedObjects
    Hash Address          Type          Name

    ---- -------          ----          ----

     00  fffffa8008437670 Event         STOP_HOOKING64

[...]

    08  fffffa80044baa40 Mutant        WERReportingForProcess1788

[…]
0: kd> !process 0n1788 1

Searching for Process with Cid == 6fc

Cid handle table at fffff8a00180b000 with 21248 entries in use
PROCESS fffffa8004364060

    SessionId: 1  Cid: 06fc    Peb: 7fffffd4000  ParentCid: 0840

    DirBase: 5fbc2000  ObjectTable: fffff8a004c8e930  HandleCount:  16.

    Image: ApplicationD.exe

    VadRoot fffffa8009d85170 Vads 34 Clone 0 Private 206. Modified 0. Locked 0.

    DeviceMap fffff8a001ce6b90

    Token                             fffff8a003eab060

    ElapsedTime                       00:01:51.543

    UserTime                          00:00:00.000

    KernelTime                        00:00:00.000

    QuotaPoolUsage[PagedPool]         0

    QuotaPoolUsage[NonPagedPool]      0

    Working Set Sizes (now,min,max)  (483, 50, 345) (1932KB, 200KB, 1380KB)

    PeakWorkingSetSize                483

    VirtualSize                       13 Mb

    PeakVirtualSize                   13 Mb

    PageFaultCount                    481

    MemoryPriority                    BACKGROUND

    BasePriority                      8

    CommitCharge                      231
- Dmitry Vostokov @ DumpAnalysis.org + TraceAnalysis.org -
If not for you then definitely for me because I now diagnose Spiking Thread pattern much faster. One of the readers if this blog asked me whether there is !runaway command equivalent for kernel and complete memory dumps. So, after some thinking I gave it a try especially in the context of WinDbg scripting exercises designed for Advanced Windows Memory Dump Analysis training. As a result I wrote 2 scripts initially that you can try yourself. Their output here is taken from a complete memory dump I used for Fundamentals of Complete Crash and Hang Memory Dump Analysis presentation.
The first one dumps the most CPU consuming threads for user and kernel mode:
$$

$$ krunawaymost.wds

$$ Copyright (c) 2011 Memory Dump Analysis Services

$$ GNU GENERAL PUBLIC LICENSE

$$ http://www.gnu.org/licenses/gpl-3.0.txt

$$

r $t0 = 0

!for_each_thread “r $t1 = dwo( @#Thread + @@c++(#FIELD_OFFSET(nt!_KTHREAD, UserTime)) ); .if (@$t1 > @$t0) {r $t0 = @$t1; r $t2 = @#Thread}”

.echo “The largest UserTime value: ”

? @$t0

!thread @$t2 ff

r $t0 = 0

!for_each_thread “r $t1 = dwo( @#Thread + @@c++(#FIELD_OFFSET(nt!_KTHREAD, KernelTime)) ); .if (@$t1 > @$t0) {r $t0 = @$t1; r $t2 = @#Thread}”

.echo “The largest KernelTime value: ”

? @$t0

!thread @$t2 ff
0: kd> $$><c:\Scripts\krunawaymost.wds

The largest UserTime value:

Evaluate expression: 5470 = 00000000`0000155e

THREAD fffffa800451d720  Cid 1418.17fc  Teb: 000007fffffdc000 Win32Thread: 0000000000000000 RUNNING on processor 2

Not impersonating

DeviceMap                 fffff8a001ce6b90

Owning Process            fffffa800442ab30       Image:         ApplicationE.exe

Attached Process          N/A            Image:         N/A

Wait Start TickCount      22295          Ticks: 0

Context Switch Count      27960

UserTime                  00:01:25.332

KernelTime                00:00:00.015

*** ERROR: Module load completed but symbols could not be loaded for ApplicationE.exe

Win32 Start Address ApplicationE (0×000000013f0f1578)

Stack Init fffff8800723cc70 Current fffff8800723c960

Base fffff8800723d000 Limit fffff88007237000 Call 0

Priority 8 BasePriority 8 UnusualBoost 0 ForegroundBoost 0 IoPriority 2 PagePriority 5

Child-SP          RetAddr           Call Site

00000000`0021f9e0 00000000`00000000 ApplicationE+0×6cd3
The largest KernelTime value:

Evaluate expression: 187 = 00000000`000000bb

THREAD fffffa80098d7b60  Cid 07bc.0a14  Teb: 000007fffffd7000 Win32Thread: fffff900c2ca0c20 WAIT: (UserRequest) KernelMode Non-Alertable

    fffffa8008a4a030  NotificationEvent

Not impersonating

DeviceMap                 fffff8a001ce6b90

Owning Process            fffffa80096beb30       Image:         dwm.exe

Attached Process          N/A            Image:         N/A

Wait Start TickCount      22294          Ticks: 1 (0:00:00:00.015)

Context Switch Count      15473                 LargeStack

UserTime                  00:00:06.801

KernelTime                00:00:02.917

Win32 Start Address dwmcore!CPartitionThread::ThreadMain (0×000007fef8a1f0d8)

Stack Init fffff8800d3d5c70 Current fffff8800d3d5740

Base fffff8800d3d6000 Limit fffff8800d3cf000 Call 0

Priority 15 BasePriority 15 UnusualBoost 0 ForegroundBoost 0 IoPriority 2 PagePriority 5

Child-SP          RetAddr           Call Site

fffff880`0d3d5780 fffff800`02ee6f32 nt!KiSwapContext+0×7a

fffff880`0d3d58c0 fffff800`02ee974f nt!KiCommitThreadWait+0×1d2

fffff880`0d3d5950 fffff880`0fef65b3 nt!KeWaitForSingleObject+0×19f

fffff880`0d3d59f0 fffff960`001fedea dxgkrnl!DxgkWaitForVerticalBlankEvent+0×53f

fffff880`0d3d5ab0 fffff800`02ee0ed3 win32k!NtGdiDdDDIWaitForVerticalBlankEvent+0×12

fffff880`0d3d5ae0 000007fe`ff1d143a nt!KiSystemServiceCopyEnd+0×13 (TrapFrame @ fffff880`0d3d5ae0)

00000000`0287f778 000007fe`f8791da1 GDI32!NtGdiDdDDIWaitForVerticalBlankEvent+0xa

00000000`0287f780 000007fe`f89e1b6e dxgi!CDXGIOutput::WaitForVBlank+0×51

00000000`0287f7c0 000007fe`f89e1ae9 dwmcore!CD3DDeviceLevel1::WaitForVBlank+0×1f9

00000000`0287f810 000007fe`f89e1a9d dwmcore!CHwDisplayRenderTarget::WaitForVBlank+0×39

00000000`0287f850 000007fe`f89e1a4c dwmcore!CDesktopRenderTarget::WaitForVBlank+0×40

00000000`0287f880 000007fe`f89d3513 dwmcore!CSlaveHWndRenderTarget::WaitForVBlank+0×2c

00000000`0287f8c0 000007fe`f89d3584 dwmcore!CRenderTargetManager::WaitForVBlank+0×7d

00000000`0287f900 000007fe`f89d2661 dwmcore!CPartitionVerticalBlankScheduler::WaitForVBlank+0×7c

00000000`0287f950 000007fe`f8a1f0f4 dwmcore!CPartitionVerticalBlankScheduler::Run+0xe5

00000000`0287f9b0 00000000`7719652d dwmcore!CPartitionThread::ThreadMain+0×1c

00000000`0287f9e0 00000000`772cc521 kernel32!BaseThreadInitThunk+0xd

00000000`0287fa10 00000000`00000000 ntdll!RtlUserThreadStart+0×1d
The second script takes two arguments and shows all threads that have UserTime and KernelTime ticks value greater than (you can have the idea of the maximum from the previous script):
$$

$$ krunawaygt.wds

$$ Copyright (c) 2011 Memory Dump Analysis Services

$$ GNU GENERAL PUBLIC LICENSE

$$ http://www.gnu.org/licenses/gpl-3.0.txt

$$

!for_each_thread “r $t1 = dwo( @#Thread + @@c++(#FIELD_OFFSET(nt!_KTHREAD, UserTime)) ); r $t0 = $arg1; .if (@$t1 > @$t0) {!thread @#Thread ff}”

!for_each_thread “r $t1 = dwo( @#Thread + @@c++(#FIELD_OFFSET(nt!_KTHREAD, KernelTime)) ); r $t0 = $arg2; .if (@$t1 > @$t0) {!thread @#Thread ff}”
Using hints from the previous script run (the largest UserTime ticks value is 0×155e) we now get threads that spent more than 0×100 ticks in user mode:
0: kd> $$>a<c:\Scripts\krunawaygt.wds 100 100

THREAD fffffa800843e060  Cid 03f4.0658  Teb: 000007fffff90000 Win32Thread: 0000000000000000 WAIT: (WrQueue) UserMode Non-Alertable

    fffffa800843c2c0  QueueObject

Not impersonating

DeviceMap                 fffff8a000008aa0

Owning Process            fffffa800916b060       Image:         MsMpEng.exe

Attached Process          N/A            Image:         N/A

Wait Start TickCount      21211          Ticks: 1084 (0:00:00:16.910)

Context Switch Count      6028

UserTime                  00:00:10.140

KernelTime                00:00:00.296

Win32 Start Address msvcrt!endthreadex (0×000007feff5173fc)

Stack Init fffff88009d4bc70 Current fffff88009d4b660

Base fffff88009d4c000 Limit fffff88009d46000 Call 0

Priority 9 BasePriority 8 UnusualBoost 0 ForegroundBoost 0 IoPriority 2 PagePriority 5

*** ERROR: Symbol file could not be found.  Defaulted to export symbols for mprtp.dll -

Child-SP          RetAddr           Call Site

fffff880`09d4b6a0 fffff800`02ee6f32 nt!KiSwapContext+0×7a

fffff880`09d4b7e0 fffff800`02ee9f93 nt!KiCommitThreadWait+0×1d2

fffff880`09d4b870 fffff800`031ca647 nt!KeRemoveQueueEx+0×323

fffff880`09d4b930 fffff800`0319cae5 nt!IoRemoveIoCompletion+0×47

fffff880`09d4b9c0 fffff800`02ee0ed3 nt!NtRemoveIoCompletion+0×145

fffff880`09d4ba70 00000000`772f13aa nt!KiSystemServiceCopyEnd+0×13 (TrapFrame @ fffff880`09d4bae0)

00000000`0209fb08 000007fe`fd9e169d ntdll!ZwRemoveIoCompletion+0xa

00000000`0209fb10 00000000`7718a4e1 KERNELBASE!GetQueuedCompletionStatus+0×39

00000000`0209fb70 00000000`748f2c74 kernel32!GetQueuedCompletionStatusStub+0×11

00000000`0209fbb0 00000000`0045cbc0 mprtp!MpPluginSignatureChange+0×3e170

00000000`0209fbb8 000007fe`fbac25ff 0×45cbc0

00000000`0209fbc0 00000000`00466610 FLTLIB!FilterGetMessage+0×2b

00000000`0209fc20 00000000`00000000 0×466610
THREAD fffffa800845c060  Cid 03f4.065c  Teb: 000007fffff8e000 Win32Thread: 0000000000000000 WAIT: (WrQueue) UserMode Non-Alertable

    fffffa800843c2c0  QueueObject

Not impersonating

DeviceMap                 fffff8a000008aa0

Owning Process            fffffa800916b060       Image:         MsMpEng.exe

Attached Process          N/A            Image:         N/A

Wait Start TickCount      21520          Ticks: 775 (0:00:00:12.090)

Context Switch Count      4979

UserTime                  00:00:04.149

KernelTime                00:00:00.156

Win32 Start Address msvcrt!endthreadex (0×000007feff5173fc)

Stack Init fffff88009d52c70 Current fffff88009d52660

Base fffff88009d53000 Limit fffff88009d4d000 Call 0

Priority 8 BasePriority 8 UnusualBoost 0 ForegroundBoost 0 IoPriority 2 PagePriority 5

*** ERROR: Symbol file could not be found.  Defaulted to export symbols for mprtp.dll -

Child-SP          RetAddr           Call Site

fffff880`09d526a0 fffff800`02ee6f32 nt!KiSwapContext+0×7a

fffff880`09d527e0 fffff800`02ee9f93 nt!KiCommitThreadWait+0×1d2

fffff880`09d52870 fffff800`031ca647 nt!KeRemoveQueueEx+0×323

fffff880`09d52930 fffff800`0319cae5 nt!IoRemoveIoCompletion+0×47

fffff880`09d529c0 fffff800`02ee0ed3 nt!NtRemoveIoCompletion+0×145

fffff880`09d52a70 00000000`772f13aa nt!KiSystemServiceCopyEnd+0×13 (TrapFrame @ fffff880`09d52ae0)

00000000`01ccf498 000007fe`fd9e169d ntdll!ZwRemoveIoCompletion+0xa

00000000`01ccf4a0 00000000`7718a4e1 KERNELBASE!GetQueuedCompletionStatus+0×39

00000000`01ccf500 00000000`748f2c74 kernel32!GetQueuedCompletionStatusStub+0×11

00000000`01ccf540 00000000`0045d030 mprtp!MpPluginSignatureChange+0×3e170

00000000`01ccf548 000007fe`fbac25ff 0×45d030

00000000`01ccf550 00000000`004666b0 FLTLIB!FilterGetMessage+0×2b

00000000`01ccf5b0 00000000`00000000 0×4666b0
THREAD fffffa80092b7060  Cid 03f4.1268  Teb: 000007fffff6a000 Win32Thread: 0000000000000000 WAIT: (WrQueue) UserMode Alertable

    fffffa8009299140  QueueObject

Not impersonating

DeviceMap                 fffff8a000008aa0

Owning Process            fffffa800916b060       Image:         MsMpEng.exe

Attached Process          N/A            Image:         N/A

Wait Start TickCount      7762           Ticks: 14533 (0:00:03:46.716)

Context Switch Count      3297

UserTime                  00:00:06.489

KernelTime                00:00:00.499

Win32 Start Address ntdll!TppWorkerThread (0×00000000772bfbc0)

Stack Init fffff8800e620c70 Current fffff8800e620680

Base fffff8800e621000 Limit fffff8800e61b000 Call 0

Priority 8 BasePriority 8 UnusualBoost 0 ForegroundBoost 0 IoPriority 2 PagePriority 5

Child-SP          RetAddr           Call Site

fffff880`0e6206c0 fffff800`02ee6f32 nt!KiSwapContext+0×7a

fffff880`0e620800 fffff800`02ee9f93 nt!KiCommitThreadWait+0×1d2

fffff880`0e620890 fffff800`031ca647 nt!KeRemoveQueueEx+0×323

fffff880`0e620950 fffff800`02ecdb36 nt!IoRemoveIoCompletion+0×47

fffff880`0e6209e0 fffff800`02ee0ed3 nt!NtWaitForWorkViaWorkerFactory+0×285

fffff880`0e620ae0 00000000`772f2c1a nt!KiSystemServiceCopyEnd+0×13 (TrapFrame @ fffff880`0e620ae0)

00000000`0540f998 00000000`772bfe0b ntdll!ZwWaitForWorkViaWorkerFactory+0xa

00000000`0540f9a0 00000000`7719652d ntdll!TppWorkerThread+0×2c9

00000000`0540fca0 00000000`772cc521 kernel32!BaseThreadInitThunk+0xd

00000000`0540fcd0 00000000`00000000 ntdll!RtlUserThreadStart+0×1d
THREAD fffffa80098d7b60  Cid 07bc.0a14  Teb: 000007fffffd7000 Win32Thread: fffff900c2ca0c20 WAIT: (UserRequest) KernelMode Non-Alertable

    fffffa8008a4a030  NotificationEvent

Not impersonating

DeviceMap                 fffff8a001ce6b90

Owning Process            fffffa80096beb30       Image:         dwm.exe

Attached Process          N/A            Image:         N/A

Wait Start TickCount      22294          Ticks: 1 (0:00:00:00.015)

Context Switch Count      15473                 LargeStack

UserTime                  00:00:06.801

KernelTime                00:00:02.917

Win32 Start Address dwmcore!CPartitionThread::ThreadMain (0×000007fef8a1f0d8)

Stack Init fffff8800d3d5c70 Current fffff8800d3d5740

Base fffff8800d3d6000 Limit fffff8800d3cf000 Call 0

Priority 15 BasePriority 15 UnusualBoost 0 ForegroundBoost 0 IoPriority 2 PagePriority 5

Child-SP          RetAddr           Call Site

fffff880`0d3d5780 fffff800`02ee6f32 nt!KiSwapContext+0×7a

fffff880`0d3d58c0 fffff800`02ee974f nt!KiCommitThreadWait+0×1d2

fffff880`0d3d5950 fffff880`0fef65b3 nt!KeWaitForSingleObject+0×19f

fffff880`0d3d59f0 fffff960`001fedea dxgkrnl!DxgkWaitForVerticalBlankEvent+0×53f

fffff880`0d3d5ab0 fffff800`02ee0ed3 win32k!NtGdiDdDDIWaitForVerticalBlankEvent+0×12

fffff880`0d3d5ae0 000007fe`ff1d143a nt!KiSystemServiceCopyEnd+0×13 (TrapFrame @ fffff880`0d3d5ae0)

00000000`0287f778 000007fe`f8791da1 GDI32!NtGdiDdDDIWaitForVerticalBlankEvent+0xa

00000000`0287f780 000007fe`f89e1b6e dxgi!CDXGIOutput::WaitForVBlank+0×51

00000000`0287f7c0 000007fe`f89e1ae9 dwmcore!CD3DDeviceLevel1::WaitForVBlank+0×1f9

00000000`0287f810 000007fe`f89e1a9d dwmcore!CHwDisplayRenderTarget::WaitForVBlank+0×39

00000000`0287f850 000007fe`f89e1a4c dwmcore!CDesktopRenderTarget::WaitForVBlank+0×40

00000000`0287f880 000007fe`f89d3513 dwmcore!CSlaveHWndRenderTarget::WaitForVBlank+0×2c

00000000`0287f8c0 000007fe`f89d3584 dwmcore!CRenderTargetManager::WaitForVBlank+0×7d

00000000`0287f900 000007fe`f89d2661 dwmcore!CPartitionVerticalBlankScheduler::WaitForVBlank+0×7c

00000000`0287f950 000007fe`f8a1f0f4 dwmcore!CPartitionVerticalBlankScheduler::Run+0xe5

00000000`0287f9b0 00000000`7719652d dwmcore!CPartitionThread::ThreadMain+0×1c

00000000`0287f9e0 00000000`772cc521 kernel32!BaseThreadInitThunk+0xd

00000000`0287fa10 00000000`00000000 ntdll!RtlUserThreadStart+0×1d
THREAD fffffa800451d720  Cid 1418.17fc  Teb: 000007fffffdc000 Win32Thread: 0000000000000000 RUNNING on processor 2

Not impersonating

DeviceMap                 fffff8a001ce6b90

Owning Process            fffffa800442ab30       Image:         ApplicationE.exe

Attached Process          N/A            Image:         N/A

Wait Start TickCount      22295          Ticks: 0

Context Switch Count      27960

UserTime                  00:01:25.332

KernelTime                00:00:00.015

*** ERROR: Module load completed but symbols could not be loaded for ApplicationE.exe

Win32 Start Address ApplicationE (0×000000013f0f1578)

Stack Init fffff8800723cc70 Current fffff8800723c960

Base fffff8800723d000 Limit fffff88007237000 Call 0

Priority 8 BasePriority 8 UnusualBoost 0 ForegroundBoost 0 IoPriority 2 PagePriority 5

Child-SP          RetAddr           Call Site

00000000`0021f9e0 00000000`00000000 ApplicationE+0×6cd3
Memory Dump Analysis Services is now working to incorporate client-side WinDbg scripting into their CARE2 architecture.
- Dmitry Vostokov @ DumpAnalysis.org + TraceAnalysis.org -
During the previous several months some companies and individuals expressed their interest in the training (the next one is scheduled for January) but its time was not suitable due to different geographic time zones. So I have decided to publish this training in a book format (currently in PDF) and make it available in paperback on Amazon and B&N later. Book details:
Now available for sale in PDF format from Memory Dump Analysis Services.
- Dmitry Vostokov @ DumpAnalysis.org + TraceAnalysis.org -
The slides are available from Memory Dump Analysis Services:
http://www.dumpanalysis.com/Training/Accelerated-NET-Memory-Dump-Analysis-Public.pdf
It also offers the new training sessions in January, 2012:
http://www.dumpanalysis.com/accelerated-net-memory-dump-analysis
http://www.dumpanalysis.com/accelerated-windows-memory-dump-analysis
Also the registration for Advanced training session in December is still open:
http://www.dumpanalysis.com/advanced-windows-memory-dump-analysis
There are also new coming courses for 2012 so stay tuned!
- Dmitry Vostokov @ DumpAnalysis.org + TraceAnalysis.org -
The new 6th volume contains revised, edited, cross-referenced, and thematically organized selected DumpAnalysis.org blog posts about memory dump and software trace analysis, software troubleshooting and debugging written in November 2010 - October 2011 for software engineers developing and maintaining products on Windows platforms, quality assurance engineers testing software on Windows platforms, technical support and escalation engineers dealing with complex software issues, and security researchers, malware analysts and reverse engineers. The sixth volume features:
Product information:

Back cover features 3d memory space visualization image created with ParaView.
- Dmitry Vostokov @ DumpAnalysis.org + TraceAnalysis.org -
After the launch of the first episode about symbols I decided to make it recurrent where registration will be needed only once. So I apologize to all who already registered for episode 0×01 that another registration well be required for episode 0×02. However, no registration will be necessary for episode 0×03 and so on. If anyone misses episode 0×02 they can still register for episode 0×03 and all subsequent episodes only once, and so on by induction.
The second episode is about symbol file troubleshooting. All about this topic in 8 slides in 8 minutes including live WinDbg demonstration plus extra 8 minutes for you to ask questions.
Register for Debugging TV Frame 0×02 and further weekly episodes
Date: Friday, October 14, 2011
Time: 5:45 PM - 6:01 PM BST
Space is limited.
Reserve your seat now at:
https://www3.gotomeeting.com/register/318613774
After registering you will receive a confirmation email containing information about joining the show.
Debugging TV Frame 0×01
Recording: https://www3.gotomeeting.com/register/640694470
Slides: DebuggingTV_Frame_0×01.pdf
WinDbg log: DebuggingTV_Frame_0×01.txt
More frames are coming and www.debugging.tv will host TV programme and recordings of past episodes.
- Dmitry Vostokov @ DumpAnalysis.org + TraceAnalysis.org -
Due to the need to extend existing basic and intermediate Accelerated Windows Memory Dump Analysis training Memory Dump Analysis Services organises advanced training course. Here is the description and registration information:
Learn how to navigate through memory dump space and Windows data structures to troubleshoot and debug complex software incidents. We use a unique and innovative pattern-driven analysis approach to speed up the learning curve. The training consists of practical step-by-step exercises using WinDbg to diagnose structural and behavioral patterns in 32-bit and 64-bit process, kernel and complete memory dumps.

If you are registered you are allowed to optionally submit your memory dumps before the training. This will allow us in addition to the carefully constructed problems tailor extra examples to the needs of the attendees.
The training consists of one four-hour session and additional homework exercises. When you finish the training you additionally get:
Prerequisites: Basic and intermediate level Windows memory dump analysis: ability to list processors, processes, threads, modules, apply symbols, walk through stack traces and raw stack data, diagnose patterns such as heap corruption, CPU spike, memory and handle leaks, access violation, stack overflow, critical section and resource wait chains and deadlocks. If you don’t feel comfortable with prerequisites then Accelerated Windows Memory Dump Analysis training is recommended to take (or purchase a corresponding book) before attending this course.
Audience: Software developers, software technical support and escalation engineers.
Session: December 9, 2011 4:00 PM - 8:00 PM GMT
Price: 210 USD
Space is limited.
Reserve your remote training seat now at:
https://student.gototraining.com/24s4l/register/3788047691824598784
- Dmitry Vostokov @ DumpAnalysis.org + TraceAnalysis.org -
Due to popular demand and the need to extend existing Accelerated Windows Memory Dump Analysis training Memory Dump Analysis Services organises the new training course. Here is the description and registration information:
Learn how to analyze .NET application and service crashes and freezes, navigate through memory dump space (managed and unmanaged code) and diagnose corruption, leaks, CPU spikes, blocked threads, deadlocks, wait chains, resource contention, and much more. We use a unique and innovative pattern-driven analysis approach to speed up the learning curve. The training consists of practical step-by-step exercises using WinDbg to diagnose patterns in 32-bit and 64-bit process memory dumps.

If you are registered you are allowed to optionally submit your memory dumps before the training. This will allow us in addition to the carefully constructed problems tailor extra examples to the needs of the attendees.
The training consists of one four-hour session and additional homework exercises. When you finish the training you additionally get:
Prerequisites: Basic .NET programming and debugging.
Audience: Software developers, software technical support and escalation engineers.
Session: October 28, 2011 4:00 PM - 8:00 PM GMT
Price: 210 USD
Space is limited.
Reserve your remote training seat now at:
https://student.gototraining.com/24s4l/register/423991811034037760
- Dmitry Vostokov @ DumpAnalysis.org + TraceAnalysis.org -
During the previous several months many people expressed their interest in the training (the next one is scheduled for November) but its time was not suitable due to the very different geographic time zones. So I have decided to publish this training in book format (currently in PDF) and make it available in paperback on Amazon and B&N later. Book details:

Now available for sale in PDF format from Memory Dump Analysis Services.
- Dmitry Vostokov @ DumpAnalysis.org + TraceAnalysis.org -