Archive for the ‘Reverse Engineering’ Category
Monday, November 17th, 2025
The list of local variables displayed by the dv WinDbg command may contain False Local Addresses, especially if some non-standard alignment is used on ARM64 platforms. For example, we get this address that doesn’t look correct if we associate it with the source code:
* _Alignas(4096) long long ll = 1;
0:000> dv /V

0000000b`970fe260 @x27+0×1000                    ll = 0n-3689348814741910324

0000000b`970fd490 @x27+0×0230                 align = 8
It is not aligned on the page boundary, and the value is not the expected 1:
0:000> dq 0000000b`970fe260 L1

0000000b`970fe260  cccccccc`cccccccc
However, in the disassembly, we see the following sequence of instructions to initialize the variable:
00007ff7`d061afdc f9533f69 ldr         x9,[x27,#0x2678]

00007ff7`d061afe0 d2800028 mov         x8,#1

00007ff7`d061afe4 f9000128 str         x8,[x9]
So, we can see that the local variable address is stored at x27+0×2678:
0:000> dp x27+0x2678 L1

0000000b`970ff8d8  0000000b`970fd000
and see the correct variable value:
0:000> dpp x27+0x2678 L1

0000000b`970ff8d8  0000000b`970fd000 00000000`00000001
This analysis pattern differs from False Effective Address analysis pattern in the correct value of the base register.
- Dmitry Vostokov @ DumpAnalysis.org + TraceAnalysis.org -
Posted in ARM64 Windows, Crash Dump Analysis, Crash Dump Patterns, Reverse Engineering | Comments Off
Sunday, January 28th, 2024
This is an unmanaged code analysis pattern variant of the previously published Annotated Disassembly. In modern WinDbg (which was previously called WinDbg Preview), the Disassembly window may annotate local variables in the presence of debugging symbols (this is absent from the output of the uf WinDbg command):
 ; uf command output

511 00007ff6`6ab22a44 mov     dword ptr [rbp+2078h],1

511 00007ff6`6ab22a4e mov     dword ptr [rbp+207Ch],2

513 00007ff6`6ab22a58 mov     eax,dword ptr [rbp+2078h]

513 00007ff6`6ab22a5e mov     dword ptr [rbp+0Ch],eax

514 00007ff6`6ab22a61 mov     dword ptr [rbp+0Ch],64h

515 00007ff6`6ab22a68 mov     dword ptr [rbp+48h],3

515 00007ff6`6ab22a6f mov     dword ptr [rbp+4Ch],4

516 00007ff6`6ab22a76 mov     eax,dword ptr [rbp+0Ch]
; Disassembly window

00007ff6`6ab22a4e c7857c20000002000000   mov     dword ptr [myDerived.field2 (rbp+207Ch)], 2

00007ff6`6ab22a58 8b8578200000           mov     eax, dword ptr [myDerived{.field} (rbp+2078h)]

00007ff6`6ab22a5e 89450c                 mov     dword ptr [myBase{.field} (rbp+Ch)], eax

00007ff6`6ab22a61 c7450c64000000         mov     dword ptr [myBase{.field} (rbp+Ch)], 64h

00007ff6`6ab22a68 c7454803000000         mov     dword ptr [myDerived2{.field} (rbp+48h)], 3

00007ff6`6ab22a6f c7454c04000000         mov     dword ptr [myDerived2.field2 (rbp+4Ch)], 4

00007ff6`6ab22a76 8b450c                 mov     eax, dword ptr [myBase{.field} (rbp+Ch)]
- Dmitry Vostokov @ DumpAnalysis.org + TraceAnalysis.org -
Posted in Crash Dump Analysis, Crash Dump Patterns, Debugging, Reverse Engineering, x64 Windows | Comments Off
Sunday, January 28th, 2024
Sometimes, when we have debugging symbols, information about local variables may be helpful in making sense of function disassembly. For example, we have this code fragment from WinDbg uf command:
  511 00007ff6`6ab22a44 mov     dword ptr [rbp+2078h],1

511 00007ff6`6ab22a4e mov     dword ptr [rbp+207Ch],2

513 00007ff6`6ab22a58 mov     eax,dword ptr [rbp+2078h]

513 00007ff6`6ab22a5e mov     dword ptr [rbp+0Ch],eax

514 00007ff6`6ab22a61 mov     dword ptr [rbp+0Ch],64h

515 00007ff6`6ab22a68 mov     dword ptr [rbp+48h],3

515 00007ff6`6ab22a6f mov     dword ptr [rbp+4Ch],4

516 00007ff6`6ab22a76 mov     eax,dword ptr [rbp+0Ch]
Although source code lines are shown, suppose we don’t have source code to match. However, we can match Address Representations, such as [rbp+xxx], from the output of dv /V WinDbg command:
0:000> dv /V

...

000000ab`740fd00c @rbp+0x000c                myBase = struct wmain::__l2::Base

...

000000ab`740ff078 @rbp+0x2078             myDerived = struct wmain::__l2::Derived

...

000000ab`740fd048 @rbp+0x0048            myDerived2 = struct wmain::__l2::Derived

...
Another usage is matching values in raw stack data with local variable addresses. Values as addresses and their symbolic representations here have some connection to ADDR Symbolic and Interpreted Pointers.
- Dmitry Vostokov @ DumpAnalysis.org + TraceAnalysis.org -
Posted in Crash Dump Analysis, Crash Dump Patterns, Debugging, Machine Learning, Reverse Engineering, x64 Windows | Comments Off
Thursday, September 20th, 2012
I was very pleased to find out this book that uses WinDbg as OS reversing tool. Not only you learn a very important aspect of Windows internals related to crash and hang memory dump analysis (all crash processing starts from memory manager) but you also learn many WinDbg commands from practical reversing experiments. I was even more pleased to find the output of WinDbg command on the page 0, before even the table of contents.
What Makes It Page?: The Windows 7 (x64) Virtual Memory Manager

- Dmitry Vostokov @ DumpAnalysis.org + TraceAnalysis.org -
Posted in Books, Crash Dump Analysis, Reverse Engineering, Software Architecture, WinDbg Tips and Tricks, Windows 7, Windows Memory Management, x64 Windows | No Comments »
Thursday, October 13th, 2011
When disassembling JIT code it is good to see annotated function calls with full type and token information:
0:000> !CLRStack

OS Thread Id: 0xbf8 (0)

ESP       EIP

001fef90 003200a4 ClassMain.DoWork()

001fef94 00320082 ClassMain.Main(System.String[])

001ff1b0 79e7c74b [GCFrame: 001ff1b0]
0:000> !U 00320082

Normal JIT generated code

ClassMain.Main(System.String[])

Begin 00320070, size 13

00320070 b960300d00      mov     ecx,0D3060h (MT: ClassMain)

00320075 e8a21fdaff      call    000c201c (JitHelp: CORINFO_HELP_NEWSFAST)

0032007a 8bc8            mov     ecx,eax

0032007c ff159c300d00    call    dword ptr ds:[0D309Ch] (ClassMain.DoWork(), mdToken: 06000002)

>>> 00320082 c3              ret
However, this doesn’t work when we disable the output of raw bytes:
0:000> .asm no_code_bytes

Assembly options: no_code_bytes
0:000> !U 00320082

Normal JIT generated code

ClassMain.Main(System.String[])

Begin 00320070, size 13

00320070 mov     ecx,0D3060h

00320075 call    000c201c

0032007a mov     ecx,eax

0032007c call    dword ptr ds:[0D309Ch]

>>> 00320082 ret
Here we can still double check JIT-ed function calls manually:
0:000> dd 0D309Ch l1

000d309c  00320098
0:000> !IP2MD 00320098

MethodDesc: 000d3048

Method Name: ClassMain.DoWork()

Class: 000d1180

MethodTable: 000d3060

mdToken: 06000002

Module: 000d2c3c

IsJitted: yes

m_CodeOrIL: 00320098
- Dmitry Vostokov @ DumpAnalysis.org + TraceAnalysis.org -
Posted in .NET Debugging, Assembly Language, Crash Dump Analysis, Crash Dump Patterns, Debugging, Reverse Engineering | No Comments »
Monday, October 10th, 2011
I noticed this pattern when analyzing the output of !DumpStack WinDbg SOS extension command:
0:011> !DumpStack

OS Thread Id: 0xac (11)

[...]

ChildEBP RetAddr  Caller, Callee

[…]

0b73f65c 77c416dc ntdll!RtlAllocateHeap+0×17c, calling ntdll!RtlpLowFragHeapAllocFromContext

0b73f688 77c486cd ntdll!RtlAllocateHeap+0×193, calling ntdll!memset

0b73f6b0 7653a467 kernel32!TlsSetValue+0×4c, calling ntdll!RtlAllocateHeap

0b73f6cc 77a01c48 urlmon!CUrlMkTls::TLSAllocData+0×3f, calling kernel32!TlsSetValue

0b73f6dc 77a0198d urlmon!CUrlMkTls::CUrlMkTls+0×29, calling urlmon!CUrlMkTls::TLSAllocData

0b73f6e8 77a01be5 urlmon!TlsDllMain+0×100, calling urlmon!EnsureFeatureCache

0b73f6f4 6d016a21 mshtml!DllMain+0×10, calling kernel32!GetCurrentThreadId

0b73f704 6d016b6c mshtml!_CRT_INIT+0×281, calling mshtml!DllMain

0b73f71c 7239133e msimtf!_CRT_INIT+0×281, calling msimtf!DllMain

0b73f728 72391375 msimtf!_CRT_INIT+0×3e7, calling msimtf!_SEH_epilog4

0b73f764 6d016ad0 mshtml!_DllMainStartup+0×56, calling mshtml!_DllMainCRTStartup

0b73f778 72391375 msimtf!_CRT_INIT+0×3e7, calling msimtf!_SEH_epilog4

0b73f77c 77c4a604 ntdll!LdrpCallInitRoutine+0×14

0b73f7a4 77c1ab6c ntdll!LdrpInitializeThread+0×1e9, calling ntdll!RtlLeaveCriticalSection

0b73f7ac 77c1a9ea ntdll!LdrpInitializeThread+0×1cd, calling ntdll!_SEH_epilog4

0b73f800 77c1ab15 ntdll!LdrpInitializeThread+0×11f, calling ntdll!RtlActivateActivationContextUnsafeFast

0b73f804 77c1ab53 ntdll!LdrpInitializeThread+0×167, calling ntdll!RtlDeactivateActivationContextUnsafeFast

0b73f838 77c1a9ea ntdll!LdrpInitializeThread+0×1cd, calling ntdll!_SEH_epilog4

0b73f83c 77c405a0 ntdll!NtTestAlert+0xc

0b73f840 77c1a968 ntdll!_LdrpInitialize+0×29c, calling ntdll!_SEH_epilog4

0b73f8a0 77c3f3d0 ntdll!NtContinue+0xc

0b73f8a4 77c1a98a ntdll!LdrInitializeThunk+0×1a, calling ntdll!NtContinue

0b73fb30 6afd59f6 clr!Thread::intermediateThreadProc+0×39, calling clr!_alloca_probe_16

0b73fb44 76573833 kernel32!BaseThreadInitThunk+0xe

0b73fb50 77c1a9bd ntdll!_RtlUserThreadStart+0×23
Obviously the command collected “call-type” execution residue from the raw stack. The “calling” part wasn’t found in the nearby region:
0:011> dps 0b73f7a4-20 0b73f7a4+20

0b73f784  72390000 msimtf!_imp__RegOpenKeyW <PERF> (msimtf+0×0)

0b73f788  00000002

0b73f78c  00000000

0b73f790  00000001

0b73f794  0b73f80c

0b73f798  0b73f80c

0b73f79c  00000001

0b73f7a0  05636578

0b73f7a4  0b73f83c

0b73f7a8  77c1ab6c ntdll!LdrpInitializeThread+0×1e9

0b73f7ac  77ca5340 ntdll!LdrpLoaderLock

0b73f7b0  77c1a9ea ntdll!LdrpInitializeThread+0×1cd

0b73f7b4  0b7321f2

0b73f7b8  7ff4e000

0b73f7bc  7ffdf000

0b73f7c0  77ca51f4 ntdll!LdrpProcessInitialized

0b73f7c4  00000000
I tried to disassemble backwards the addresses and found the callees:
0:011> ub 77c1ab6c

ntdll!LdrpInitializeThread+0×16b:

77c1ab57 90              nop

77c1ab58 90              nop

77c1ab59 90              nop

77c1ab5a 90              nop

77c1ab5b 90              nop

77c1ab5c ff054452ca77    inc     dword ptr [ntdll!LdrpActiveThreadCount (77ca5244)]

77c1ab62 684053ca77      push    offset ntdll!LdrpLoaderLock (77ca5340)

77c1ab67 e8bd820000      call    ntdll!RtlLeaveCriticalSection (77c22e29)
0:011> ub 77a01be5

urlmon!TlsDllMain+0×2f:

77a01bce 8d4510          lea     eax,[ebp+10h]

77a01bd1 50              push    eax

77a01bd2 8d4d0c          lea     ecx,[ebp+0Ch]

77a01bd5 e88efdffff      call    urlmon!CUrlMkTls::CUrlMkTls (77a01968)

77a01bda 397d10          cmp     dword ptr [ebp+10h],edi

77a01bdd 7c09            jl      urlmon!TlsDllMain+0×103 (77a01be8)

77a01bdf 56              push    esi

77a01be0 e887fcffff      call    urlmon!EnsureFeatureCache (77a0186c)
In the past I was frequently referencing this pattern especially when discussing coincidental symbolic information but didn’t name it. Now it’s time to do that: Caller-n-Callee.
We can also run !DumpStack command against every thread (including nonmanaged) to get the summary of the call-type execution residue:
0:011> ~4s

eax=76573821 ebx=00000002 ecx=00000000 edx=74d01909 esi=00000000 edi=00000000

eip=77c40f34 esp=0478f8a0 ebp=0478f93c iopl=0 nv up ei pl zr na pe nc

cs=001b ss=0023 ds=0023 es=0023 fs=003b gs=0000 efl=00000246

ntdll!KiFastSystemCallRet:

77c40f34 c3 ret
0:004> k

ChildEBP RetAddr

0478f89c 77c40690 ntdll!KiFastSystemCallRet

0478f8a0 76577e09 ntdll!ZwWaitForMultipleObjects+0xc

0478f93c 7674c4af kernel32!WaitForMultipleObjectsEx+0x11d

0478f990 76748b7b user32!RealMsgWaitForMultipleObjectsEx+0x13c

0478f9ac 74d01965 user32!MsgWaitForMultipleObjects+0x1f

0478f9f8 76573833 GdiPlus!BackgroundThreadProc+0x59

0478fa04 77c1a9bd kernel32!BaseThreadInitThunk+0xe

0478fa44 00000000 ntdll!_RtlUserThreadStart+0x23
0:004> !DumpStack

OS Thread Id: 0x950 (4)

Current frame: ntdll!KiFastSystemCallRet

ChildEBP RetAddr  Caller, Callee

0478f89c 77c40690 ntdll!ZwWaitForMultipleObjects+0xc

0478f8a0 76577e09 kernel32!WaitForMultipleObjectsEx+0x11d, calling ntdll!NtWaitForMultipleObjects

0478f914 76751a91 user32!UserCallWinProcCheckWow+0x5c, calling ntdll!RtlActivateActivationContextUnsafeFast

0478f918 76751b41 user32!UserCallWinProcCheckWow+0x16a, calling ntdll!RtlDeactivateActivationContextUnsafeFast

0478f93c 7674c4af user32!RealMsgWaitForMultipleObjectsEx+0x13c, calling kernel32!WaitForMultipleObjectsEx

0478f968 76752a65 user32!DispatchMessageWorker+0x396, calling user32!_SEH_epilog4

0478f980 76743c64 user32!PeekMessageA+0x129, calling user32!_PeekMessage

0478f990 76748b7b user32!MsgWaitForMultipleObjects+0x1f, calling user32!MsgWaitForMultipleObjectsEx

0478f9ac 74d01965 GdiPlus!BackgroundThreadProc+0x59, calling user32!MsgWaitForMultipleObjects

0478f9f8 76573833 kernel32!BaseThreadInitThunk+0xe

0478fa04 77c1a9bd ntdll!_RtlUserThreadStart+0x23
- Dmitry Vostokov @ DumpAnalysis.org + TraceAnalysis.org -
Posted in .NET Debugging, Assembly Language, Crash Dump Analysis, Crash Dump Patterns, Debugging, Reverse Engineering, WinDbg Tips and Tricks | 2 Comments »
Wednesday, September 21st, 2011
Memoretics promotes pattern-driven memory dump and software trace analysis which has many uses but not limited to:
- Software and site reliability
- Software Debugging
- QA and Software Testing
- Computer Security
- Software Troubleshooting
- Malware Research and Analysis
- Tools as a Service (TaaS)
- Supportability
- Software Diagnostics

- Dmitry Vostokov @ DumpAnalysis.org + TraceAnalysis.org -
Posted in Cloud Memory Dump Analysis, Computer Forensics, Crash Dump Analysis, Crash Dump Patterns, DebugWare Patterns, Debugging, Debugging Trends, Escalation Engineering, Malware Analysis, Malware Patterns, Memiotics (Memory Semiotics), Memoretics, Memory Analysis Forensics and Intelligence, Metadefect Template Library, Metamalware, Pattern Models, Pattern Prediction, Reverse Engineering, Root Cause Analysis, Science of Memory Dump Analysis, Science of Software Tracing, Security, Software Behavior DNA, Software Behavior Patterns, Software Behavioral Genome, Software Defect Construction, Software Engineering, Software Generalist, Software Narratology, Software Support Patterns, Software Technical Support, Software Trace Analysis, Software Troubleshooting Patterns, Structural Memory Patterns, Structural Trace Patterns, Systems Thinking, Testing, Tools, Trace Analysis Patterns, Troubleshooting Methodology, UI Problem Analysis Patterns, Unified Debugging Patterns, Victimware, Windows System Administration, Workaround Patterns | No Comments »
Wednesday, September 21st, 2011
Memoretics as a science of memory snapshots borrows many ideas from the following disciplines (the list is not exhaustive):
- Troubleshooting and Debugging
- Intelligence Analysis
- Critical Thinking
- Forensics
- Linguistics
- Archaeology
- Psychoanalysis
- History
- Mathematics: Sets and Categories
- Literary Criticism and Narratology
It also contributes many ideas back. The following diagram depicts such an interaction:

- Dmitry Vostokov @ DumpAnalysis.org + TraceAnalysis.org -
Posted in Archaeology of Computer Memory, Categorical Debugging, Computer Forensics, Computer Science, Countefactual Debugging, Crash Dump Analysis, Crash Dump De-analysis, Crash Dump Patterns, Debugging, Debugging Methodology, Dublin School of Security, Education and Research, Escalation Engineering, General Memory Analysis, Generative Debugging, Hermeneutics of Memory Dumps and Traces, History, Intelligence Analysis Patterns, M->analysis, Malware Analysis, Malware Patterns, Mathematics of Debugging, Memiotics (Memory Semiotics), Memoretics, Memory Analysis Forensics and Intelligence, Memory Dump Analysis and History, Memory Systems Language, Memory Visualization, Metadefect Template Library, Metamalware, New Debugging School, Paleo-debugging, Pattern Models, Pattern Prediction, Psychoanalysis of Software Maintenance and Support, Psychology, Reverse Engineering, Root Cause Analysis, Science of Memory Dump Analysis, Science of Software Tracing, Security, Software Architecture, Software Behavior DNA, Software Behavior Patterns, Software Behavioral Genome, Software Chorography, Software Chorology, Software Defect Construction, Software Engineering, Software Narratology, Software Technical Support, Software Trace Analysis, Software Trace Analysis and History, Software Trace Deconstruction, Software Trace Linguistics, Software Trace Reading, Software Trace Visualization, Software Tracing Implementation Patterns, Software Troubleshooting Patterns, Software Victimology, Software and History, Structural Memory Analysis and Social Sciences, Structural Memory Patterns, Structural Trace Patterns, Systems Thinking, Testing, Tools, Trace Analysis Patterns, Troubleshooting Methodology, UI Problem Analysis Patterns, Unified Debugging Patterns, Victimware, Virtualization, Visual Dump Analysis, Workaround Patterns | No Comments »
Sunday, August 14th, 2011
Due to the need to extend existing basic and intermediate Accelerated Windows Memory Dump Analysis training Memory Dump Analysis Services organises advanced training course. Here is the description and registration information:
Learn how to navigate through memory dump space and Windows data structures to troubleshoot and debug complex software incidents. We use a unique and innovative pattern-driven analysis approach to speed up the learning curve. The training consists of practical step-by-step exercises using WinDbg to diagnose structural and behavioral patterns in 32-bit and 64-bit process, kernel and complete memory dumps.

If you are registered you are allowed to optionally submit your memory dumps before the training. This will allow us in addition to the carefully constructed problems tailor extra examples to the needs of the attendees.
The training consists of one four-hour session and additional homework exercises. When you finish the training you additionally get:
- A full transcript in PDF format (retail price $200)
- 5 volumes of Memory Dump Analysis Anthology in PDF format (retail price $100)
- A personalized attendance certificate with unique CID (PDF format)
Prerequisites: Basic and intermediate level Windows memory dump analysis: ability to list processors, processes, threads, modules, apply symbols, walk through stack traces and raw stack data, diagnose patterns such as heap corruption, CPU spike, memory and handle leaks, access violation, stack overflow, critical section and resource wait chains and deadlocks. If you don’t feel comfortable with prerequisites then Accelerated Windows Memory Dump Analysis training is recommended to take (or purchase a corresponding book) before attending this course.
Audience: Software developers, software technical support and escalation engineers.
Session: December 9, 2011 4:00 PM - 8:00 PM GMT
Price: 210 USD
Space is limited.
Reserve your remote training seat now at:
https://student.gototraining.com/24s4l/register/3788047691824598784
- Dmitry Vostokov @ DumpAnalysis.org + TraceAnalysis.org -
Posted in Announcements, Complete Memory Dump Analysis, Crash Dump Analysis, Crash Dump Patterns, Debugging, Escalation Engineering, Kernel Development, Memory Dump Analysis Services, Multithreading, Reverse Engineering, Root Cause Analysis, Software Engineering, Software Technical Support, Structural Memory Patterns, Training and Seminars, Uses of UML, Vista, WinDbg Scripts, WinDbg Tips and Tricks, Windows 7, Windows Data Structures, Windows Server 2008, x64 Windows | No Comments »
Friday, June 24th, 2011
Having Fun - Having too many functions to analyze, reverse engineer, or simply having too many of them on a call stack.
Examples: We were having fun all night. A thread had fun culminating in a double fault. Why do I love debugging?
- Dmitry Vostokov @ DumpAnalysis.org + TraceAnalysis.org -
Posted in Code Reading, Crash Dump Analysis, Debugging, Fun with Crash Dumps, Fun with Debugging, Fun with Reversing, Reverse Engineering | No Comments »
Tuesday, April 26th, 2011
Jobs page on Memory Dump, Software Trace, Debugging and Malware Analysis Portal now accepts company job ads related to security research, computer forensics, reverse engineering, and malware analysis in addition to debugging, software defect research, crash / core / memory dump and software trace analysis.
http://www.dumpanalysis.org/jobs
- Dmitry Vostokov @ DumpAnalysis.org + TraceAnalysis.org -
Posted in Announcements, Computer Forensics, Cyber Warfare, Malware Analysis, Memory Dump Analysis Jobs, Reverse Engineering, Security | No Comments »
Sunday, April 17th, 2011
I’m pleased to announce that MDAA, Volume 5 is available in PDF format:
www.dumpanalysis.org/Memory+Dump+Analysis+Anthology+Volume+5
It features:
- 25 new crash dump analysis patterns
- 11 new pattern interaction case studies (including software tracing)
- 16 new trace analysis patterns
- 7 structural memory patterns
- 4 modeling case studies for memory dump analysis patterns
- Discussion of 3 common analysis mistakes
- Malware analysis case study
- Computer independent architecture of crash analysis report service
- Expanded coverage of software narratology
- Metaphysical and theological implications of memory dump worldview
- More pictures of memory space and physicalist art
- Classification of memory visualization tools
- Memory visualization case studies
- Close reading of the stories of Sherlock Holmes: Dr. Watson’s observational patterns
- Fully cross-referenced with Volume 1, Volume 2, Volume 3, and Volume 4
Its table of contents is available here:
www.dumpanalysis.org/MDAA/MDA-Anthology-V5-TOC.pdf
Paperback and hardcover versions should be available in a week or two. I also started working on Volume 6 that should be available in November-December.
- Dmitry Vostokov @ DumpAnalysis.org + TraceAnalysis.org -
Posted in Aesthetics of Memory Dumps, Analysis Notation, Announcements, AntiPatterns, Archaeology of Computer Memory, Art, Assembly Language, Best Practices, Books, C and C++, CDF Analysis Tips and Tricks, Categorical Debugging, Citrix, Common Mistakes, Common Questions, Complete Memory Dump Analysis, Computer Forensics, Computer Science, Crash Analysis Report Environment (CARE), Crash Dump Analysis, Crash Dump De-analysis, Crash Dump Patterns, Crash Dumps for Dummies, Cyber Warfare, Debugging, Debugging Bureau, Debugging Industry, Debugging Methodology, Debugging Slang, Debugging Trends, Deep Down C++, Dr. Watson, Dublin School of Security, Education and Research, Escalation Engineering, Fun with Crash Dumps, Fun with Debugging, Fun with Software Traces, General Memory Analysis, Hermeneutics of Memory Dumps and Traces, Images of Computer Memory, Kernel Development, Malware Analysis, Mathematics of Debugging, Memiotics (Memory Semiotics), Memory Analysis Forensics and Intelligence, Memory Diagrams, Memory Dump Analysis Services, Memory Dumps in Myths, Memory Space Art, Memory Systems Language, Memory Visualization, Memory and Glitches, Metaphysics of Memory Worldview, Multithreading, Music for Debugging, New Acronyms, New Debugging School, New Words, Pattern Models, Philosophy, Physicalist Art, Publishing, Reverse Engineering, Science of Memory Dump Analysis, Science of Software Tracing, Security, Software Architecture, Software Behavior Patterns, Software Chorography, Software Chorology, Software Defect Construction, Software Engineering, Software Generalist, Software Maintenance Institute, Software Narratology, Software Technical Support, Software Trace Analysis, Software Trace Reading, Software Trace Visualization, Software Tracing for Dummies, Software Troubleshooting Patterns, Software Victimology, Structural Memory Patterns, Structural Trace Patterns, Systems Thinking, Testing, The Way of Philip Marlowe, Tools, Trace Analysis Patterns, Training and Seminars, Troubleshooting Methodology, Victimware, Vista, Webinars, WinDbg Scripting Extensions, WinDbg Scripts, WinDbg Tips and Tricks, WinDbg for GDB Users, Windows 7, Windows Server 2008, Windows System Administration, Workaround Patterns, x64 Windows | No Comments »
Tuesday, April 5th, 2011
Finally, after the numerous delays, the first Windows Debugging Notebook is almost ready for publication by the end of this month with a new cover and a foreword written by Mario Hewardt, the author of Advanced Windows Debugging and Advanced .NET Debugging books:
It is the first notebook because we have decided to split it into 3 different memory space volumes and one additional overview volume for concepts and tools:
- Windows Debugging Notebook: Essential User Space WinDbg Commands (ISBN: 978-1906717001 and 978-0955832857)
- Windows Debugging Notebook: Essential Kernel Space WinDbg Commands (ISBN: 978-1908043146)
- Windows Debugging Notebook: Essential Managed Space WinDbg .NET Commands (ISBN: 978-1908043153)
- Windows Debugging Notebook: Essential Concepts and Tools (ISBN: 978-1908043160)
On a bookshelf you would be able to distinguish between the first 3 volumes by a 3 color spine stripe with an appropriate check on it: red for kernel, blue for user, and green for managed space.
The Table of Contents has been changed too.
- Dmitry Vostokov @ DumpAnalysis.org + TraceAnalysis.org -
Posted in Announcements, Assembly Language, Books, Crash Dump Analysis, Debugging, Escalation Engineering, Publishing, Reverse Engineering, Security, Software Engineering, Software Technical Support, WinDbg Scripts, WinDbg Tips and Tricks | 2 Comments »
Tuesday, October 24th, 2006
Crash dumps (and live debugging) can be very useful for reverse engineering component dependencies. Let’s look at MS Video Driver Architecture UML component diagram (synthesized after reading various articles from OSR and DDK):
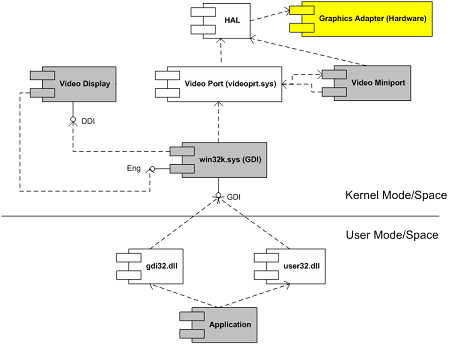
Coupled with this understanding and armed with Citrix symbol files (which are freely downloadable from Citrix support and you don’t really need them to see component dependencies) I was able to transform this thread stack below and other similar stacks into the following UML component diagram (some functions are shown as module!xxx and offsets are removed for clarity):
nt!KiSwapContext

nt!KiSwapThread

nt!KeWaitForSingleObject

tcpip!xxx

tcpip!TCPDispatch

nt!IofCallDriver

nt!xxx

nt!xxx

TDTCP!xxx

TDTCP!xxx

TDTCP!TdIoctl

termdd!_IcaCallSd

termdd!IcaCallNextDriver

pdrframe!xxx

pdrframe!PdIoctl

termdd!_IcaCallSd

termdd!IcaCallNextDriver

pdcrypt1!xxx

pdcrypt1!PdIoctl

termdd!_IcaCallSd

termdd!IcaCallNextDriver

WDICA!xxx

WDICA!xxx

WDICA!xxx

WDICA!xxx

WDICA!xxx

WDICA!xxx

WDICA!WdIoctl

termdd!IcaCallStack

termdd!IcaCallDriver

termdd!IcaDeviceControlChannel

termdd!IcaDeviceControl

termdd!IcaDispatch

win32k!GreDeviceIoControl

win32k!EngDeviceIoControl

vdtw30!xxx

vdtw30!xxx

win32k!vMovePointer

win32k!GreMovePointer

win32k!xxxMoveEventAbsolute

win32k!ProcessMouseInput

win32k!InputApc

nt!KiDeliverApc

nt!KiSwapThread

nt!KeWaitForMultipleObjects

win32k!xxxMsgWaitForMultipleObjects

win32k!xxxDesktopThread

win32k!xxxCreateSystemThreads

win32k!NtUserCallOneParam

nt!KiSystemServiceCopyEnd

nt!KiSwapThread

nt!KeWaitForSingleObject

win32k!EngWaitForSingleObject

vdtw30!xxx

vdtw30!xxx

vdtw30!xxx

vdtw30!DrvTw2SaveScreenBits

win32k!GreSaveScreenBits

win32k!CreateSpb

win32k!zzzChangeStates

win32k!zzzBltValidBits

win32k!xxxEndDeferWindowPosEx

win32k!xxxSetWindowPos

win32k!xxxShowWindow

win32k!NtUserShowWindow

nt!KiSystemService

USER32!NtUserShowWindow

USER32!InternalDialogBox

USER32!DialogBoxIndirectParamAorW

USER32!DialogBoxParamW
We replace MS components with Citrix ones:
- Video Display with vdtw30.dll
- Video Miniport with icacdd.sys
- Hardware and HAL with Terminal Services stack components (MS termdd.sys, Citrix wdica.sys, etc)

- Dmitry Vostokov -
Posted in Citrix, Crash Dump Analysis, Kernel Development, Reverse Engineering, Software Architecture | 6 Comments »