Bugtation No.9
Wednesday, August 20th, 2008“There is nothing more deceptive than an obvious” bug.
Sherlock Holmes, The Boscombe Valley Mystery
- Dmitry Vostokov @ DumpAnalysis.org -
“There is nothing more deceptive than an obvious” bug.
Sherlock Holmes, The Boscombe Valley Mystery
- Dmitry Vostokov @ DumpAnalysis.org -
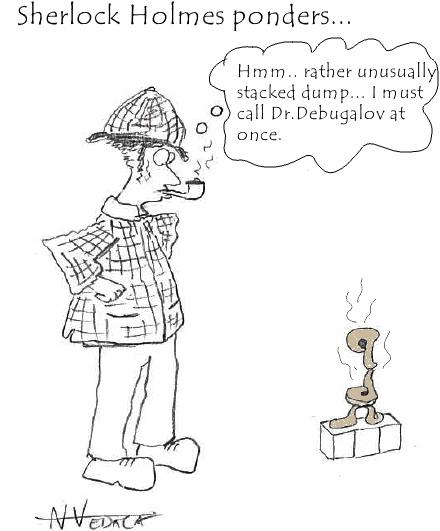
New cartoon from Narasimha Vedala (click on it to enlarge):
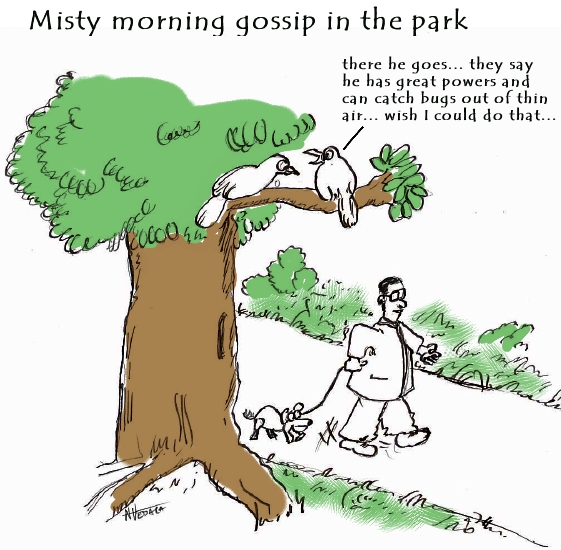
Misty morning gossip in the park
- Dmitry Vostokov @ DumpAnalysis.org -
I wasn’t active last 3 months although I have many cached managerial thoughts in my Moleskine notebook that I plan to start publishing in September.
ManagementBits Blog:
I don’t remember whether I told this before or not but all management bits are available in a handy bit string here:
- Dmitry Vostokov @ DumpAnalysis.org -
New cartoon from Narasimha Vedala provides insight into crazy bugs (click on it to enlarge):
A visit to the Psychiatrist

- Dmitry Vostokov @ DumpAnalysis.org -
Debugging “will one day be as necessary for efficient” programming “as the ability to read and write” code.
- Dmitry Vostokov @ DumpAnalysis.org -
New cartoon from Narasimha Vedala provides insight into the beauty of nature (click on it to enlarge):
Nature’s Wonder: Life cycle of a beetle

- Dmitry Vostokov @ DumpAnalysis.org -
This bugtation is identical to the original quotation:
“Thank you for not dividing by zero.”
Unknown
Encouraged by this I propose another one ![]()
“Thank you for checking for NULL pointers.”
- Dmitry Vostokov @ DumpAnalysis.org -
New cartoon from Narasimha Vedala captures recent rumors about the opening of Olympics:
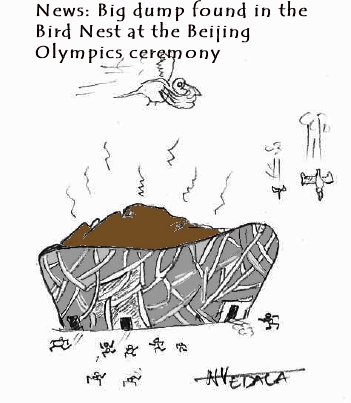
Just to remind you that China is 6th on my Memory Dump Awareness Index.
- Dmitry Vostokov @ DumpAnalysis.org -
“I admit that” debugging “is a good thing. But excessive devotion to it is a bad thing.”
- Dmitry Vostokov @ DumpAnalysis.org -
There were no updates last two months primarily because I was still reading huge books 1,000 pages each. One of them was The Road to Reality that I started in March and finished only a few weeks ago. When I was about two-thirds through it and I thought that I could never finish it a sign happened to shed the light on the possible end. While commuting from work a shadow from the train window sign projected ”Exit” on the book and I asked to take a picture of this event:

LiterateScientist Blog:
The Skeptical Environmentalist
- Dmitry Vostokov @ DumpAnalysis.org -
“The great tragedy of” Software: “the slaying of a beautiful” program “by an ugly” bug.
Thomas Henry Huxley, Collected Essays
- Dmitry Vostokov @ DumpAnalysis.org -
Suppose we set up breakpoints to catch a random issue or at the end of a lengthy loop and we don’t want to sit tight, stare at the screen and wait for a debugger notification event. We just want to sit relaxed and read our favourite book or do something else. I discovered this meta-command where we can specify a wave file to be played every time a debugger breaks into a command prompt:
The .sound_notify command causes a sound to be played when WinDbg enters the wait-for-command state (from WinDbg help).
For example:
(15dc.dd0): Break instruction exception - code 80000003 (first chance)

eax=7ffde000 ebx=00000000 ecx=00000000 edx=77b3d094 esi=00000000 edi=00000000

eip=77af7dfe esp=01c6fbf4 ebp=01c6fc20 iopl=0 nv up ei pl zr na pe nc

cs=001b  ss=0023  ds=0023  es=0023  fs=003b  gs=0000             efl=00000246

ntdll!DbgBreakPoint:

77af7dfe cc              int     3
windbg> .sound_notify /ef c:\Windows\Media\tada.wav

Sound notification: file 'c:\Windows\Media\tada.wav'
0:001> g

(15dc.175c): Break instruction exception - code 80000003 (first chance)

eax=7ffde000 ebx=00000000 ecx=00000000 edx=77b3d094 esi=00000000 edi=00000000

eip=77af7dfe esp=01cafc08 ebp=01cafc34 iopl=0 nv up ei pl zr na pe nc

cs=001b  ss=0023  ds=0023  es=0023  fs=003b  gs=0000             efl=00000246

ntdll!DbgBreakPoint:

77af7dfe cc              int     3
[tada.wav is played when we break into]
- Dmitry Vostokov @ DumpAnalysis.org -
“O” engineers, “throw light on this error.”
Leonardo da Vinci, The Notebooks
- Dmitry Vostokov @ DumpAnalysis.org -
“If you find the” crash dump, “perhaps others may find the explanation.”
Sherlock Holmes, The Problem of Thor Bridge
- Dmitry Vostokov @ DumpAnalysis.org -
In the previous post about resolving security issues with crash dumps I mentioned the solution to use logs generated from memory dump files. In the case of process dumps the obvious step is to save logs by a postmortem debugger at the moment of the crash. Here WinDbg scripts come to the rescue. Suppose that CDB is set as a postmortem debugger (see Custom postmortem debuggers on Vista) and AeDebug \ Debugger registry key value is set to:
"C:\Program Files\Debugging Tools for Windows\cdb.exe" -p %ld -e %ld -g -y SRV*c:\mss*http://msdl.microsoft.com/download/symbols -c "$$><c:\WinDbgScripts\LogsAndDumps.txt;q"
Here we specify MS symbols server and the script file. The symbol path is absolutely necessary to have correct stack traces. The script file has the following contents:
.logopen /t c:\UserDumps\process.log

.kframes 100

!analyze -v

~*kv

lmv

.logclose

.dump /m /u c:\UserDumps\mini_process

.dump /ma /u c:\UserDumps\full_process

.dump /mrR /u c:\UserDumps\secure_mini_process

.dump /marR /u c:\UserDumps\secure_full_process
.kframes WinDbg meta-command is necessary to avoid the common pitfall of looking at cut off stack traces (see Mistake #1). In addition to logging the output of any command we want, the script writes 4 memory dumps of the same process:
- mini dump
- full dump
- secure mini dump
- secure full dump
My previous post WinDbg is privacy-aware explains secure dumps in detail. If you need to tailor dump file names and logs to include real process name might need to try the following or similar technique explained here:
Generating file name for .dump command
- Dmitry Vostokov @ DumpAnalysis.org -
“It requires a very unusual mind to undertake the analysis of the obvious” crash.
Alfred North Whitehead, Science and the Modern World
- Dmitry Vostokov @ DumpAnalysis.org -
First, a definition for a new word that I coined today:
Bugtation
noun
Date: 21st century
1. a modified quotation showing relation to debugging and troubleshooting
This is the first bugtation I would like to introduce and it is related to heisenbugs:
“There’s no such thing as” heisenbug;
“And what to us seems merest accident
Springs from the deepest source of” computation.Friedrich Schiller, Early Dramas
Deviations from original quotations are highlighted in blue. Welcome to the new literary art! ![]()
Note: if you notice any bugs in bugtations please let me know…
- Dmitry Vostokov @ DumpAnalysis.org -
.dump WinDbg command doesn’t have an option to include the process name although we can specify PID, date and time using /u option. This question came to me ages ago but only yesterday one of the visitors (Thomas B.) provided a hint to use aliases:
as /c CrashApp [get a module name here]
.dump /ma /u c:\UserDumps\${CrashApp}.dmp
Unfortunately an attempt to use lm command fails due to a line break in the output:
0:001> lmM *.exe 1m

notepad
0:001> as /c CrashApp lmM *.exe 1m
0:001> .dump /ma /u c:\UserDumps\${CrashApp}.dmp

Unable to create file 'c:\UserDumps\notepad

_06ec_2008-08-13_14-39-30-218_06cc.dmp‘ - Win32 error 0n123

    “The filename, directory name, or volume label syntax is incorrect.”
After some thinking I recalled that .printf command doesn’t output line breaks. Also the module name can be extracted from _PEB structure if it is accessible. $peb pseudo-register can be used to get PEB address automatically. Therefore I came up with the following alias:
as /c CrashFirstModule .printf "%mu", @@c++((*(ntdll!_LDR_DATA_TABLE_ENTRY**)&@$peb->Ldr->InLoadOrderModuleList.Flink)->BaseDllName.Buffer)
0:001> as /c CrashFirstModule .printf "%mu", @@c++((*(ntdll!_LDR_DATA_TABLE_ENTRY**)&@$peb->Ldr->InLoadOrderModuleList.Flink)->BaseDllName.Buffer)
0:001> .dump /ma /u c:\UserDumps\${CrashFirstModule}.dmp

Creating c:\UserDumps\notepad.exe_06ec_2008-08-13_14-44-51-702_06cc.dmp - mini user dump

Dump successfully written
These commands can be included in a script for a postmortem debugger, for example, CDB.
- Dmitry Vostokov @ DumpAnalysis.org -
Yesterday I sent to print the first draft version with finalized covers for editing in situ. I usually do editing on the real book. Then error corrections and layout improvements can be done in real WYSIWYG hardcopy book mode. What’s new in Volume 2:
- 45 new crash dump analysis patterns
- Pattern interaction and case studies
- Updated checklist
- Fully cross-referenced with Volume 1
- New appendixes
I aim to publish paperback and digital versions on the 3st of October and hardcover version on the 1st of November. Table of Contents will be announced in soon.
Here’s the book cover:

Back cover features visualized virtual process memory generated from a memory dump of colorimetric computer memory dating sample using Dump2Picture.
- Dmitry Vostokov @ DumpAnalysis.org -