Archive for the ‘General Memory Analysis’ Category
Tuesday, January 29th, 2013
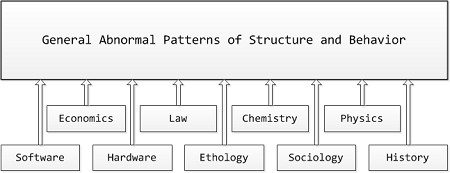
Memory Analysis Patterns (MAPs) including memory dump, malware, software trace (TAPs), and other patterns and pattern catalogs from Software Diagnostics Institute form the very rich semantic network. Now it is possible (by using a metaphorical bijection) to create a catalog of General Patterns of Abnormal Structure and Behaviour including software, hardware, biological behavior including animal (ethology) and human behavior, sociological and historical behavior including economics, business and finance, ethics and law, and even behavior of chemical and physical systems. Such “GAPs of Structure and Behavior” may include wait chains, spikes, deadlocks, etc. We provide more specific examples in the forthcoming parts. So we are a few steps closer to realization of my old dangerous idea of a parameterized science of universal memory dumps by the so called science files or might event a general diagnostics discipline.
- Dmitry Vostokov @ DumpAnalysis.org + TraceAnalysis.org -
Posted in Announcements, Anthropology, Biology, Business, Catastrophe Theory, Causality, Chaos, Chemistry, Complexity, Computation, Economics, Ethics, General Abnormal Patterns, General Memory Analysis, General Science, Hardware, History, Humanities, Ideas, Language, Life, Medicine, Physics, Political Economy, Politics, Psychoanalysis, Psychology, Religion, Semantics, Semiotics, Social Media, Social Sciences, Software Generalist Worldview, Software and Business, Software and Economics, Software and History, Software and Industrial Production, Software and Politics, Software and Religion, Software and Science, Software and Sociology, Structural Memory Analysis and Social Sciences, Systems Theory, Systems Thinking | No Comments »
Friday, September 28th, 2012
The previous mathematical definition of memory dump is for raw memory dumps. They are not really useful because they require symbol files. Each symbol file entry conceptually is a correspondence between a memory address and a direct sum or product of letters from some alphabet:
00000000`76e82c40: kernel32!WaitForMultipleObjectsExImplementation
So we propose an analytical definition of a memory dump as a direct sum of disjoint memory areas Mt taken during some time interval (t0, …, tn) where we replace stk having values from Z2 with Stq having values from Zp and cardinality of Zp depending on a platform (32, 64, etc) plus a symbolic description ∏Di for each Stq with cardinality of ”i” set sufficient enough to accommodate the largest symbolic name:
M = ∑Mt where Mt = ∑(Stq+∏Di)
or simply
M = ∑∑(Stq+∏Di)
This can be visualized as a linear memory space such as a virtual memory space when symbol files are applied to modules one after another. However, all this is not necessary, as a symbol from a virtual address can also be mapped to a physical address if necessary. ∏Di, in fact, refers to any symbolic description.
- Dmitry Vostokov @ DumpAnalysis.org + TraceAnalysis.org -
Posted in Computer Science, Crash Dump Analysis, Crash Dump Patterns, General Memory Analysis, Mathematics, Mathematics of Debugging, Science of Memory Dump Analysis, Systems Theory | No Comments »
Thursday, March 15th, 2012
This is both a game and serious philosophical and religious tool to guide your life. Basically you need either 32 coin flips to construct a 32-bit pointer (or 64 flips for wide coverage) or 16 flips using a dice where each throw can generate at least 2 bits. Any device can help if you can get a random pointer. Then you use your favourite memory dump and symbol files for interpretation. Double, triple and multiple dereferences from a pointer can also be used to construe a path.
For example, I just played and got:
0:000> ? 0y10010111111000100100011011100111

Evaluate expression: -1746778393 = 97e246e7
0:000> !address 97e246e7

Address 97e246e7 could not be mapped in any available regions
If address is inaccessible switch to another memory dump or continue flips and shift digits to the left. This way I got:
0:000> ? 0y00101111110001001000110111001111

Evaluate expression: 801410511 = 2fc48dcf
0:000> !address 02fc48dcf

Usage:                  Free

Base Address:           1f858000

End Address:            58c30000

Region Size:            393d8000

Type:                   00000000

State:                  00010000 MEM_FREE

Protect:                00000001 PAGE_NOACCESS
Continue flip and shift until you get an output with symbol signs:
0:000> ? 0y01011111100010010001101110011110

Evaluate expression: 1602821022 = 5f891b9e
0:000> dp 5F891B9E

5f891b9e  ???????? ???????? ???????? ????????

5f891bae  ???????? ???????? ???????? ????????

5f891bbe  ???????? ???????? ???????? ????????

5f891bce  ???????? ???????? ???????? ????????

5f891bde  ???????? ???????? ???????? ????????

5f891bee  ???????? ???????? ???????? ????????

5f891bfe  ???????? ???????? ???????? ????????

5f891c0e  ???????? ???????? ???????? ????????
0:000> !address 5F891B9E

Usage:                  Free

Base Address:           5eb8a000

End Address:            60080000

Region Size:            014f6000

Type:                   00000000

State:                  00010000 MEM_FREE

Protect:                00000001 PAGE_NOACCESS
Unloaded modules that overlapped the region in the past:

BaseAddr EndAddr    Size

5ebc0000 5ebcd000     d000 Perfctrs.dll
Dump output for thought: “In the past - perfect control, performance was counted, now - free.”
- Dmitry Vostokov @ DumpAnalysis.org + TraceAnalysis.org -
Posted in Announcements, Fun with Crash Dumps, Fun with Debugging, Games for Debugging, General Memory Analysis, Memory Religion (Memorianity), WinDbg Tips and Tricks | No Comments »
Sunday, March 11th, 2012
Software narratological approach can be useful for writing, analyzing and validating historical narratives. Trace and event log messages play the role of historical events where process ids are assigned to particular historical institutions and their representatives. Threads serve the role of historical entities like persons. Modules play the role of shared ideologies. We already use this approach for writing history books.
This can also work on a different level such as analyzing a history of debugging as a sequence of troubleshooting and debugging stories. More on this later as I plan to provide concrete examples from history. For the time being please read how software narratology and memoretics (the study of memory snapshots) help fiction writers as well.
- Dmitry Vostokov @ DumpAnalysis.org + TraceAnalysis.org -
Posted in General Memory Analysis, Hermeneutics of Memory Dumps and Traces, History, Social Sciences, Software Narratology, Software Trace Analysis and History, Structural Memory Analysis and Social Sciences | No Comments »
Monday, February 13th, 2012
Any DA+TA source (dump artifact + trace artifact) can be used to generate and validate narrative fiction where memory dump components provide fiction structure and software trace components provide behaviour (plot and story):
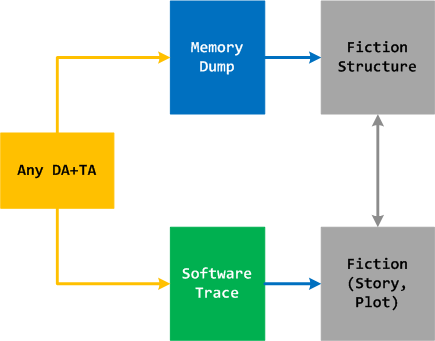
I already use such help in writing fiction books http://www.opentask.com/fiction-titles (”computational” novels) and use trace analysis patterns in validating historical narratives http://www.opentask.com/history-titles (with Excel and software trace viewers as tools). Here fiction is in no way different from software fictions outlined in the article about software stories. Please also note 2 other fields along with software narratology (SN was defined in mid 2009 where the first pattern appeared earlier in 2009) that are under development: software chorology and chorography. Adjoint threads and trace analysis patterns are the major contributions from SN.
Final note: Because we consider memory dumps in a general sense (e.g. philosophy of memoidealism where any data is a memory dump) and software trace narremes as small memory dumps (mid 2009) any data stream potentially can be represented as some fictional or real story. And vice versa, any story can be transformed into corresponding computer memory dumps and software traces (for example, the narralog language is being designed to model software stories).
- Dmitry Vostokov @ DumpAnalysis.org + TraceAnalysis.org -
Posted in Announcements, Fiction, General Memory Analysis, Memory Dump Fiction, Software Narrative Fiction, Software Narratology, Writing | No Comments »
Wednesday, September 21st, 2011
Memoretics as a science of memory snapshots borrows many ideas from the following disciplines (the list is not exhaustive):
- Troubleshooting and Debugging
- Intelligence Analysis
- Critical Thinking
- Forensics
- Linguistics
- Archaeology
- Psychoanalysis
- History
- Mathematics: Sets and Categories
- Literary Criticism and Narratology
It also contributes many ideas back. The following diagram depicts such an interaction:

- Dmitry Vostokov @ DumpAnalysis.org + TraceAnalysis.org -
Posted in Archaeology of Computer Memory, Categorical Debugging, Computer Forensics, Computer Science, Countefactual Debugging, Crash Dump Analysis, Crash Dump De-analysis, Crash Dump Patterns, Debugging, Debugging Methodology, Dublin School of Security, Education and Research, Escalation Engineering, General Memory Analysis, Generative Debugging, Hermeneutics of Memory Dumps and Traces, History, Intelligence Analysis Patterns, M->analysis, Malware Analysis, Malware Patterns, Mathematics of Debugging, Memiotics (Memory Semiotics), Memoretics, Memory Analysis Forensics and Intelligence, Memory Dump Analysis and History, Memory Systems Language, Memory Visualization, Metadefect Template Library, Metamalware, New Debugging School, Paleo-debugging, Pattern Models, Pattern Prediction, Psychoanalysis of Software Maintenance and Support, Psychology, Reverse Engineering, Root Cause Analysis, Science of Memory Dump Analysis, Science of Software Tracing, Security, Software Architecture, Software Behavior DNA, Software Behavior Patterns, Software Behavioral Genome, Software Chorography, Software Chorology, Software Defect Construction, Software Engineering, Software Narratology, Software Technical Support, Software Trace Analysis, Software Trace Analysis and History, Software Trace Deconstruction, Software Trace Linguistics, Software Trace Reading, Software Trace Visualization, Software Tracing Implementation Patterns, Software Troubleshooting Patterns, Software Victimology, Software and History, Structural Memory Analysis and Social Sciences, Structural Memory Patterns, Structural Trace Patterns, Systems Thinking, Testing, Tools, Trace Analysis Patterns, Troubleshooting Methodology, UI Problem Analysis Patterns, Unified Debugging Patterns, Victimware, Virtualization, Visual Dump Analysis, Workaround Patterns | No Comments »
Friday, June 3rd, 2011
Finally on the parallels between memory dump and software trace analysis and intelligence (Memoretics is a discipline that studies computer memory snapshots and their evolution in time):
Memoretics ”opens a unique window on” software “affairs”.
John H. Hedley, The Challenges of Intelligence Analysis, Strategic Intelligence, Volume 1
- Dmitry Vostokov @ DumpAnalysis.org + TraceAnalysis.org -
Posted in Bugtations, Crash Dump Analysis, Cyber Warfare, General Memory Analysis, Malware Analysis, Memory Analysis Forensics and Intelligence | No Comments »
Sunday, April 17th, 2011
I’m pleased to announce that MDAA, Volume 5 is available in PDF format:
www.dumpanalysis.org/Memory+Dump+Analysis+Anthology+Volume+5
It features:
- 25 new crash dump analysis patterns
- 11 new pattern interaction case studies (including software tracing)
- 16 new trace analysis patterns
- 7 structural memory patterns
- 4 modeling case studies for memory dump analysis patterns
- Discussion of 3 common analysis mistakes
- Malware analysis case study
- Computer independent architecture of crash analysis report service
- Expanded coverage of software narratology
- Metaphysical and theological implications of memory dump worldview
- More pictures of memory space and physicalist art
- Classification of memory visualization tools
- Memory visualization case studies
- Close reading of the stories of Sherlock Holmes: Dr. Watson’s observational patterns
- Fully cross-referenced with Volume 1, Volume 2, Volume 3, and Volume 4
Its table of contents is available here:
www.dumpanalysis.org/MDAA/MDA-Anthology-V5-TOC.pdf
Paperback and hardcover versions should be available in a week or two. I also started working on Volume 6 that should be available in November-December.
- Dmitry Vostokov @ DumpAnalysis.org + TraceAnalysis.org -
Posted in Aesthetics of Memory Dumps, Analysis Notation, Announcements, AntiPatterns, Archaeology of Computer Memory, Art, Assembly Language, Best Practices, Books, C and C++, CDF Analysis Tips and Tricks, Categorical Debugging, Citrix, Common Mistakes, Common Questions, Complete Memory Dump Analysis, Computer Forensics, Computer Science, Crash Analysis Report Environment (CARE), Crash Dump Analysis, Crash Dump De-analysis, Crash Dump Patterns, Crash Dumps for Dummies, Cyber Warfare, Debugging, Debugging Bureau, Debugging Industry, Debugging Methodology, Debugging Slang, Debugging Trends, Deep Down C++, Dr. Watson, Dublin School of Security, Education and Research, Escalation Engineering, Fun with Crash Dumps, Fun with Debugging, Fun with Software Traces, General Memory Analysis, Hermeneutics of Memory Dumps and Traces, Images of Computer Memory, Kernel Development, Malware Analysis, Mathematics of Debugging, Memiotics (Memory Semiotics), Memory Analysis Forensics and Intelligence, Memory Diagrams, Memory Dump Analysis Services, Memory Dumps in Myths, Memory Space Art, Memory Systems Language, Memory Visualization, Memory and Glitches, Metaphysics of Memory Worldview, Multithreading, Music for Debugging, New Acronyms, New Debugging School, New Words, Pattern Models, Philosophy, Physicalist Art, Publishing, Reverse Engineering, Science of Memory Dump Analysis, Science of Software Tracing, Security, Software Architecture, Software Behavior Patterns, Software Chorography, Software Chorology, Software Defect Construction, Software Engineering, Software Generalist, Software Maintenance Institute, Software Narratology, Software Technical Support, Software Trace Analysis, Software Trace Reading, Software Trace Visualization, Software Tracing for Dummies, Software Troubleshooting Patterns, Software Victimology, Structural Memory Patterns, Structural Trace Patterns, Systems Thinking, Testing, The Way of Philip Marlowe, Tools, Trace Analysis Patterns, Training and Seminars, Troubleshooting Methodology, Victimware, Vista, Webinars, WinDbg Scripting Extensions, WinDbg Scripts, WinDbg Tips and Tricks, WinDbg for GDB Users, Windows 7, Windows Server 2008, Windows System Administration, Workaround Patterns, x64 Windows | No Comments »
Friday, March 4th, 2011
This is another name for Memorianity (Memory Religion) that incorporates M->analysis techniques. I’m working now on the full statement of creed to be published soon. May you be memorized.
Dmitry Vostokov
Memoriarch
- Dmitry Vostokov @ Memory Religion Portal -
Posted in Announcements, Epistles from Memoriarch, General Memory Analysis, M->analysis, Memoidealism, Memory Religion (Memorianity), Philosophy, Religion | No Comments »
Thursday, March 3rd, 2011
Memory->analysis or M->analysis in short is a new pattern-driven psychotherapeutic method based on Unified Memory Theory (another name for Memory Worldview). It has a logo as well:

The name was inspired by M-theory and unified field theories. Please also see my interpretation of M-theory. Another name variant is M-analysis which can be used as a shortcut to M->analysis.
- Dmitry Vostokov @ DumpAnalysis.org + TraceAnalysis.org -
Posted in Announcements, General Memory Analysis, Intelligent Memory Movement, M->analysis, Memory Space Art, Metaphysics of Memory Worldview, Psychology | No Comments »
Friday, December 17th, 2010
As the new decade is approaching (2011-2020) we would like to make a few previews and predictions:
- Increased complexity of software will bring more methods from biological, social sciences and humanities in addition to existing methods of automated debugging and computer science techniques
- Focus on first fault software problem solving (when aspect)
- Focus on pattern-driven software problem solving (how aspect)
- Fusion of debugging and malware analysis into a unified structural and behavioral pattern framework
- Visual debugging, memory and software trace visualization techniques
- Software maintenance certification
- Focus on domain-driven troubleshooting and debugging tools as a service (debugware TaaS)
- Focus on security issues related to memory dumps and software traces
- New scripting languages and programming language extensions for debugging
- The maturation of the science of memory snapshots and software traces (memoretics)
Imagining is not not limited to the above and more to come and explain in the forthcoming parts.
- Dmitry Vostokov @ DumpAnalysis.org + TraceAnalysis.org -
Posted in Announcements, Anthropology, Archaeology of Computer Memory, Biology, Certification, Computer Science, Countefactual Debugging, Crash Analysis Report Environment (CARE), Crash Dump Analysis, Crash Dump Patterns, DebugWare Patterns, Debugging, Debugging Industry, Debugging Methodology, Debugging Trends, Dublin School of Security, EasyDbg, Economics, Escalation Engineering, Evolution, First Fault Problem Solving, Futuristic Memory Dump Analysis, General Memory Analysis, General Science, Geography, Hardware, Hermeneutics of Memory Dumps and Traces, History, Humanities, Language, Laws of Troubleshooting and Debugging, Logic, Malware Analysis, Malware Patterns, Mathematics of Debugging, Memiotics (Memory Semiotics), Memoretics, Memory Analysis Forensics and Intelligence, Memory Analysis Report System, Memory Dump Analysis and History, Memory Systems Language, Memory Visualization, Paleo-debugging, Pattern Models, Pattern Prediction, Physics, Psychology, Publishing, Science of Memory Dump Analysis, Science of Software Tracing, Security, Social Media, Social Sciences, Software Architecture, Software Behavior Patterns, Software Chorography, Software Chorology, Software Defect Construction, Software Engineering, Software Generalist, Software Maintenance Institute, Software Narrative Fiction, Software Narratology, Software Technical Support, Software Trace Analysis, Software Trace Analysis and History, Software Trace Deconstruction, Software Trace Linguistics, Software Trace Visualization, Software Troubleshooting Patterns, Software Victimology, Statistics, Structural Memory Analysis and Social Sciences, Structural Memory Patterns, Structural Trace Patterns, Systems Thinking, Testing, Tools, Trace Analysis Patterns, Troubleshooting Methodology, Unified Debugging Patterns, Uses of UML, Victimware, Virtualization, Visual Dump Analysis, Windows System Administration, Workaround Patterns | No Comments »
Friday, November 12th, 2010
Five volumes of cross-disciplinary Anthology (dubbed by the author “The Summa Memorianica”) lay the foundation of the scientific discipline of Memoretics (study of computer memory snapshots and their evolution in time) that is also called Memory Dump and Software Trace Analysis.ca
The 5th volume contains revised, edited, cross-referenced, and thematically organized selected DumpAnalysis.org blog posts about crash dump, software trace analysis and debugging written in February 2010 - October 2010 for software engineers developing and maintaining products on Windows platforms, quality assurance engineers testing software on Windows platforms, technical support and escalation engineers dealing with complex software issues, and security researchers, malware analysts and reverse engineers. The fifth volume features:
- 25 new crash dump analysis patterns
- 11 new pattern interaction case studies (including software tracing)
- 16 new trace analysis patterns
- 7 structural memory patterns
- 4 modeling case studies for memory dump analysis patterns
- Discussion of 3 common analysis mistakes
- Malware analysis case study
- Computer independent architecture of crash analysis report service
- Expanded coverage of software narratology
- Metaphysical and theological implications of memory dump worldview
- More pictures of memory space and physicalist art
- Classification of memory visualization tools
- Memory visualization case studies
- Close reading of the stories of Sherlock Holmes: Dr. Watson’s observational patterns
- Fully cross-referenced with Volume 1, Volume 2, Volume 3, and Volume 4
Product information:
- Title: Memory Dump Analysis Anthology, Volume 5
- Author: Dmitry Vostokov
- Language: English
- Product Dimensions: 22.86 x 15.24
- Paperback: 400 pages
- Publisher: Opentask (10 December 2010)
- ISBN-13: 978-1-906717-96-4
- Hardcover: 400 pages
- Publisher: Opentask (10 December 2010)
- ISBN-13: 978-1-906717-97-1

Back cover features memory space art image Hot Computation: Memory on Fire.
- Dmitry Vostokov @ DumpAnalysis.org + TraceAnalysis.org -
Posted in Aesthetics of Memory Dumps, Announcements, Archaeology of Computer Memory, Art, Assembly Language, Books, C and C++, CDF Analysis Tips and Tricks, Categorical Debugging, Common Mistakes, Complete Memory Dump Analysis, Computer Science, Crash Analysis Report Environment (CARE), Crash Dump Analysis, Crash Dump De-analysis, Crash Dump Patterns, Debugging, Debugging Methodology, Debugging Slang, Deep Down C++, Dr. Watson, Dublin School of Security, Education and Research, Escalation Engineering, Fun with Crash Dumps, Fun with Debugging, Fun with Software Traces, General Memory Analysis, Hermeneutics of Memory Dumps and Traces, Images of Computer Memory, Kernel Development, Malware Analysis, Malware Patterns, Mathematics of Debugging, Memiotics (Memory Semiotics), Memoidealism, Memoretics, Memory Analysis Culture, Memory Analysis Forensics and Intelligence, Memory Analysis Report System, Memory Diagrams, Memory Dreams, Memory Dump Analysis Jobs, Memory Dump Analysis Services, Memory Dump Analysis and History, Memory Dumps in Movies, Memory Dumps in Myths, Memory Religion (Memorianity), Memory Space Art, Memory Systems Language, Memory Visualization, Memory and Glitches, Memuonics, Metaphysical Society of Ireland, Minidump Analysis, Movies and Debugging, Multithreading, Museum of Debugging, Music for Debugging, Music of Computation, New Acronyms, New Words, Paleo-debugging, Pattern Models, Pattern Prediction, Philosophy, Physicalist Art, Psychoanalysis of Software Maintenance and Support, Publishing, Science of Memory Dump Analysis, Science of Software Tracing, Security, Software Architecture, Software Behavior Patterns, Software Chorography, Software Chorology, Software Defect Construction, Software Engineering, Software Generalist, Software Maintenance Institute, Software Narratology, Software Technical Support, Software Trace Analysis, Software Trace Analysis and History, Software Trace Deconstruction, Software Trace Reading, Software Trace Visualization, Software Tracing for Dummies, Software Troubleshooting Patterns, Software Victimology, Stack Trace Collection, Structural Memory Analysis and Social Sciences, Structural Memory Patterns, Structural Trace Patterns, Systems Thinking, Testing, Theology, Tool Objects, Tools, Trace Analysis Patterns, Training and Seminars, Troubleshooting Methodology, Uses of UML, Victimware, Virtualization, Vista, Visual Dump Analysis, Webinars, WinDbg Scripts, WinDbg Tips and Tricks, WinDbg for GDB Users, Windows 7, Windows Server 2008, Windows System Administration, Workaround Patterns, x64 Windows | No Comments »
Wednesday, November 10th, 2010
In order to promote memory dump worldview and associated philosophy of memoidealism we have founded a society with a mission to teach memory dump analysis to everyone.
Dmitry Vostokov
Director of Studies
- Dmitry Vostokov @ DumpAnalysis.org + TraceAnalysis.org -
Posted in Announcements, Education and Research, General Memory Analysis, Hermeneutics of Memory Dumps and Traces, Intelligent Memory Movement, Memoidealism, Memory Religion (Memorianity), Metaphysical Society of Ireland, Metaphysics of Memory Worldview, Philosophy, Theology | No Comments »
Friday, October 22nd, 2010
I detour for MARS expedition. You may also call it Memory Analysis Report System as malware analysis is always exploration of memory (in general). Why is this sudden change of course? After reading Gilles Deleuze I want to broaden the concept of “malware” and give it new orientation and direction of thinking. Beside that I also want new challenges after many years of research in pattern-driven memory dump and software trace analysis of abnormal software behaviour.
You may have also noticed small restructuring (rebranding) of this blog and DumpAnalysis.org headers.
See you there 
- Dmitry Vostokov @ DumpAnalysis.org + TraceAnalysis.org -
Posted in Announcements, Archaeology of Computer Memory, Assembly Language, Computer Science, Education and Research, General Memory Analysis, Malware Analysis, Malware Patterns, Memiotics (Memory Semiotics), Memoretics, Memory Analysis Forensics and Intelligence, Memory Analysis Report System, Memory Dump Analysis Services, New Acronyms, Philosophy, Science of Memory Dump Analysis, Science of Software Tracing, Security, Software Trace Analysis, Software Victimology, Structural Memory Patterns, Systems Thinking, Tools, Trace Analysis Patterns, Victimware, Windows System Administration | No Comments »
Tuesday, October 5th, 2010
The choice of webinars below mostly reflects my personal preferences and long time desire to speak on topics like systems thinking, troubleshooting tool design and development. The other topic about BSOD minidump analysis was requested by participants in an ongoing survey. There will be more topics in 2011. All forthcoming webinars will be hosted by Memory Dump Analysis Services. The planning list includes:
Systems Thinking in Memory Dump and Software Trace Analysis
Software Troubleshooting and Debugging Tools: Objects, Components, Patterns and Frameworks with UML
- UML basics
- DebugWare patterns
- Unified Troubleshooting Framework
- RADII software development process
- Hands-on exercise: designing and building a tool
Blue Screen Of Death Analysis Done Right: Minidump Investigation for System Administrators
- Making sense of !analyze –v output
- Get extra troubleshooting information with additional WinDbg commands
- Guessing culprits with raw stack analysis
- Who’s responsible: hardware or software?
- Checklist and patterns
- Including hands-on exercises: send your own minidumps
More detailed information will be available soon.
- Dmitry Vostokov @ DumpAnalysis.org + TraceAnalysis.org -
Posted in Announcements, CDF Analysis Tips and Tricks, Common Mistakes, Common Questions, Crash Analysis Report Environment (CARE), Crash Dump Analysis, Crash Dump De-analysis, Crash Dump Patterns, Crash Dumps for Dummies, DebugWare Patterns, Debugging, Debugging Industry, Debugging Methodology, Escalation Engineering, General Memory Analysis, Hermeneutics of Memory Dumps and Traces, Memory Systems Language, Minidump Analysis, Software Architecture, Software Behavior Patterns, Software Engineering, Software Technical Support, Software Trace Analysis, Software Tracing for Dummies, Structural Memory Patterns, Systems Thinking, Tools, Trace Analysis Patterns, Training and Seminars, Troubleshooting Methodology, Vista, Webinars, WinDbg Tips and Tricks, Windows 7, Windows Server 2008, Windows System Administration, x64 Windows | No Comments »
Monday, September 27th, 2010
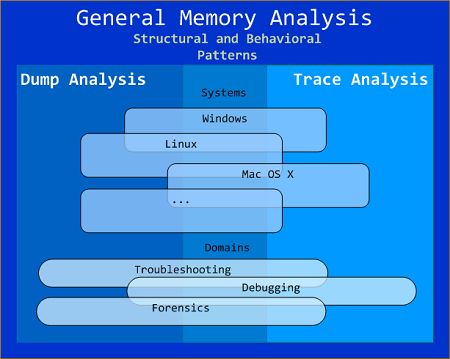
General Memory Analysis is another name for Memoretics, a discipline that studies memory snapshots including their similarities and differences on different system platforms such as Windows, Linus, Mac OS X, embedded and mobile systems, historical architectures, etc. The analysis of memory helps solve problems in various domains such as software troubleshooting and debugging, computer forensic analysis, etc.
The current focus of interdisciplinary research is to build a unified memory pattern language that covers both behavioral and structural patterns and also to study the possibility of building memory systems from below, not from requirements -> architecture -> design -> implementation -> compilation -> linking -> loading -> execution but from directly modeling and assembling memory systems using memory patterns.
- Dmitry Vostokov @ DumpAnalysis.org + TraceAnalysis.org -
Posted in Announcements, Crash Dump Analysis, Debugging, General Memory Analysis, Memiotics (Memory Semiotics), Memoretics, Memory Analysis Forensics and Intelligence, Memory Systems Language, Security, Software Behavior Patterns, Software Technical Support, Software Trace Analysis, Structural Memory Patterns, Trace Analysis Patterns | No Comments »
Friday, September 24th, 2010
Now it’s time to divide memory analysis patterns discerned so far as mostly abnormal software behavior memory dump and software trace patterns into behavioral and structural catalogues. The goal is to account for normal system-independent structural entities and relationships visible in memory like modules, threads, processes and so on.
The first pattern (and also a super-pattern) we discuss in this part is called Memory Snapshot. It is further subdivided into Structured Memory Snapshot and BLOB Memory Snapshot. Structured sub-pattern includes:
- Contiguous memory dump files with artificially generated headers (for example, physical or process virtual space memory dump)
- Software trace messages with imposed internal structure
BLOB sub-pattern variety includes address range snapshots without any externally imposed structure, for example, saved by .writemem WinDbg command or ReadProcessMemory API and contiguous buffer and raw memory dumps saved by various memory acquisition tools.
Behavioral patterns that relate to Memory Snapshot pattern are:
I strive initially to publish at least one such pattern every day to fill the gap of normal patterns in memory analysis and later add more multi-platform details and examples from other platforms like Linux, Mac OS X, embedded and selected important historical architectures.
- Dmitry Vostokov @ DumpAnalysis.org + TraceAnalysis.org -
Posted in Crash Dump Analysis, Crash Dump Patterns, Debugging, General Memory Analysis, Memiotics (Memory Semiotics), Memoretics, Memory Analysis Forensics and Intelligence, Memory Systems Language, Science of Memory Dump Analysis, Science of Software Tracing, Security, Software Behavior Patterns, Software Trace Analysis, Structural Memory Patterns | 1 Comment »