Archive for December, 2009
Thursday, December 31st, 2009
What will you do confronted with a one million trace messages recorded between 10:44:15 and 10:46:55 with an average trace statement current of 7,000 msg/s from dozens of modules and having a one sentence problem description? One solution is to try to search for a specific vocabulary relevant to the problem description, for example, if a problem is an intermittent re-authentication then we might try to search for a word “password” or a similar one drawn from a troubleshooting domain vocabulary. So it is useful to have a Vocabulary Index to search for. Hence, the same name of this pattern. In our trace example, the search for “password” jumps straight to a small activity region of authorization modules starting from the message number #180,010 and the last “password” occurrence is in the message #180,490 that narrows initial analysis region to just 500 messages. Note the similarity here between a book and its index and a trace as a software narrative and its vocabulary index.
- Dmitry Vostokov @ TraceAnalysis.org -
Posted in CDF Analysis Tips and Tricks, Debugging, Software Narratology, Software Trace Analysis, Trace Analysis Patterns | 1 Comment »
Wednesday, December 30th, 2009
Thanks to Sonny Mir who pointed to !filecache WinDbg command to diagnose low VACB (Virtual Address Control Block or View Address Control Block) conditions I was able to discern another Insufficient Memory pattern for control blocks in general. Certain system and subsystem architectures and designs may put a hard limit on the amount of data structures created to manage resources. If there is a dependency on such resources from other subsystems there could be starvation and blockage conditions resulting in a sluggish system behaviour, absence of a functional response and even in some cases a perceived system, service or application freeze.
7: kd> !filecache

***** Dump file cache******

  Reading and sorting VACBs ...

  Removed 0 nonactive VACBs, processing 1907 active VACBs …

File Cache Information

  Current size 408276 kb

  Peak size    468992 kb

  1907 Control Areas

[…]
I plan to add more insufficient control block case studies including user space.
- Dmitry Vostokov @ DumpAnalysis.org -
Posted in Crash Dump Analysis, Crash Dump Patterns, Debugging, Software Architecture, WinDbg Tips and Tricks | 1 Comment »
Sunday, December 27th, 2009
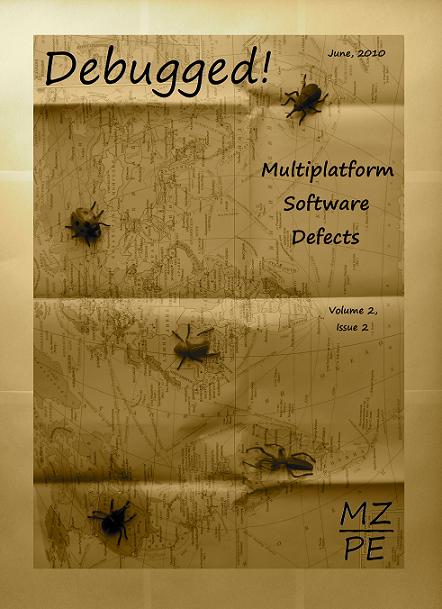
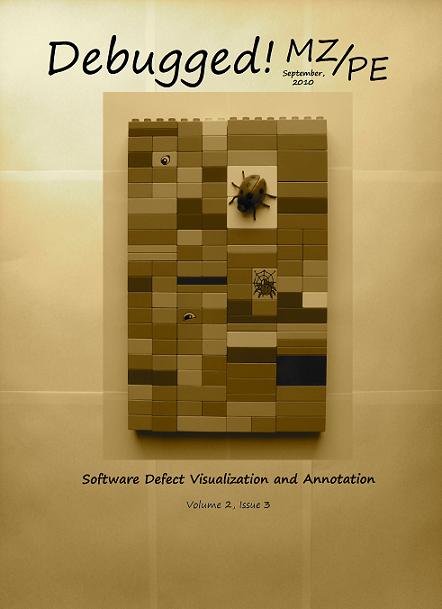
Main topics of Debugged! MZ/PE magazine issues for June and September 2010:
Debugged! MZ/PE: Multiplatform Software Defects, June, 2010 (Paperback, ISBN: 978-1906717902)
Debugged! MZ/PE: Software Defect Visualization and Annotation, September, 2010 (Paperback, ISBN: 978-1906717919)
Here are draft front covers designed today:
- Dmitry Vostokov @ DumpAnalysis.org -
Posted in Announcements, Books, Computer Science, Crash Dump Analysis, Debugged! MZ/PE, Debugging, Memory Visualization, Publishing, Software Engineering, Software Technical Support, Software Trace Analysis, Software Trace Visualization | No Comments »
Wednesday, December 23rd, 2009
See the greeting card on the portal together with New Year’s Eve code analysis puzzle:
DumpAnalysis.org Wishes Happy New Year 7DA!
- Dmitry Vostokov @ DumpAnalysis.org -
Posted in Announcements, Assembly Language, Code Reading, Crash Dump Analysis, Debugging, Fun with Crash Dumps, Games for Debugging, Software Engineering, Software Technical Support | No Comments »
Wednesday, December 23rd, 2009
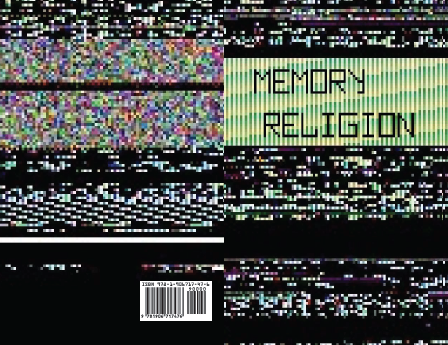
Memorianity soon to publish its Testament with 7 microkernel prophecies, childhood universal memory dump visions of its founder, the recollection of a conversion and other supporting materials. This full color scripture is small to carry around:
Title: Memory Religion: A Testament
ISBN-13: 978-1906717476
Pages: 24
The cover image is an allegorical interpretation of the concept of the Original Defect:
- Dmitry Vostokov @ Memory Religion Portal -
Posted in Announcements, Art, Books, Intelligent Memory Movement, Memorian Art, Memory Dreams, Memory Religion (Memorianity), Memory Space Art, Memory Visualization, New Words, Philosophy, Publishing | No Comments »
Wednesday, December 23rd, 2009
On the next day in Townley Hall library, after submitting Volume 3 of Memory Dump Analysis to print:


- Dmitry Vostokov @ DumpAnalysis.org -
Posted in Books, History, Publishing | 1 Comment »
Tuesday, December 22nd, 2009
This is a book I bought a few years ago and started reading immediately but put aside and only this summer read it fully from cover to cover. In order to appreciate its content you need some degree of mathematical and computer science maturity. For example, if you have never heard of his theorems and only read Incompleteness: The Proof and Paradox of Kurt Godel or similar popular book then you would have difficulty going through the book and it would appear boring. It is not an entertaining or bedside reading. This is why I put it aside on the first reading although I knew about this theorem since I read “Mathematics: The Loss of Certainty” more than 25 years ago being a schoolboy (in Russian translation). Just before writing this review I ordered “There’s Something About Godel: The Complete Guide to the Incompleteness Theorem” and the latter looks like less heavy reading judged from excerpts from its publisher website. Putting all these reminiscences aside I really enjoyed second reading of “Godel’s Theorem”. It really clarified some points from ¬B->¬A or PA & ¬Con(PA) perspectives and made me curious about fixpoints. I even borrowed the latter term and introduced them for crash dump analysis and debugging: “a dereference fixpoint”. I also liked chapters 4 and 6 about using Godel’s theorems outside mathematics and clarifying misconceptions in Rucker’s and Penrose’s books. However, after a few months I cannot recall anything definite what I read from that book although I felt good that I understood everything while reading so perhaps the book requires the 3rd reading for me  I’m going to give it another try after “There’s Something About Godel” and update this review.
Godel’s Theorem: An Incomplete Guide to Its Use and Abuse

- Dmitry Vostokov @ LiterateScientist.com -
Posted in From Cover To Cover, Logic, Mathematics, Philosophy, Reading List 2009, Reviewed on Amazon | No Comments »
Monday, December 21st, 2009
When looking at crash dumps it is good to keep an eye on new API that might surface on stack traces and in component relationships. Plan to order this book tomorrow and put my reading notes on Software Generalist blog:
Introducing Windows® 7 for Developers

- Dmitry Vostokov @ DumpAnalysis.org -
Posted in Books, Code Reading, Software Engineering, Windows 7 | No Comments »
Sunday, December 20th, 2009
a mad day - a day spent doing memory (dump) analysis and/or debugging
Examples: What a mad day! We had several blokes at a bobo address. Those events were rather sad.
- Dmitry Vostokov @ DumpAnalysis.org -
Posted in Crash Dump Analysis, Debugging, Debugging Slang, Fun with Crash Dumps, New Acronyms | No Comments »
Sunday, December 20th, 2009
“Memory dumps are facts.”
I’m very excited to announce that Volume 3 is available in paperback, hardcover and digital editions:
Memory Dump Analysis Anthology, Volume 3
Table of Contents
In two weeks paperback edition should also appear on Amazon and other bookstores. Amazon hardcover edition is planned to be available in January 2010.
The amount of information was so voluminous that I had to split the originally planned volume into two. Volume 4 should appear by the middle of February together with Color Supplement for Volumes 1-4.
- Dmitry Vostokov @ DumpAnalysis.org -
Posted in .NET Debugging, Aesthetics of Memory Dumps, Announcements, AntiPatterns, Art, Assembly Language, Books, Bugtations, C and C++, CDA Pattern Classification, CDF Analysis Tips and Tricks, Certification, Citrix, Code Reading, Common Mistakes, Computer Science, Crash Dump Analysis, Crash Dump Patterns, Crash Dumps for Dummies, DebugWare Patterns, Debugging, Debugging Slang, Deep Down C++, Education and Research, Escalation Engineering, Fun with Crash Dumps, Hardware, Horrors of Computation, Kernel Development, Mathematics of Debugging, Memiotics (Memory Semiotics), Memoidealism, Memoretics, Memory Analysis Culture, Memory Analysis Forensics and Intelligence, Memory Space Art, Memory Visualization, Minidump Analysis, Multithreading, Philosophy, Poetry, Publishing, Science of Memory Dump Analysis, Science of Software Tracing, Security, Software Architecture, Software Defect Construction, Software Engineering, Software Narratology, Software Technical Support, Software Trace Analysis, Software Trace Visualization, Software Tracing for Dummies, Software Victimology, Stack Trace Collection, Testing, Tools, Trace Analysis Patterns, Training and Seminars, Troubleshooting Methodology, Victimware, Virtualization, Vista, Visual Dump Analysis, WinDbg Scripts, WinDbg Tips and Tricks, WinDbg for GDB Users, Windows 7, Windows Server 2008, Windows System Administration | 1 Comment »
Friday, December 18th, 2009
I read this book in just one day from cover to cover. I’m not a professional biologist and learnt about evolution 25 - 30 years ago from Marxist perspective. My understanding of evolution has greatly improved this year after reading Darwin’s Dangerous Idea, This Is Biology, Breaking the Spell, Evolution: The First Four Billion Years and The 10,000 Year Explosion books. I’ve also started reading (and listening to its unabridged version on CDs simultaneously) the latest Dawkins’ book “The Greatest Show on Earth” (to be reviewed as soon as I finish) after the thought “Who’s that guy?” finally tipped. I noticed the partnership of D. Dennett and R. Dawkins when reading books and also rants from religious camps when reading reviews. So I was very keen to read the promised history of Dawkins thought in “The Selfish Genius” book and I really enjoyed it. Judged from the background knowledge I acquired while reading various books about evolution “The Selfish Genius” seems fair and balanced. Sometimes it reminded me the similar problem in Physics: String Theory vs. Others (Not Even Wrong and the Trouble With Physics). When I put “The Selfish Genius” and resumed reading “The Greatest Show on Earth” I immediately noticed a footnote on page 216 (ISBN 978-1-4165-9478-9): “epigenetics, a modish buzz-word now enjoying its fifteen minutes” and if you are curious about the source of this anger read “The Selfish Genius” book. I also like the point of the book that for different people with different backgrounds “Evolution” means different things. For me it is about evolution of software but mainly about evolution of software defects: Darwinian Debugging and I even bugtated Dawkins’ meme: Bugtation No.108.
The Selfish Genius: How Richard Dawkins Rewrote Darwin’s Legacy

- Dmitry Vostokov @ LiterateScientist.com -
Posted in Biology, Evolution, From Cover To Cover, History, Reading List 2009, Reviewed on Amazon | No Comments »
Friday, December 18th, 2009
I propose to celebrate it on 08.08 every year starting from The Year of Dump Analysis, 2010, 7DA at 8:00 (I prefer 8pm for MAD Day, moderation is important in debugging too).
What do you think? If you count things from 0 or favour user space there is an alternative date: 07.07
- Dmitry Vostokov @ DumpAnalysis.org -
Posted in Announcements, Crash Dump Analysis, Debugging, Software Engineering, Software Technical Support | 1 Comment »
Thursday, December 17th, 2009
A kernel dump from a frozen system shows an executive resource wait chain:
0: kd> !locks

[...]

Resource @ driverA!Resource (0xf58de4e0)    Exclusively owned

    Contention Count = 4411

    NumberOfExclusiveWaiters = 11

     Threads: 86d14ae8-01<*>

     Threads Waiting On Exclusive Access:

              8a788db0       8750e970       86c568a0       897ed428

              86e34db0       86ca8ac0       86b22020       86fef5d8

              872abdb0       86d16750       87b55830

[…]
The blocking thread 86d14ae8 had been blocked waiting for a notification event for more than 2 hours:
0: kd> !thread 86d14ae8 1f

THREAD 86d14ae8  Cid 0004.29c4  Teb: 00000000 Win32Thread: 00000000 WAIT: (Unknown) KernelMode Non-Alertable

    b81e7adc  NotificationEvent

Not impersonating

DeviceMap                 e1001830

Owning Process            8a78b020       Image:         System

Attached Process          N/A            Image:         N/A

Wait Start TickCount      8378144        Ticks: 503606 (0:02:11:08.843)

Context Switch Count      1016

UserTime                  00:00:00.000

KernelTime                00:00:00.015

Start Address driverA!WorkerThreadDispatcher (0xf596ea0e)

Stack Init b81e8000 Current b81e7a2c Base b81e8000 Limit b81e5000 Call 0

Priority 14 BasePriority 10 PriorityDecrement 4

ChildEBP RetAddr

b81e7a44 8083d5b1 nt!KiSwapContext+0×26

b81e7a70 8083df9e nt!KiSwapThread+0×2e5

b81e7ab8 f59d374d nt!KeWaitForSingleObject+0×346

[…]

b81e7b48 f59b9289 driverB!TcpDisconnect+0×42

[…]

b81e7c40 f595a8a5 nt!IofCallDriver+0×45

b81e7c48 f595ba1e driverA!SubmitTdiRequestNoWait+0×28

[…]

b81e7dac 80920833 driverA!WorkerThreadDispatcher+0×1a

b81e7ddc 8083fe9f nt!PspSystemThreadStartup+0×2e

00000000 00000000 nt!KiThreadStartup+0×16
We see that the wait happens after requesting a TCP disconnect so we check the list of IRP to see if there is any distribution anomaly among pending IRP:
0: kd> !irpfind

  Irp    [ Thread ] irpStack: (Mj,Mn)   DevObj  [Driver]         MDL Process

[...]

86c68d98 [88d2bdb0] irpStack: ( f, 6)  89cb5ea8 [ \Driver\Tcpip]

86c6a5c0 [89b118c0] irpStack: ( f, 6)  89cb5ea8 [ \Driver\Tcpip]

86c6b008 [87564b40] irpStack: ( f, 6)  89cb5ea8 [ \Driver\Tcpip]

86c6caf0 [89c75bb0] irpStack: ( f, 6)  89cb5ea8 [ \Driver\Tcpip]

86c7bb28 [89c75bb0] irpStack: ( f, 6)  89cb5ea8 [ \Driver\Tcpip]

86c7bd98 [8753ddb0] irpStack: ( f, 6)  89cb5ea8 [ \Driver\Tcpip]

86c80008 [88d7b378] irpStack: ( f, 6)  89cb5ea8 [ \Driver\Tcpip]

86c80590 [88e1c368] irpStack: ( f, 6)  89cb5ea8 [ \Driver\Tcpip]

86c845a8 [89d2b400] irpStack: ( f, 6)  89cb5ea8 [ \Driver\Tcpip]

86c84b80 [88d7b378] irpStack: ( f, 6)  89cb5ea8 [ \Driver\Tcpip]

86c86008 [88e1c368] irpStack: ( f, 6)  89cb5ea8 [ \Driver\Tcpip]

86c86688 [86d9a788] irpStack: ( f, 6)  89cb5ea8 [ \Driver\Tcpip]

86c86d98 [88d2bdb0] irpStack: ( f, 6)  89cb5ea8 [ \Driver\Tcpip]

86c87990 [88e1c368] irpStack: ( f, 6)  89cb5ea8 [ \Driver\Tcpip]

86c8b640 [8757c3f0] irpStack: ( f, 6)  89cb5ea8 [ \Driver\Tcpip]

86c8f368 [89c75bb0] irpStack: ( f, 6)  89cb5ea8 [ \Driver\Tcpip]

86c8f650 [88d66db0] irpStack: ( f, 6)  89cb5ea8 [ \Driver\Tcpip]

86c92590 [87625c30] irpStack: ( f, 6)  89cb5ea8 [ \Driver\Tcpip]

86c92bc8 [89c75bb0] irpStack: ( f, 6)  89cb5ea8 [ \Driver\Tcpip]

86c94008 [8757c3f0] irpStack: ( f, 6)  89cb5ea8 [ \Driver\Tcpip]

86c94318 [89c75bb0] irpStack: ( f, 6)  89cb5ea8 [ \Driver\Tcpip]

86c9a308 [89c75bb0] irpStack: ( f, 6)  89cb5ea8 [ \Driver\Tcpip]

86c9e008 [88d66db0] irpStack: ( f, 6)  89cb5ea8 [ \Driver\Tcpip]

86c9e308 [89d2b400] irpStack: ( f, 6)  89cb5ea8 [ \Driver\Tcpip]

86ca0350 [87638020] irpStack: ( f, 6)  89cb5ea8 [ \Driver\Tcpip]

86ca0870 [88d66db0] irpStack: ( f, 6)  89cb5ea8 [ \Driver\Tcpip]

86ca0b28 [88d66db0] irpStack: ( f, 6)  89cb5ea8 [ \Driver\Tcpip]

86ca0d98 [86db0db0] irpStack: ( f, 6)  89cb5ea8 [ \Driver\Tcpip]

86ca4918 [88d66db0] irpStack: ( f, 6)  89cb5ea8 [ \Driver\Tcpip]

86ca6878 [87564b40] irpStack: ( f, 6)  89cb5ea8 [ \Driver\Tcpip]

86caa458 [88d7b378] irpStack: ( f, 6)  89cb5ea8 [ \Driver\Tcpip]

86cacc20 [86d4fb40] irpStack: ( f, 6)  89cb5ea8 [ \Driver\Tcpip]

86cb0818 [89c75bb0] irpStack: ( f, 6)  89cb5ea8 [ \Driver\Tcpip]

86cb3658 [87638020] irpStack: ( f, 6)  89cb5ea8 [ \Driver\Tcpip]

86cb9d98 [88d66db0] irpStack: ( f, 6)  89cb5ea8 [ \Driver\Tcpip]

[…]
Indeed, we see a high disproportion of TCP I/O requests (many hundreds) after exporting command output to Excel:
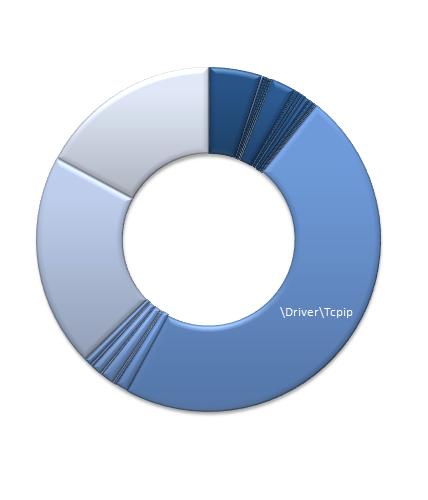
We check all stack traces and see one system thread trying to clean TCP connection blocked for almost the same time (more than 2 hours):
0: kd> !stacks

Proc.Thread  .Thread  Ticks   ThreadState Blocker

                            [8a78b020 System]

[...]

   4.00268c  870cf768 00765bd Blocked    tcpip!TCPCleanup+0xcf

[…]
0: kd> !whattime  00765bd

484797 Ticks in Standard Time:   2:06:14.953s
0: kd> !thread 870cf768 1f

THREAD 870cf768  Cid 0004.268c  Teb: 00000000 Win32Thread: 00000000 WAIT: (Unknown) KernelMode Non-Alertable

    870a01f4  SynchronizationEvent

IRP List:

    8726fb00: (0006,0268) Flags: 00000404  Mdl: 00000000

Not impersonating

DeviceMap                 e1001830

Owning Process            8a78b020       Image:         System

Attached Process          N/A            Image:         N/A

Wait Start TickCount      8396953        Ticks: 484797 (0:02:06:14.953)

Context Switch Count      537

UserTime                  00:00:00.000

KernelTime                00:00:00.000

Start Address nt!ExpWorkerThread (0×8082da4b)

Stack Init b87b0000 Current b87afa18 Base b87b0000 Limit b87ad000 Call 0

Priority 15 BasePriority 15 PriorityDecrement 0

ChildEBP RetAddr

b87afa30 8083d5b1 nt!KiSwapContext+0×26

b87afa5c 8083df9e nt!KiSwapThread+0×2e5

b87afaa4 f5a9f9a6 nt!KeWaitForSingleObject+0×346

b87afaf0 f5a96a9d tcpip!TCPCleanup+0xcf

b87afb2c 80840153 tcpip!TCPDispatch+0×10c

b87afb40 f75eb817 nt!IofCallDriver+0×45

WARNING: Stack unwind information not available. Following frames may be wrong.

b87afb64 f75e8698 driverC!DispatchPassThrough+0×4c

[…]

b87afbcc 8092ec0a nt!IofCallDriver+0×45

b87afbfc 8092b6af nt!IopCloseFile+0×2ae

b87afc2c 8092b852 nt!ObpDecrementHandleCount+0xcc

b87afc54 8092b776 nt!ObpCloseHandleTableEntry+0×131

b87afc98 8092b7c1 nt!ObpCloseHandle+0×82

b87afca8 80833bdf nt!NtClose+0×1b

b87afca8 8083b00c nt!KiFastCallEntry+0xfc (TrapFrame @ b87afcb4)

b87afd24 f59d3a3a nt!ZwClose+0×11

b87afd3c f59b78a1 driverB!TdiCloseConnection+0×38

[…]

b87afdac 80920833 nt!ExpWorkerThread+0xeb

b87afddc 8083fe9f nt!PspSystemThreadStartup+0×2e

00000000 00000000 nt!KiThreadStartup+0×16
- Dmitry Vostokov @ DumpAnalysis.org -
Posted in Crash Dump Analysis, Crash Dump Patterns | No Comments »
Thursday, December 17th, 2009
Completely mutated Richard Dawkins‘ quotation after listening to his latest book “The Greatest Show on Earth” and reading Fern Elsdon-Baker’s book “The Selfish Genius”:
“Memory dumps are facts”.
Dmitry Vostokov’s statement upon hearing “Evolution is a fact.”
No offence to Dawkins’ camp, watch out the publication of the next issue of Debugged! magazine about systematics and evolution of software defects:
Darwinian Debugging
- Dmitry Vostokov @ DumpAnalysis.org -
Posted in Bugtations, Debugged! MZ/PE, Fun with Crash Dumps | 1 Comment »
Thursday, December 17th, 2009
Previously announced Software Maintenance Institute was finally registered in Ireland (Reg. No. 400906) and its certificate was received yesterday.
Here is the current component structure of various institutions (depicted in UML):
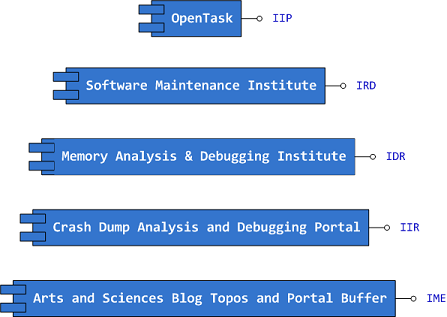
Interface Tags:
IIP Interface of Iterative Publishing

IRD Interface of Research and Development

IDR Interface of Defect Research

IIR Interface of Information Repository

IME Interface of Memetic Engineering
- Dmitry Vostokov @ DumpAnalysis.org -
Posted in Announcements, Art, Certification, Computer Science, Crash Dump Analysis, Debugging, Education and Research, Escalation Engineering, History, Memiotics (Memory Semiotics), Memoidealism, Memoretics, Memory Analysis Culture, Memory Analysis Forensics and Intelligence, Memory Auralization, Memory Visualization, Philosophy, Publishing, Science of Memory Dump Analysis, Science of Software Tracing, Security, Software Architecture, Software Engineering, Software Maintenance Institute, Software Technical Support, Software Trace Analysis, Software Victimology, Testing, Training and Seminars | No Comments »
Wednesday, December 16th, 2009
Finally, after the long delay, the issue is available in print on Amazon and through other sellers:
Debugged! MZ/PE: Software Tracing

- Dmitry Vostokov @ DumpAnalysis.org -
Posted in Announcements, Books, CDF Analysis Tips and Tricks, Computer Science, Crash Dump Analysis, Crash Dump Patterns, Debugged! MZ/PE, Debugging, Education and Research, Fun with Crash Dumps, Memoretics, Memory Visualization, Publishing, Science of Memory Dump Analysis, Science of Software Tracing, Software Technical Support, Software Trace Analysis, Software Trace Visualization, Testing, Tools, Trace Analysis Patterns, Training and Seminars, Troubleshooting Methodology, Visual Dump Analysis | 1 Comment »
Wednesday, December 9th, 2009
In its simplest form the first law of troubleshooting and debugging states that:
The more frequent a problem is, the simpler tool is needed to resolve and fix it.
- Dmitry Vostokov @ DumpAnalysis.org -
Posted in Announcements, Bugtations, DebugWare Patterns, Debugging, Laws of Troubleshooting and Debugging, Software Technical Support, Tools, Troubleshooting Methodology | No Comments »
Wednesday, December 9th, 2009
Some parallels can be seen between the MAP feature of memoidealistic philosophy and ātman in Hindu philosophy situating both inside an individual and Universe.
- Dmitry Vostokov @ DumpAnalysis.org -
Posted in Memoidealism, Metaphysics of Memory Worldview, Philosophy | 1 Comment »
Wednesday, December 9th, 2009
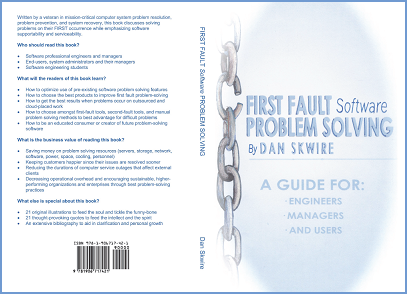
I’m very pleased to announce that Dan Skwire’s unique book has been published by OpenTask:
First Fault Software Problem Solving: A Guide for Engineers, Managers and Users
- Dmitry Vostokov @ DumpAnalysis.org -
Posted in Announcements, Books, Escalation Engineering, First Fault Problem Solving, Publishing, Software Engineering, Software Technical Support, Tools, Troubleshooting Methodology | 1 Comment »
Tuesday, December 8th, 2009
This is another description of a memoidealistic philosophical worldview that memory exists in everything, living and nonliving. In its even stronger form, panmemorism is also a theory that memory is a part of itself, thus adding an infinite element (see Memoidealism as Monistic Aspect Pluralism for some illustrations) and providing a foundation for perceived processes.
- Dmitry Vostokov @ DumpAnalysis.org -
Posted in Memoidealism, Memory Religion (Memorianity), New Words, Philosophy | 1 Comment »