Archive for the ‘Software Behavior Patterns’ Category
Saturday, January 12th, 2013
These are not really testing patterns but patterns of a user or program behaviour resulting in abnormalities such as colored screens (blue and grey), crash dumps and other support artefacts including performance alerts and UI problem patterns. The first such pattern is called Space Precondition. It is often a case that a process checks for free disk space before proceeding, for example, with updates. This precondition may be violated by a user filling disk after the check but before or during installation. Such was the case with our recent Mac OS X update where we did some copying in the background while the update was downloaded that resulted in insufficient space after reboot, then a grey screen after that and subsequent disk corruption and finally reinstalling OS and loss of several hours better spent with other pattern categories.
- Dmitry Vostokov @ DumpAnalysis.org + TraceAnalysis.org -
Posted in Mac Crash Corner, Mac OS X, Software Behavior Patterns, Software Disruption Patterns, Testing, UI Problem Analysis Patterns, x64 Mac OS X | 1 Comment »
Friday, January 11th, 2013
Static program analysis is used to eliminate certain coding errors that may lead to abnormal software behaviour. So it is naturally a part of software diagnostics but at source code level. Our goal here is to identify certain patterns directly linkable to patterns we see in memory dumps and software logs and collect them into a catalog. One such pattern candidate is called Loop Construct. It covers conditional and unconditional loops, for example, in one of modern languages:
extern bool soonToBeTrue;
int mediumValue = ...;
while (true)

{

  TRACE("Waiting");

  sleep(mediumValue);

  if (soonToBeTrue)

  {

    break;

  }

  doHeavyWork();

}
while (--pControl->aFewPasses)

{

  TRACE("Waiting");

  sleep(mediumValue);

  doHeavyWork();

}
Such loops may potentially lead to Spiking Thread memory dump analysis and High Message Current and Density trace analysis patterns. Of course, we shouldn’t suspect every loop but only some that have potential to be altered by Local Buffer Overflow (for mediumValue) or Shared Buffer Overwrite (for Control.aFewPasses) or by a race condition (soonToBeTrue).
We expect things to get more interesting when we start associating source code that uses certain API with patterns of abnormal behavior.
- Dmitry Vostokov @ DumpAnalysis.org + TraceAnalysis.org -
Posted in C and C++, Code Reading, Core Dump Analysis, Crash Dump Analysis, Crash Dump Patterns, Debugging, Security, Software Behavior Patterns, Software Diagnostics, Software Trace Analysis, Static Code Analysis Patterns, Trace Analysis Patterns, Victimware Analysis | No Comments »
Sunday, September 23rd, 2012
Learn from this Webinar about phenomenological, hermeneutical and analytical approaches to software diagnostics and its knowledge, foundations, norms, theories, logic, methodology, language, ontology, nature and truth. This seminar is hosted by Software Diagnostics Services.

Title: Introduction to Philosophy of Software Diagnostics
Date: 17th of December, 2012
Time: 19:00 GMT
Duration: 60 minutes
Space is limited.
Reserve your Webinar seat now at:
https://www3.gotomeeting.com/register/872846486
- Dmitry Vostokov @ DumpAnalysis.org + TraceAnalysis.org -
Posted in Announcements, Computer Science, Core Dump Analysis, Crash Dump Analysis, Crash Dump Patterns, Debugging, Debugging Methodology, Education and Research, Escalation Engineering, First Fault Software Diagnostics, Hermeneutics of Memory Dumps and Traces, Logic, Memiotics (Memory Semiotics), Memoretics, Memory Dump Analysis Methodology, Performance Monitoring, Phenomenology of Software Diagnostics, Philosophy, Philosophy of Software Diagnostics, Root Cause Analysis, Science of Memory Dump Analysis, Science of Software Tracing, Semiotics, Software Behavior Patterns, Software Diagnostics, Software Diagnostics Institute, Software Diagnostics Pattern Language, Software Diagnostics Patterns, Software Diagnostics Services, Software and Philosophy, Systems Theory, Systems Thinking, Testing, The Way of Philip Marlowe, Trace Analysis Patterns, Unified Software Diagnostics, Webinars | No Comments »
Sunday, September 9th, 2012
We continue with such problem pattern category and discuss Unresponsive Window pattern. The previous one was Error Message Box. We all see hang windows from time to time. This can happen, for example, from a main thread blocked in a wait chain. Some windows become unresponsive only temporary, for example, when a window message loop results in a CPU intensive window procedure code path. When I open large WinDbg logs generated by WinDbg scripts running on a complete memory dump in Notepad it opens up a frozen window for some seconds and sometimes for a minute or two. To get an unresponsive window for a longer time I opened a PDF file with a size of a few MB and I attached WinDbg. I got this stack trace:
0:000> k

Child-SP          RetAddr           Call Site

00000000`001ecce0 000007fe`ff9fdf89 USP10!otlCacheManager::GetNextLookup+0x12a

00000000`001ecd40 000007fe`ff9fa134 USP10!ApplyFeatures+0x489

00000000`001ed000 000007fe`ff9e1600 USP10!SubstituteOtlGlyphs+0x224

00000000`001ed0b0 000007fe`ff9d4b60 USP10!GenericEngineGetGlyphs+0x1000

00000000`001ed450 000007fe`ff9989c5 USP10!ShlShape+0x7a0

00000000`001ed670 000007fe`ff9a7363 USP10!ScriptShape+0x205

00000000`001ed710 000007fe`ff9a8ac9 USP10!RenderItemNoFallback+0x433

00000000`001ed7d0 000007fe`ff9a8d86 USP10!RenderItemWithFallback+0x129

00000000`001ed820 000007fe`ff9aa5f7 USP10!RenderItem+0x36

00000000`001ed870 000007fe`ff99b2c9 USP10!ScriptStringAnalyzeGlyphs+0x277

00000000`001ed910 000007fe`ff30285c USP10!ScriptStringAnalyse+0x399

00000000`001ed990 000007fe`ff3031c1 LPK!EditStringAnalyse+0x1d4

00000000`001eda70 000007fe`fc876c05 LPK!EditCchInWidth+0x4e

00000000`001edad0 000007fe`fc85862e COMCTL32!EditML_BuildchLines+0x221

00000000`001edba0 000007fe`fc878f56 COMCTL32!Edit_ResetTextInfo+0x82

00000000`001edbe0 000007fe`fc85a566 COMCTL32!EditML_WndProc+0x456

00000000`001edcd0 00000000`77a19bd1 COMCTL32!Edit_WndProc+0xe0a

00000000`001edd70 00000000`77a16aa8 USER32!UserCallWinProcCheckWow+0x1ad

00000000`001ede30 00000000`77a16bad USER32!SendMessageWorker+0x682

00000000`001edec0 00000000`ff7f4256 USER32!SendMessageW+0x5c

00000000`001edf10 00000000`ff7f43d6 NOTEPAD!LoadFile+0x7cb

00000000`001ee260 00000000`ff7f1018 NOTEPAD!NPInit+0x802

00000000`001efbb0 00000000`ff7f133c NOTEPAD!WinMain+0xc7

00000000`001efc30 00000000`7764652d NOTEPAD!DisplayNonGenuineDlgWorker+0x2da

00000000`001efcf0 00000000`77b2c521 kernel32!BaseThreadInitThunk+0xd

00000000`001efd20 00000000`00000000 ntdll!RtlUserThreadStart+0x1d
Another notepad.exe instance had this similar stack trace:
0:000> k

Child-SP          RetAddr           Call Site

00000000`0015ca60 000007fe`ff9e2152 USP10!ShapingLibraryInternal::RestoreCharMap+0x12

00000000`0015cab0 000007fe`ff9d80b8 USP10!GenericEngineGetGlyphPositions+0x2a2

00000000`0015ce60 000007fe`ff9d548e USP10!ShapingGetGlyphPositions+0x8c8

00000000`0015d030 000007fe`ff998c72 USP10!ShlPlace+0x2de

00000000`0015d1e0 000007fe`ff9a742d USP10!ScriptPlace+0x1f2

00000000`0015d270 000007fe`ff9a8ac9 USP10!RenderItemNoFallback+0x4fd

00000000`0015d330 000007fe`ff9a8d86 USP10!RenderItemWithFallback+0x129

00000000`0015d380 000007fe`ff9aa5f7 USP10!RenderItem+0x36

00000000`0015d3d0 000007fe`ff99b2c9 USP10!ScriptStringAnalyzeGlyphs+0x277

00000000`0015d470 000007fe`ff30285c USP10!ScriptStringAnalyse+0x399

00000000`0015d4f0 000007fe`ff3031c1 LPK!EditStringAnalyse+0x1d4

00000000`0015d5d0 000007fe`fc876c05 LPK!EditCchInWidth+0x4e

00000000`0015d630 000007fe`fc85862e COMCTL32!EditML_BuildchLines+0x221

00000000`0015d700 000007fe`fc878f56 COMCTL32!Edit_ResetTextInfo+0x82

00000000`0015d740 000007fe`fc85a566 COMCTL32!EditML_WndProc+0x456

00000000`0015d830 00000000`77a19bd1 COMCTL32!Edit_WndProc+0xe0a

00000000`0015d8d0 00000000`77a16aa8 USER32!UserCallWinProcCheckWow+0x1ad

00000000`0015d990 00000000`77a16bad USER32!SendMessageWorker+0x682

00000000`0015da20 00000000`ff7f4256 USER32!SendMessageW+0x5c

00000000`0015da70 00000000`ff7f43d6 NOTEPAD!LoadFile+0×7cb

00000000`0015ddc0 00000000`ff7f1018 NOTEPAD!NPInit+0×802

00000000`0015f710 00000000`ff7f133c NOTEPAD!WinMain+0xc7

00000000`0015f790 00000000`7764652d NOTEPAD!DisplayNonGenuineDlgWorker+0×2da

00000000`0015f850 00000000`77b2c521 kernel32!BaseThreadInitThunk+0xd

00000000`0015f880 00000000`00000000 ntdll!RtlUserThreadStart+0×1d
This thread is also spiking and all work was done in a Unicode script processor as the PDF file was obviously not an ASCII text file:
0:000> !runaway f

User Mode Time

Thread       Time

0:fa0       0 days 0:00:12.402

Kernel Mode Time

Thread       Time

0:fa0       0 days 0:00:10.826

Elapsed Time

Thread       Time

0:fa0       0 days 0:00:34.654
0:000> lmv m USP10

start             end                 module name

000007fe`ff990000 000007fe`ffa59000   USP10      (pdb symbols)          c:\mss\usp10.pdb\DB4EC1196F91457FBB0A462D9D0AFEC31\usp10.pdb

Loaded symbol image file: C:\Windows\system32\USP10.dll

Image path: C:\Windows\system32\USP10.dll

Image name: USP10.dll

Timestamp:        Sat Nov 20 13:15:33 2010 (4CE7C9F5)

CheckSum:         000C4B61

ImageSize:        000C9000

File version:     1.626.7601.17514

Product version:  1.626.7601.17514

File flags:       0 (Mask 3F)

File OS:          40004 NT Win32

File type:        2.0 Dll

File date:        00000000.00000000

Translations:     0409.04b0

CompanyName:      Microsoft Corporation

ProductName:      Microsoft(R) Uniscribe Unicode script processor

InternalName:     Uniscribe

OriginalFilename: Uniscribe

ProductVersion:   1.0626.7601.17514

FileVersion:      1.0626.7601.17514 (win7sp1_rtm.101119-1850)

FileDescription:  Uniscribe Unicode script processor

LegalCopyright:   © Microsoft Corporation. All rights reserved.
We see LoadFile function and find a file name from execution residue on the raw stack:
0:000> dpu 00000000`0015da70

00000000`0015da70  00000000`00000000

00000000`0015da78  00000000`00000000

00000000`0015da80  00000000`00000000

00000000`0015da88  00000000`00000000

00000000`0015da90  00000000`02b40040 "%PDF-1.4..%µµµµ..1 0 obj..<</Type/Catalog/Pages 2 0 R/L"

00000000`0015da98  00000000`00576a62

00000000`0015daa0  00000000`00000000

00000000`0015daa8  00000000`00000000

00000000`0015dab0  00000000`025c0000

00000000`0015dab8  00000000`00000000

00000000`0015dac0  00000000`00000000

00000000`0015dac8  00000000`00000100

00000000`0015dad0  00000000`00000000

00000000`0015dad8  00000000`025c0000

00000000`0015dae0  00000000`00000265

00000000`0015dae8  00000000`ff800b40 "C:\DL\History-Russian-Literature-VIII-Volume2.pdf"

[...]
- Dmitry Vostokov @ DumpAnalysis.org + TraceAnalysis.org -
Posted in Crash Dump Analysis, Crash Dump Patterns, Software Behavior Patterns, UI Problem Analysis Patterns, x64 Windows | No Comments »
Thursday, July 19th, 2012
After some thinking I’ve decided to apply software trace analysis pattern approach to network trace analysis which lacks a unified pattern language. Here I consider a network trace as essentially a software trace where packet headers represent software trace messages coupled with associated transmitted data:
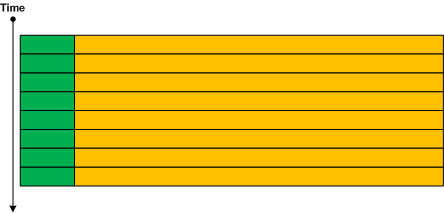
Since we have a trace message stream formatted by a network trace visualization tool we can apply most if not all trace analysis patterns for diagnostics including software narratology for interpretation, discourse and different representations. We provide a few trivial examples here and more in subsequent parts. The first example is Discontinuity pattern:
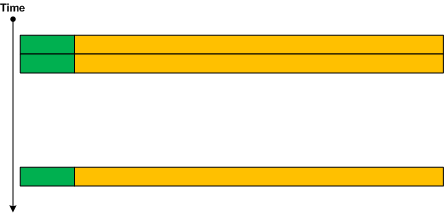
Other similar patterns are No Activity, Truncated Trace and Time Delta. The second example is Anchor Messages:
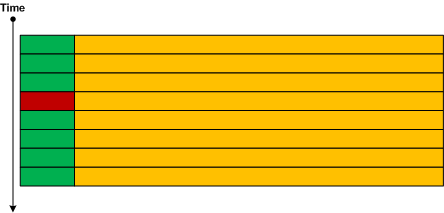
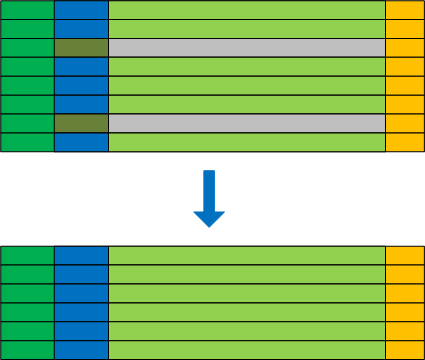
Additional example there include Significant Event and Bifurcation Point patterns. Layered protocols are represented through Embedded Message pattern (to be described and added to the pattern list soon). Such traces can be filtered for their embedded protocol headers and therefore naturally represent Adjoint Thread pattern (for the more detailed description of adjoint threads as extension of multithreading please see the article What is an Adjoint Thread):
 - Dmitry Vostokov @ DumpAnalysis.org + TraceAnalysis.org -
Posted in Network Trace Analysis Patterns, Software Behavior Patterns, Software Diagnostics, Software Diagnostics Pattern Language, Software Diagnostics Patterns, Software Narratology, Software Trace Analysis | No Comments »
Sunday, June 24th, 2012
Memory Dump Analysis Services organizes a free webinar on a unified malware and victimware analysis by using behavioral and structural patterns including a live memory dump analysis example.

Date: 2nd of July, 2012
Time: 17:00 (BST) 12:00 (EST) 09:00 (PST)
Duration: 60 minutes
Space is limited.
Reserve your Webinar seat now at:
https://www3.gotomeeting.com/register/332458406
- Dmitry Vostokov @ DumpAnalysis.org + TraceAnalysis.org -
Posted in Announcements, Malware Analysis, Memory Dump Analysis Services, Security, Software Behavior Patterns, Victimware, Webinars | No Comments »
Tuesday, June 12th, 2012
DumpAnalysis.org portal has been reorganized to Software Diagnostics Institute to reflect the nature of its research activities. More updates later on.
- Dmitry Vostokov @ DumpAnalysis.org + TraceAnalysis.org -
Posted in Announcements, Core Dump Analysis, Crash Dump Analysis, Crash Dump Patterns, Debugging, Software Behavior Patterns, Software Diagnostics, Software Diagnostics Institute, Software Diagnostics Patterns, Software Engineering, Software Trace Analysis, Trace Analysis Patterns | No Comments »
Saturday, June 9th, 2012
While preparing a seminar on Software Diagnostics I made a lot of notes and realized that a system of patterns, corresponding vocabulary and pattern language are needed for this discipline. Here patterns are supposed to be broad in nature and be different from patterns for specific artifacts such as memory dumps and software traces. So the first pattern addresses a diagnostic encounter with a First Fault in comparison to subsequent faults where the problem becomes noticeable and diagnostic resources are allocated. Such faults should not be dismissed. Dan Skwire is a passionate advocate of first fault software problem solving and wrote a book:
First Fault Software Problem Solving: A Guide for Engineers, Managers and Users
The following paper proposes distributed control flow reconstruction for first fault diagnosis:
TraceBack: First Fault Diagnosis by Reconstruction of Distributed Control Flow
Memory Dump Analysis Services uses patterns of abnormal software behavior for its first fault diagnostics that doesn’t require any special instrumentation:
Join Debugging Diagnostics Revolution!
- Dmitry Vostokov @ DumpAnalysis.org + TraceAnalysis.org -
Posted in First Fault Problem Solving, Software Behavior Patterns, Software Diagnostics, Software Diagnostics Patterns, Software Technical Support, Unified Software Diagnostics | No Comments »
Saturday, April 28th, 2012
Sometimes I hear voices saying that Linux, FreeBSD, and Mac OS X core dumps are uninteresting. This is not true. If you haven’t seen anything interesting there it just simply means you have only encountered a limited amount of abnormal software behaviour. The widespread usage of Windows OS means that most patterns have been diagnosed and described first and other OS are waiting their turn.
My goal is to have a pattern catalog with examples from different OS. For example, currently, all Mac OS X patterns I provide are just examples to existing Windows pattern names. All OS share the same structure and behavior, for example, structural memory analysis patterns and the same computational model. Although structural patterns are different from behavioral patterns I also plan to expand the structural list significantly especially in relation to forthcoming Windows malware analysis training. Regarding behavioral patterns it is possible to model and predict specific pattern examples for another OS by using already existing catalog.
- Dmitry Vostokov @ DumpAnalysis.org + TraceAnalysis.org -
Posted in Core Dump Analysis, Crash Dump Analysis, Crash Dump Patterns, Linux Crash Corner, Mac Crash Corner, Mac OS X, Malware Analysis, Malware Patterns, Pattern Models, Pattern Prediction, Pattern-Driven Debugging, Pattern-Driven Software Support, Software Behavior DNA, Software Behavior Patterns, Software Behavioral Genome, Software Diagnostics | No Comments »
Sunday, April 15th, 2012
After 4 years in print this bestselling title needs an update to address minor changes, include extra examples and reference additional research published in Volumes 2, 3, 4, 5 and 6.
- Title: Memory Dump Analysis Anthology, Volume 1
- Author: Dmitry Vostokov
- Publisher: OpenTask (Summer 2012)
- Language: English
- Product Dimensions: 22.86 x 15.24
- Paperback: 800 pages
- ISBN-13: 978-1-908043-35-1
- Hardcover: 800 pages
- ISBN-13: 978-1-908043-36-8
The cover for both paperback and hardcover titles will also have a matte finish. We used A Memory Window artwork for the back cover.

- Dmitry Vostokov @ DumpAnalysis.org + TraceAnalysis.org -
Posted in Aesthetics of Memory Dumps, Announcements, AntiPatterns, Art, Assembly Language, Best Practices, Books, Bugchecks Depicted, C and C++, Complete Memory Dump Analysis, Computer Science, Crash Dump Analysis, Crash Dump Patterns, Crash Dumps for Dummies, Debugging, Debugging Methodology, Dr. Watson, Escalation Engineering, Fun with Crash Dumps, GDB for WinDbg Users, Hardware, Images of Computer Memory, Kernel Development, Mathematics of Debugging, Memiotics (Memory Semiotics), Memoretics, Memory Dump Analysis Methodology, Memory Space Art, Memory Space Music, Memory Visualization, Minidump Analysis, Multithreading, Pattern-Driven Debugging, Pattern-Driven Software Support, Publishing, Reference, Root Cause Analysis, Science of Memory Dump Analysis, Software Architecture, Software Behavior DNA, Software Behavior Patterns, Software Behavioral Genome, Software Diagnostics, Software Engineering, Software Technical Support, Stack Trace Collection, Testing, Tools, Troubleshooting Methodology, Vista, WinDbg Scripts, WinDbg Tips and Tricks, WinDbg for GDB Users, Windows 7, Windows Data Structures, Windows Server 2008, Windows System Administration, x64 Windows | No Comments »
Sunday, April 15th, 2012
In a week this short full color book should appear in online bookstores:
- Title: Software Narratology: An Introduction to the Applied Science of Software Stories
- Authors: Dmitry Vostokov, Memory Dump Analysis Services
- Description: This is a transcript of Memory Dump Analysis Services Webinar about Software Narratology: an exciting new discipline and a field of research founded by DumpAnalysis.org. When software executes it gives us its stories in the form of UI events, software traces and logs. Such stories can be analyzed for their structure and patterns for troubleshooting, debugging and problem resolution purposes. Topics also include software narremes and their types, anticipatory software construction and software diagnostics.
- Publisher: OpenTask (April 2012)
- Language: English
- Product Dimensions: 28.0 x 21.6
- Paperback: 26 pages
- ISBN-13: 978-1908043078

- Dmitry Vostokov @ DumpAnalysis.org + TraceAnalysis.org -
Posted in Announcements, Books, CDF Analysis Tips and Tricks, Code Reading, Computer Science, Debugging, Debugging Methodology, Debugging Trends, Education and Research, Escalation Engineering, Event Tracing for Windows (ETW), Hermeneutics of Memory Dumps and Traces, Ideas, Narralog Programming Language, New Debugging School, Pattern-Driven Debugging, Pattern-Driven Software Support, Presentations, Publishing, Root Cause Analysis, SPDL, Science of Software Tracing, Software Behavior DNA, Software Behavior Patterns, Software Behavioral Genome, Software Diagnostics, Software Engineering, Software Narrative Fiction, Software Narrative Science, Software Narratology, Software Narremes, Software Problem Description Patterns, Software Problem Solving, Software Technical Support, Software Trace Analysis, Software Trace Analysis and History, Software Trace Deconstruction, Software Trace Linguistics, Software Trace Modeling, Software Trace Reading, Software Trace Visualization, Software Tracing Implementation Patterns, Software Troubleshooting Patterns, Structural Trace Patterns, Systems Thinking, Testing, Tools, Trace Analysis Patterns, Training and Seminars, Troubleshooting Methodology, UI Problem Analysis Patterns, Unified Debugging Patterns, Unified Software Diagnostics, Webinars | No Comments »
Monday, April 9th, 2012
Memory Dump Analysis Services organizes a free Webinar on Unified Software Diagnostics (USD) and the new scalable cost-effective software support model called Pattern-Driven Software Support devised to address various shortcomings in existing tiered software support organizations. Examples cover Windows, Mac OS and Linux.

Date: 22nd of June, 2012
Time: 17:00 (BST) 12:00 (EST) 09:00 (PST)
Duration: 60 minutes
Space is limited.
Reserve your Webinar seat now at:
https://www3.gotomeeting.com/register/172771078
- Dmitry Vostokov @ DumpAnalysis.org + TraceAnalysis.org -
Posted in Announcements, Best Practices, Crash Dump Analysis, Crash Dump Patterns, Debugging, Debugging Methodology, Debugging Trends, Economics, Escalation Engineering, Event Tracing for Windows (ETW), JIT Crash Analysis, JIT Memory Space Analysis, Malware Analysis, Malware Patterns, Memoretics, Memory Analysis Forensics and Intelligence, Memory Dump Analysis Methodology, Memory Dump Analysis Services, New Acronyms, New Debugging School, Pattern Prediction, Pattern-Driven Debugging, Pattern-Driven Software Support, Root Cause Analysis, Science of Memory Dump Analysis, Science of Software Tracing, Software Behavior DNA, Software Behavior Patterns, Software Behavioral Genome, Software Diagnostics, Software Engineering, Software Narratology, Software Problem Description Patterns, Software Problem Solving, Software Support Patterns, Software Technical Support, Software Trace Analysis, Software Troubleshooting Patterns, Software Victimology, Software and Economics, Structural Memory Patterns, Structural Trace Patterns, Systems Thinking, Testing, Tools, Trace Analysis Patterns, Training and Seminars, Troubleshooting Methodology, UI Problem Analysis Patterns, Unified Debugging Patterns, Unified Software Diagnostics, Victimware, Webinars, Workaround Patterns | No Comments »
Tuesday, March 20th, 2012
The previous definition of software narratology was restricted to software traces and logs (the top left quadrant on a software narrative square, also the part of Memoretics which studies memory snapshots). Now, with the broadening of the domain of software narratology to the whole world of software narrative stories including actor interactions with software in construction requirements use cases and post-construction incidents we give another definition:
Software narrative is a representation of software events and changes of state. Software Narratology is a discipline that studies such software narratives (software narrative science).
- Dmitry Vostokov @ DumpAnalysis.org + TraceAnalysis.org -
Posted in Announcements, Cloud Computing, Code Reading, Computer Forensics, Computer Science, Crash Dump Analysis, Crash Dump Patterns, Debugging, Memoretics, Science of Memory Dump Analysis, Science of Software Tracing, Software Behavior DNA, Software Behavior Patterns, Software Behavioral Genome, Software Engineering, Software Narrative Science, Software Narratology, Software Narremes, Software Problem Description Patterns, Software Problem Solving, Software Technical Support, Software Trace Analysis, Software Trace Deconstruction, Software Trace Modeling, Software Trace Reading, Structural Trace Patterns, Testing, Trace Analysis Patterns | No Comments »
Sunday, February 19th, 2012
Memory Dump Analysis Services (DumpAnalysis.com) organizes a free Webinar about software narratology: an application of ideas from narratology to software narrative stories.

Learn about this exciting new discipline and a field of research. When software executes it gives us its stories in the form of UI events, software traces and logs. Such stories can be analyzed for their structure and patterns for troubleshooting, debugging and problem resolution purposes.
Prerequisites: basic software troubleshooting and ability to read software generated logs.
Audience: anyone can benefit from this new perspective: from software users to software engineers and managers.
Space is limited.
Reserve your Webinar seat now at:
https://www3.gotomeeting.com/register/603136294
- Dmitry Vostokov @ DumpAnalysis.org + TraceAnalysis.org -
Posted in Announcements, Computer Science, Debugging, Escalation Engineering, Intelligence Analysis Patterns, Memory Dump Analysis Services, SPDL, Science of Software Tracing, Security, Software Behavior DNA, Software Behavior Patterns, Software Behavioral Genome, Software Engineering, Software Narrative Fiction, Software Narratology, Software Problem Description Patterns, Software Problem Solving, Software Technical Support, Software Trace Analysis, Software Trace Deconstruction, Software Trace Linguistics, Software Trace Modeling, Software Trace Reading, Software Trace Visualization, Software Tracing Implementation Patterns, Software Tracing for Dummies, Software Troubleshooting Patterns, Software Victimology, Structural Trace Patterns, Testing, Tools, Trace Analysis Patterns, Troubleshooting Methodology, UI Problem Analysis Patterns, Unified Debugging Patterns, Unit Testing, Victimware, Webinars, Windows System Administration | No Comments »
Friday, February 17th, 2012
In narratology anti-narrative denotes a narrative having sequences of events impossible in reality. In software traces such sequences usually depict abnormal software behaviour. Here are some parallels with corresponding trace analysis patterns:
Fiction                             | Software Trace

================================================

Repeated unrepeatable       | Periodic Error (?)

Denarration (erasure)            | No Activity / Incomplete History

Chronological contradiction | Impossible Trace
Question mark means that possibly another pattern is needed there.
- Dmitry Vostokov @ DumpAnalysis.org + TraceAnalysis.org -
Posted in Crash Dump Analysis, Crash Dump Patterns, Debugging, Software Behavior Patterns, Software Narrative Fiction, Software Narratology, Software Trace Analysis, Trace Analysis Patterns | No Comments »
Thursday, February 2nd, 2012
Forthcoming Accelerated Software Trace Analysis training requires extensive real life like software logs with multiple software behaviour patterns. The similar accelerated memory dump analysis trainings (unmanaged / native Windows and .NET) also required good memory dumps but this problem was solved by modeling patterns of abnormal software behaviour in an appropriate implementation language such as C++ and C#. Modeling software traces with hundreds of software components, processes and threads would require enormous programming efforts. Therefore, the natural approach is to describe a desired software trace in some declarative language (or minimally imperative) and get a million line software log that models a specific combination of trace analysis patterns. So, welcome to such a language called Narralog: Software Narrative Log or Narrative Logic. Please note that this language is different from Riemann programming language which is a language to describe software problems and generate software problem solving tools. Language details and whether a kind of a Metadefect Template Library will be used to implement Narralog or simple macroprogramming is suffice will be decided and announced when we further develop our training.
- Dmitry Vostokov @ DumpAnalysis.org + TraceAnalysis.org -
Posted in Metadefect Template Library, Narralog Programming Language, Riemann Programming Language, SPDL, Software Behavior DNA, Software Behavior Patterns, Software Behavioral Genome, Software Defect Construction, Software Engineering, Software Narrative Fiction, Software Narratology, Software Problem Solving, Software Trace Analysis, Software Trace Modeling, Software and Modeling, Trace Analysis Patterns | No Comments »
Saturday, January 7th, 2012
This is another tracing example of unified debugging patterns introduced previously.
- Analysis Patterns
Focus of Tracing
- Architectural Patterns
Debug Event Subscription / Notification
- Design Patterns
Shared Debug Event State
- Implementation Patterns
Shared Variable
- Usage Patterns
Saving a memory address obtained at a breakpoint event in a debugger pseudo-register for use at later breakpoint events
Debugging.tv published a case study for tracing window messages in WinDbg. There a pseudo-register is used to save a buffer address before GetMessage call and then to reuse it after the call. Please look at Event State Management slide on Frames episode 0×06 presentation. The full WinDbg log and the recording are available there too.
- Dmitry Vostokov @ DumpAnalysis.org + TraceAnalysis.org -
Posted in Debugging, Debugging TV, Software Architecture, Software Behavior Patterns, Software Engineering, Software Trace Analysis, Trace Analysis Patterns, Unified Debugging Patterns, WinDbg Scripts, WinDbg Tips and Tricks | No Comments »
Saturday, December 17th, 2011
The number of software trace analysis patterns approaches the critical mass of 50 and we have decided to focus on software tracing and logging in the forthcoming year. Some books on tracing including Volume 7 of Memory Dump Analysis Anthology will be published by OpenTask during that year and our efforts will be to further advance software narratology, software trace linguistics, and software trace analysis in the context of memory dump analysis, generative debugging and modeling software behavior.
- Dmitry Vostokov @ DumpAnalysis.org + TraceAnalysis.org -
Posted in Announcements, CDF Analysis Tips and Tricks, Debugging, Generative Debugging, Memoretics, Science of Software Tracing, Software Behavior DNA, Software Behavior Patterns, Software Behavioral Genome, Software Narratology, Software Trace Analysis, Software Trace Analysis and History, Software Trace Deconstruction, Software Trace Linguistics, Software Trace Reading, Software Trace Visualization, Software Tracing Implementation Patterns, Software Tracing for Dummies, Trace Analysis Patterns | No Comments »
Monday, December 12th, 2011
More than 4 years passed since I provided a longer structuralist definition. Recently I came to recognize a pattern-driven iterative and incremental nature of memory and software trace analysis and post-construction software problem solving in general and therefore a one sentence definition became necessary:
“Recognition and interpretation of patterns of software behavior”
- Dmitry Vostokov @ DumpAnalysis.org + TraceAnalysis.org -
Posted in Announcements, Crash Dump Analysis, Crash Dump Patterns, Malware Analysis, Malware Patterns, Memiotics (Memory Semiotics), Memoretics, Memory Analysis Forensics and Intelligence, Science of Memory Dump Analysis, Science of Software Tracing, Software Behavior Patterns, Software Narratology, Software Problem Solving, Software Trace Analysis, Structural Memory Patterns, Structural Trace Patterns, Trace Analysis Patterns, Victimware | No Comments »
Sunday, December 11th, 2011
When doing software behavior artifact collection, live debugging or postmortem memory dump analysis we must also take into consideration the possibility of Debugger Bugs. I classify them into hard and soft bugs. The former are those software defects and behavioral problems that result in further abnormal software behavior incidents like crashes and hangs. One example is this Microsoft KB article about DebugDiag. Soft debugger bugs usually manifest themselves as glitches in data output, nonsense or false positive diagnostics, for example, this excessive non-paged pool usage message in the output from !vm WinDbg command (see the corresponding MS KB article):
1: kd> !vm
*** Virtual Memory Usage ***

Physical Memory:     1031581 (   4126324 Kb)

Page File: \??\C:\pagefile.sys

Current:   4433524 Kb  Free Space:   4433520 Kb

Minimum:   4433524 Kb  Maximum:     12378972 Kb

Unimplemented error for MiSystemVaTypeCount

Available Pages:      817652 (   3270608 Kb)

ResAvail Pages:       965229 (   3860916 Kb)

Locked IO Pages:           0 (         0 Kb)

Free System PTEs:   33555714 ( 134222856 Kb)

Modified Pages:        15794 (     63176 Kb)

Modified PF Pages:     15793 (     63172 Kb)

NonPagedPool Usage: 88079121 ( 352316484 Kb)

NonPagedPoolNx Usage:  12885 (     51540 Kb)

NonPagedPool Max:     764094 (   3056376 Kb)

********** Excessive NonPaged Pool Usage *****

PagedPool 0 Usage:     35435 (    141740 Kb)

PagedPool 1 Usage:      3620 (     14480 Kb)

PagedPool 2 Usage:       573 (      2292 Kb)

PagedPool 3 Usage:       535 (      2140 Kb)

PagedPool 4 Usage:       538 (      2152 Kb)

PagedPool Usage:       40701 (    162804 Kb)

PagedPool Maximum:  33554432 ( 134217728 Kb)

Session Commit:         9309 (     37236 Kb)

Shared Commit:          6460 (     25840 Kb)

Special Pool:              0 (         0 Kb)

Shared Process:         5760 (     23040 Kb)

PagedPool Commit:      40765 (    163060 Kb)

Driver Commit:          2805 (     11220 Kb)

Committed pages:      212472 (    849888 Kb)

Commit limit:        2139487 (   8557948 Kb)
- Dmitry Vostokov @ DumpAnalysis.org + TraceAnalysis.org -
Posted in Crash Dump Analysis, Crash Dump Patterns, Debugging, Live Debugging, Software Behavior Patterns, Tools | 7 Comments »