Archive for the ‘New Words’ Category
Monday, December 12th, 2011
This is an annual celebration at the overflow boundary 31 - 32 [1] (December - January). Its date is kept coincidental with The New Year to allow backward and legacy compatibility. It is an official celebration in memory religion, Memorianity, but it is also an open one and not particularly tied to it similar to other religious celebrations that became secular holidays. A series of special artistic images and pictures have been commissioned for the first Memoristmas, so stay tuned (listen to memory for news). If you are curious about etymology of this new word please take a note that -mas suffix denotes memory analysis service.
Dmitry Vostokov,
Memoriarch
- Dmitry Vostokov @ DumpAnalysis.org + TraceAnalysis.org -
Posted in Announcements, Memory Celebrations, Memory Holidays, Memory Religion (Memorianity), New Words, Religion | No Comments »
Friday, November 11th, 2011
This is a name for a virtual country where I’m a virtual citizen. This coined word is the latest addition to Citrixware and Citrixofication together with I Love Citrix social media logo.
- Dmitry Vostokov @ DumpAnalysis.org + TraceAnalysis.org -
Posted in Citrix, Cloud Computing, History, New Words, Social Media, Virtualization | No Comments »
Friday, August 5th, 2011
Finction (or simply Finc) - A function with a flaw, having abnormal behaviour, a candidate for a fix or axing.
Examples: After delivering a hotfix with axed code they were embarrassed to see that finction again on a stack trace.
Etymology: Derives from “function”. Inspired by MDAA V3 errata.
- Dmitry Vostokov @ DumpAnalysis.org + TraceAnalysis.org -
Posted in Debugging, Debugging Slang, New Words | No Comments »
Wednesday, June 22nd, 2011
As the number of crash dump analysis pattern icons approaches 100 with software trace analysis patterns (and other troubleshooting and debugging pattern categories) on the horizon with every icon as a symbol signifying certain computer memory signs (computer memory semiotics is called memiotics, as a part of memoretics discipline) I found it necessary to name the new form of art. I decided upon the name Memioart. If you have a better name for it please let me know. I also plan to write commentaries on memioicons (semioicons) to explain elements on pattern icons and reasons why I chose them.
- Dmitry Vostokov @ DumpAnalysis.org + TraceAnalysis.org -
Posted in Announcements, Art, Memioart, Memiotics (Memory Semiotics), New Words, Pattern Icons | No Comments »
Sunday, April 17th, 2011
I’m pleased to announce that MDAA, Volume 5 is available in PDF format:
www.dumpanalysis.org/Memory+Dump+Analysis+Anthology+Volume+5
It features:
- 25 new crash dump analysis patterns
- 11 new pattern interaction case studies (including software tracing)
- 16 new trace analysis patterns
- 7 structural memory patterns
- 4 modeling case studies for memory dump analysis patterns
- Discussion of 3 common analysis mistakes
- Malware analysis case study
- Computer independent architecture of crash analysis report service
- Expanded coverage of software narratology
- Metaphysical and theological implications of memory dump worldview
- More pictures of memory space and physicalist art
- Classification of memory visualization tools
- Memory visualization case studies
- Close reading of the stories of Sherlock Holmes: Dr. Watson’s observational patterns
- Fully cross-referenced with Volume 1, Volume 2, Volume 3, and Volume 4
Its table of contents is available here:
www.dumpanalysis.org/MDAA/MDA-Anthology-V5-TOC.pdf
Paperback and hardcover versions should be available in a week or two. I also started working on Volume 6 that should be available in November-December.
- Dmitry Vostokov @ DumpAnalysis.org + TraceAnalysis.org -
Posted in Aesthetics of Memory Dumps, Analysis Notation, Announcements, AntiPatterns, Archaeology of Computer Memory, Art, Assembly Language, Best Practices, Books, C and C++, CDF Analysis Tips and Tricks, Categorical Debugging, Citrix, Common Mistakes, Common Questions, Complete Memory Dump Analysis, Computer Forensics, Computer Science, Crash Analysis Report Environment (CARE), Crash Dump Analysis, Crash Dump De-analysis, Crash Dump Patterns, Crash Dumps for Dummies, Cyber Warfare, Debugging, Debugging Bureau, Debugging Industry, Debugging Methodology, Debugging Slang, Debugging Trends, Deep Down C++, Dr. Watson, Dublin School of Security, Education and Research, Escalation Engineering, Fun with Crash Dumps, Fun with Debugging, Fun with Software Traces, General Memory Analysis, Hermeneutics of Memory Dumps and Traces, Images of Computer Memory, Kernel Development, Malware Analysis, Mathematics of Debugging, Memiotics (Memory Semiotics), Memory Analysis Forensics and Intelligence, Memory Diagrams, Memory Dump Analysis Services, Memory Dumps in Myths, Memory Space Art, Memory Systems Language, Memory Visualization, Memory and Glitches, Metaphysics of Memory Worldview, Multithreading, Music for Debugging, New Acronyms, New Debugging School, New Words, Pattern Models, Philosophy, Physicalist Art, Publishing, Reverse Engineering, Science of Memory Dump Analysis, Science of Software Tracing, Security, Software Architecture, Software Behavior Patterns, Software Chorography, Software Chorology, Software Defect Construction, Software Engineering, Software Generalist, Software Maintenance Institute, Software Narratology, Software Technical Support, Software Trace Analysis, Software Trace Reading, Software Trace Visualization, Software Tracing for Dummies, Software Troubleshooting Patterns, Software Victimology, Structural Memory Patterns, Structural Trace Patterns, Systems Thinking, Testing, The Way of Philip Marlowe, Tools, Trace Analysis Patterns, Training and Seminars, Troubleshooting Methodology, Victimware, Vista, Webinars, WinDbg Scripting Extensions, WinDbg Scripts, WinDbg Tips and Tricks, WinDbg for GDB Users, Windows 7, Windows Server 2008, Windows System Administration, Workaround Patterns, x64 Windows | No Comments »
Friday, March 18th, 2011
Frequently caught myself recognizing bit values like 100084 when I’m looking at car plate numbers. Sometimes I see a number and wonder whether it is a valid window handle.
Do you also have similar perceptions? Please let me know if you have different memceptions 
- Dmitry Vostokov @ DumpAnalysis.org + TraceAnalysis.org -
Posted in Fun with Crash Dumps, Fun with Debugging, Fun with Software Traces, New Words, Psychoanalysis of Software Maintenance and Support | 1 Comment »
Wednesday, March 9th, 2011
Memiosphere is the sphere of operating memory processes where memory signs (studied by memiotics) are created, manipulated and destroyed. This new word was inspired by the similar notion of semiosphere. We can also metaphorically analyze and remember it as mem(ory) + I/O + sphere.
- Dmitry Vostokov @ DumpAnalysis.org + TraceAnalysis.org -
Posted in Memiotics (Memory Semiotics), Memoidealism, Memoretics, Memory Systems Language, New Words | No Comments »
Friday, November 12th, 2010
Five volumes of cross-disciplinary Anthology (dubbed by the author “The Summa Memorianica”) lay the foundation of the scientific discipline of Memoretics (study of computer memory snapshots and their evolution in time) that is also called Memory Dump and Software Trace Analysis.ca
The 5th volume contains revised, edited, cross-referenced, and thematically organized selected DumpAnalysis.org blog posts about crash dump, software trace analysis and debugging written in February 2010 - October 2010 for software engineers developing and maintaining products on Windows platforms, quality assurance engineers testing software on Windows platforms, technical support and escalation engineers dealing with complex software issues, and security researchers, malware analysts and reverse engineers. The fifth volume features:
- 25 new crash dump analysis patterns
- 11 new pattern interaction case studies (including software tracing)
- 16 new trace analysis patterns
- 7 structural memory patterns
- 4 modeling case studies for memory dump analysis patterns
- Discussion of 3 common analysis mistakes
- Malware analysis case study
- Computer independent architecture of crash analysis report service
- Expanded coverage of software narratology
- Metaphysical and theological implications of memory dump worldview
- More pictures of memory space and physicalist art
- Classification of memory visualization tools
- Memory visualization case studies
- Close reading of the stories of Sherlock Holmes: Dr. Watson’s observational patterns
- Fully cross-referenced with Volume 1, Volume 2, Volume 3, and Volume 4
Product information:
- Title: Memory Dump Analysis Anthology, Volume 5
- Author: Dmitry Vostokov
- Language: English
- Product Dimensions: 22.86 x 15.24
- Paperback: 400 pages
- Publisher: Opentask (10 December 2010)
- ISBN-13: 978-1-906717-96-4
- Hardcover: 400 pages
- Publisher: Opentask (10 December 2010)
- ISBN-13: 978-1-906717-97-1

Back cover features memory space art image Hot Computation: Memory on Fire.
- Dmitry Vostokov @ DumpAnalysis.org + TraceAnalysis.org -
Posted in Aesthetics of Memory Dumps, Announcements, Archaeology of Computer Memory, Art, Assembly Language, Books, C and C++, CDF Analysis Tips and Tricks, Categorical Debugging, Common Mistakes, Complete Memory Dump Analysis, Computer Science, Crash Analysis Report Environment (CARE), Crash Dump Analysis, Crash Dump De-analysis, Crash Dump Patterns, Debugging, Debugging Methodology, Debugging Slang, Deep Down C++, Dr. Watson, Dublin School of Security, Education and Research, Escalation Engineering, Fun with Crash Dumps, Fun with Debugging, Fun with Software Traces, General Memory Analysis, Hermeneutics of Memory Dumps and Traces, Images of Computer Memory, Kernel Development, Malware Analysis, Malware Patterns, Mathematics of Debugging, Memiotics (Memory Semiotics), Memoidealism, Memoretics, Memory Analysis Culture, Memory Analysis Forensics and Intelligence, Memory Analysis Report System, Memory Diagrams, Memory Dreams, Memory Dump Analysis Jobs, Memory Dump Analysis Services, Memory Dump Analysis and History, Memory Dumps in Movies, Memory Dumps in Myths, Memory Religion (Memorianity), Memory Space Art, Memory Systems Language, Memory Visualization, Memory and Glitches, Memuonics, Metaphysical Society of Ireland, Minidump Analysis, Movies and Debugging, Multithreading, Museum of Debugging, Music for Debugging, Music of Computation, New Acronyms, New Words, Paleo-debugging, Pattern Models, Pattern Prediction, Philosophy, Physicalist Art, Psychoanalysis of Software Maintenance and Support, Publishing, Science of Memory Dump Analysis, Science of Software Tracing, Security, Software Architecture, Software Behavior Patterns, Software Chorography, Software Chorology, Software Defect Construction, Software Engineering, Software Generalist, Software Maintenance Institute, Software Narratology, Software Technical Support, Software Trace Analysis, Software Trace Analysis and History, Software Trace Deconstruction, Software Trace Reading, Software Trace Visualization, Software Tracing for Dummies, Software Troubleshooting Patterns, Software Victimology, Stack Trace Collection, Structural Memory Analysis and Social Sciences, Structural Memory Patterns, Structural Trace Patterns, Systems Thinking, Testing, Theology, Tool Objects, Tools, Trace Analysis Patterns, Training and Seminars, Troubleshooting Methodology, Uses of UML, Victimware, Virtualization, Vista, Visual Dump Analysis, Webinars, WinDbg Scripts, WinDbg Tips and Tricks, WinDbg for GDB Users, Windows 7, Windows Server 2008, Windows System Administration, Workaround Patterns, x64 Windows | No Comments »
Monday, September 20th, 2010
There many interpretations of the letter M in M-theory but I propose another one: M stands for Memory. In any outcome it surely will be committed to memory in the future either as successful or not. On the other hand I’m now trying to make sense of it in relation to Memory as an ur-foundation (ur-, primordial, German prefix).
- Dmitry Vostokov @ DumpAnalysis.org + TraceAnalysis.org -
Posted in Fun with Crash Dumps, Memoidealism, Memoretics, Memuonics, New Acronyms, New Words, Philosophy, Physics | No Comments »
Wednesday, June 2nd, 2010
This paleodebugging tool was excavated from Central Russia (thanks to Mr. Kutuzov) and generously provided for a photo session by its owner Mr. Mansour:
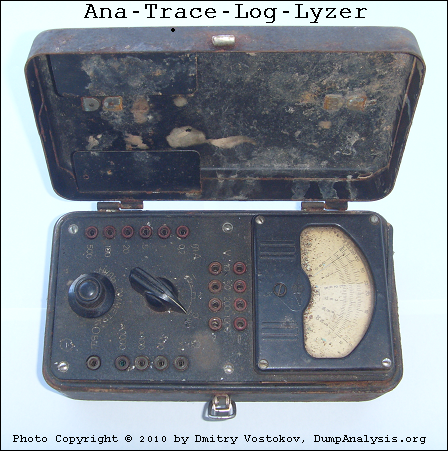
It also inspired this sequence of strcat: Analog -> Anatrace -> Analyzer -> Tracelyzer -> Loglyzer.
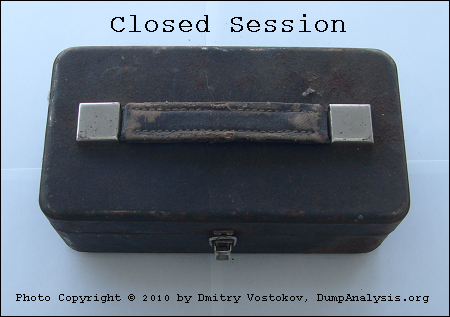
… enough tracing. It’s time to close our session:
… what is left? If you are curious, look at this conceptual picture:
Component Trace
If you wonder what electricity has to do with tracing (at a metaphorical level) look at this trace analysis pattern:
Statement Density and Current
- Dmitry Vostokov @ DumpAnalysis.org + TraceAnalysis.org -
Posted in Archaeology of Computer Memory, Art, Debugging, Fun with Software Traces, History, New Words, Paleo-debugging, Physicalist Art, Software Trace Analysis, Testing, Tools, Trace Analysis Patterns | No Comments »
Thursday, April 22nd, 2010
I’ve decided to adapt archaeological classificatory framework (using my favourite method of inquiry: metaphorical bijectionism) to lay out foundations for yet another attempt to classify DA+TA patterns):
Attribute  ↔ Pattern

Artefact   ↔ Component Artefact1

Assemblage ↔ Component Assemblage

Culture    ↔ Memory System Culture
2

1 Can be either a component-generated artefact or a component like a module or symbol file
2 Typical examples of memory system cultures are Windows, UNIX or even “Multiplatform”
I propose a word Memoarchaeological for such a framework and Memoarchaeology for a branch of Memoretics that studies saved computer memory artifacts from past computations (as opposed to live memory).
Note: In one of the forthcoming issues of Debugged! MZ/PE magazine there will be presented yet another classificatory scheme.
- Dmitry Vostokov @ DumpAnalysis.org + TraceAnalysis.org -
Posted in Announcements, Archaeology of Computer Memory, CDA Pattern Classification, Crash Dump Analysis, Crash Dump Patterns, Debugging, Memoretics, Memory Analysis Forensics and Intelligence, New Words, Science of Memory Dump Analysis, Science of Software Tracing, Software Behavior Patterns, Software Trace Analysis, Trace Analysis Patterns | No Comments »
Sunday, April 18th, 2010
OpenTask to offer first 3 volumes of Memory Dump Analysis Anthology in one set:


The set is available exclusively from OpenTask e-Commerce web site starting from June. Individual volumes are also available from Amazon, Barnes & Noble and other bookstores worldwide.
Product information:
- Title: Modern Memory Dump and Software Trace Analysis: Volumes 1-3
- Author: Dmitry Vostokov
- Language: English
- Product Dimensions: 22.86 x 15.24
- Paperback: 1600 pages
- Publisher: Opentask (31 May 2010)
- ISBN-13: 978-1-906717-99-5
Information about individual volumes:
- Dmitry Vostokov @ DumpAnalysis.org + TraceAnalysis.org -
Posted in .NET Debugging, Aesthetics of Memory Dumps, Announcements, AntiPatterns, Art, Assembly Language, Books, Bugchecks Depicted, C and C++, CDA Pattern Classification, CDF Analysis Tips and Tricks, Categorical Debugging, Certification, Citrix, Code Reading, Common Mistakes, Computational Ghosts and Bug Hauntings, Computer Science, Countefactual Debugging, Crash Analysis Report Environment (CARE), Crash Dump Analysis, Crash Dump Patterns, Crash Dumps for Dummies, Data Recovery, DebugWare Patterns, Debugging, Debugging Methodology, Debugging Slang, Deep Down C++, Dictionary of Debugging, Dr. Watson, Education and Research, Escalation Engineering, Fun with Crash Dumps, Futuristic Memory Dump Analysis, GDB for WinDbg Users, Hardware, History, Horrors of Computation, Hyper-V, Intelligent Memory Movement, Kernel Development, Laws of Troubleshooting and Debugging, Mathematics of Debugging, Memiotics (Memory Semiotics), Memoidealism, Memoretics, Memory Analysis Culture, Memory Analysis Forensics and Intelligence, Memory Auralization, Memory Dump Analysis Jobs, Memory Religion (Memorianity), Memory Space Art, Memory Space Music, Memory Systems Language, Memory Visualization, Memuonics, Minidump Analysis, Multithreading, Music for Debugging, Music of Computation, New Acronyms, New Words, Occult Debugging, Philosophy, Psi-computation, Publishing, Science of Memory Dump Analysis, Science of Software Tracing, Security, Software Architecture, Software Defect Construction, Software Engineering, Software Generalist, Software Maintenance Institute, Software Narratology, Software Technical Support, Software Trace Analysis, Software Trace Visualization, Software Tracing for Dummies, Software Victimology, Stack Trace Collection, Testing, Tools, Trace Analysis Patterns, Training and Seminars, Troubleshooting Methodology, Victimware, Virtualization, Vista, Visual Dump Analysis, WinDbg Scripts, WinDbg Tips and Tricks, WinDbg for GDB Users, Windows 7, Windows Server 2008, Windows System Administration | No Comments »
Monday, March 1st, 2010
Memoriarch
The highest title in Memorianic religious hierarchy. Equivalent to similar titles of Pope, Patriarch or Archbishop. Derived from Memoria (Latin, memory) and arch (Latin root, chief, first, rule).
- Dmitry Vostokov @ Memory Religion Portal -
Posted in Memory Religion (Memorianity), New Words | No Comments »
Thursday, February 11th, 2010
This is a revised, edited, cross-referenced and thematically organized volume of selected DumpAnalysis.org blog posts about crash dump analysis and debugging written in July 2009 - January 2010 for software engineers developing and maintaining products on Windows platforms, quality assurance engineers testing software on Windows platforms and technical support and escalation engineers dealing with complex software issues. The fourth volume features:
- 13 new crash dump analysis patterns
- 13 new pattern interaction case studies
- 10 new trace analysis patterns
- 6 new Debugware patterns and case study
- Workaround patterns
- Updated checklist
- Fully cross-referenced with Volume 1, Volume 2 and Volume 3
- New appendixes
Product information:
- Title: Memory Dump Analysis Anthology, Volume 4
- Author: Dmitry Vostokov
- Language: English
- Product Dimensions: 22.86 x 15.24
- Paperback: 410 pages
- Publisher: Opentask (30 March 2010)
- ISBN-13: 978-1-906717-86-5
- Hardcover: 410 pages
- Publisher: Opentask (30 April 2010)
- ISBN-13: 978-1-906717-87-2

Back cover features memory space art image: Internal Process Combustion.
- Dmitry Vostokov @ DumpAnalysis.org + TraceAnalysis.org -
Posted in .NET Debugging, Aesthetics of Memory Dumps, Announcements, AntiPatterns, Art, Assembly Language, Books, C and C++, CDA Pattern Classification, CDF Analysis Tips and Tricks, Categorical Debugging, Certification, Citrix, Code Reading, Common Mistakes, Computer Science, Countefactual Debugging, Crash Analysis Report Environment (CARE), Crash Dump Analysis, Crash Dump Patterns, Crash Dumps for Dummies, DebugWare Patterns, Debugging, Debugging Slang, Education and Research, Escalation Engineering, Fun with Crash Dumps, Games for Debugging, Hardware, Horrors of Computation, Hyper-V, Kernel Development, Laws of Troubleshooting and Debugging, Mathematics of Debugging, Memiotics (Memory Semiotics), Memoidealism, Memoretics, Memory Analysis Culture, Memory Analysis Forensics and Intelligence, Memory Dreams, Memory Dump Analysis Jobs, Memory Dumps in Movies, Memory Space Art, Memory Visualization, Memuonics, Minidump Analysis, Multithreading, Music for Debugging, New Acronyms, New Words, Opcodism, Philosophy, Physicalist Art, Publishing, Science Fiction, Science of Memory Dump Analysis, Science of Software Tracing, Security, Software Architecture, Software Defect Construction, Software Engineering, Software Generalist, Software Maintenance Institute, Software Narratology, Software Technical Support, Software Trace Analysis, Software Trace Visualization, Software Tracing for Dummies, Software Victimology, Stack Trace Collection, Testing, Tools, Trace Analysis Patterns, Training and Seminars, Troubleshooting Methodology, Victimware, Virtualization, Vista, Visual Dump Analysis, WinDbg Scripts, WinDbg Tips and Tricks, WinDbg for GDB Users, Windows 7, Windows Server 2008, Windows System Administration, Workaround Patterns | No Comments »
Tuesday, January 26th, 2010
Bug-sistential - pertaining to existing bugs
Bug-sistentialism - a pessimistic outlook about the existence of bugs
Examples: What a bug-sistential problem we have to solve here! Pure bug-sistentialism!
- Dmitry Vostokov @ DumpAnalysis.org + TraceAnalysis.org -
Posted in Crash Dump Analysis, Debugging, Debugging Slang, Fun with Crash Dumps, New Words | No Comments »
Wednesday, January 20th, 2010
Memoidealism (or alternatively Panmemorism, not the same as Panpsychism) now acquires a definition motivated by the functional definition of panpsychism in David Skrbina’s book Panpsychism in the West :
:
Memoidealism
All entities, e.g. objects, components, subsystems and systems of objects and components, possess a memory for themselves.
- Dmitry Vostokov @ DumpAnalysis.org + TraceAnalysis.org -
Posted in Memoidealism, New Words, Philosophy | 3 Comments »
Sunday, January 17th, 2010
Having considered computational threads as braided strings and after discerning several software trace analysis patterns (just the beginning) we can see formatted and tabulated software trace output in a new light and employ the “fabric of traces” and braid metaphors for an Adjoint Thread concept. This new concept was motivated by reading about Extended Phenotype (*) and extensive analysis of Citrix ETW-based CDF traces using CDFAnalyzer. The term Adjoint was borrowed from mathematics because the concept we discuss below resembles this metaphorical formula: (Thread A, B) = [A, Thread B]. Let me first illustrate adjoint threading using simplified trace tables. Consider this generalized software trace example (date and time column is omitted for visual clarity):
|
#
|
Source Dir
|
PID
|
TID
|
File Name
|
Function
|
Message
|
|
1
|
\src\subsystemA
|
2792
|
5676
|
file1.cpp
|
fooA
|
Message text…
|
|
2
|
\src\subsystemA
|
2792
|
5676
|
file1.cpp
|
fooA
|
Message text…
|
|
3
|
\src\subsystemA
|
2792
|
5676
|
file1.cpp
|
fooA
|
Message text…
|
|
4
|
\src\lib
|
2792
|
5680
|
file2.cpp
|
barA
|
Message text…
|
|
5
|
\src\subsystemA
|
2792
|
5680
|
file1.cpp
|
fooA
|
Message text…
|
|
6
|
\src\subsystemA
|
2792
|
5676
|
file1.cpp
|
fooA
|
Message text…
|
|
7
|
\src\lib
|
2792
|
5680
|
file2.cpp
|
fooA
|
Message text…
|
|
8
|
\src\lib
|
2792
|
5680
|
file2.cpp
|
fooA
|
Message text…
|
|
9
|
\src\subsystemB
|
2792
|
3912
|
file3.cpp
|
barB
|
Message text…
|
|
10
|
\src\subsystemB
|
2792
|
3912
|
file3.cpp
|
barB
|
Message text…
|
|
11
|
\src\subsystemB
|
2792
|
3912
|
file3.cpp
|
barB
|
Message text…
|
|
12
|
\src\subsystemB
|
2792
|
3912
|
file3.cpp
|
barB
|
Message text…
|
|
13
|
\src\subsystemB
|
2792
|
3912
|
file3.cpp
|
barB
|
Message text…
|
|
14
|
\src\subsystemB
|
2792
|
3912
|
file3.cpp
|
barB
|
Message text…
|
|
15
|
\src\subsystemB
|
2792
|
2992
|
file4.cpp
|
fooB
|
Message text…
|
|
16
|
\src\subsystemB
|
2792
|
3008
|
file4.cpp
|
fooB
|
Message text…
|
|
…
|
…
|
…
|
…
|
…
|
…
|
…
|
We see several threads in a process PID 2792. In CDFAnalyzer we can filter trace messages that belong to any column and if we filter by TID we get a view of any Thread of Activity. However, each thread can “run” through any source directory, file name or function. If a function belongs to a library multiple threads would access it. This source location (can be considered as a subsystem), file or function view of activity is called an Adjoint Thread. For example, if we filter only subsystemA column in the trace above we get this table:
|
#
|
Source Dir
|
PID
|
TID
|
File Name
|
Function
|
Message
|
|
1
|
\src\subsystemA
|
2792
|
5676
|
file1.cpp
|
fooA
|
Message …
|
|
2
|
\src\subsystemA
|
2792
|
5676
|
file1.cpp
|
fooA
|
Message …
|
|
3
|
\src\subsystemA
|
2792
|
5676
|
file1.cpp
|
fooA
|
Message …
|
|
5
|
\src\subsystemA
|
2792
|
5680
|
file1.cpp
|
fooA
|
Message …
|
|
6
|
\src\subsystemA
|
2792
|
5676
|
file1.cpp
|
fooA
|
Message …
|
|
7005
|
\src\subsystemA
|
2792
|
5664
|
file1.cpp
|
fooA
|
Message …
|
|
10198
|
\src\subsystemA
|
2792
|
5664
|
file1.cpp
|
fooA
|
Message …
|
|
10364
|
\src\subsystemA
|
2792
|
5664
|
file1.cpp
|
fooA
|
Message …
|
|
10417
|
\src\subsystemA
|
2792
|
5664
|
file1.cpp
|
fooA
|
Message …
|
|
10420
|
\src\subsystemA
|
2792
|
5676
|
file1.cpp
|
fooA
|
Message …
|
|
10422
|
\src\subsystemA
|
2792
|
5680
|
file1.cpp
|
fooA
|
Message …
|
|
10587
|
\src\subsystemA
|
2792
|
5664
|
file1.cpp
|
fooA
|
Message …
|
|
10767
|
\src\subsystemA
|
2792
|
5680
|
file1.cpp
|
fooA
|
Message …
|
|
11126
|
\src\subsystemA
|
2792
|
5668
|
file1.cpp
|
fooA
|
Message …
|
|
11131
|
\src\subsystemA
|
2792
|
5680
|
file1.cpp
|
fooA
|
Message …
|
|
11398
|
\src\subsystemA
|
2792
|
5676
|
file1.cpp
|
fooA
|
Message …
|
|
11501
|
\src\subsystemA
|
2792
|
5668
|
file1.cpp
|
fooA
|
Message …
|
|
11507
|
\src\subsystemA
|
2792
|
5668
|
file1.cpp
|
fooA
|
Message …
|
|
11509
|
\src\subsystemA
|
2792
|
5664
|
file1.cpp
|
fooA
|
Message …
|
|
11513
|
\src\subsystemA
|
2792
|
5680
|
file1.cpp
|
fooA
|
Message …
|
|
11524
|
\src\subsystemA
|
2792
|
5668
|
file1.cpp
|
fooA
|
Message …
|
|
…
|
…
|
…
|
…
|
…
|
…
|
…
|
We can graphically view subsystemA as a braid string that “permeates the fabric of threads”:
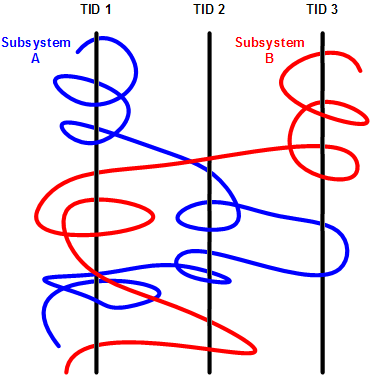
We can get many different braids by changing filters, hence multibraiding. Here is another example of a driver source file view initially permeating 2 process contexts and 4 threads:
|
#
|
Source Dir
|
PID
|
TID
|
File Name
|
Function
|
Message
|
|
41
|
\src\sys\driver
|
3636
|
3848
|
entry.c
|
DriverEntry
|
IOCTL …
|
|
80
|
\src\sys\driver
|
3636
|
3896
|
entry.c
|
DriverEntry
|
IOCTL …
|
|
99
|
\src\sys\driver
|
3636
|
3896
|
entry.c
|
DriverEntry
|
IOCTL …
|
|
102
|
\src\sys\driver
|
3636
|
3896
|
entry.c
|
DriverEntry
|
IOCTL …
|
|
179
|
\src\sys\driver
|
3636
|
3896
|
entry.c
|
DriverEntry
|
IOCTL …
|
|
180
|
\src\sys\driver
|
3636
|
3896
|
entry.c
|
DriverEntry
|
IOCTL …
|
|
311
|
\src\sys\driver
|
3636
|
3896
|
entry.c
|
DriverEntry
|
IOCTL …
|
|
447
|
\src\sys\driver
|
3636
|
3896
|
entry.c
|
DriverEntry
|
IOCTL …
|
|
448
|
\src\sys\driver
|
3636
|
3896
|
entry.c
|
DriverEntry
|
IOCTL …
|
|
457
|
\src\sys\driver
|
2792
|
5108
|
entry.c
|
DriverEntry
|
IOCTL …
|
|
608
|
\src\sys\driver
|
3636
|
3896
|
entry.c
|
DriverEntry
|
IOCTL …
|
|
614
|
\src\sys\driver
|
3636
|
3896
|
entry.c
|
DriverEntry
|
IOCTL …
|
|
655
|
\src\sys\driver
|
3636
|
3896
|
entry.c
|
DriverEntry
|
IOCTL …
|
|
675
|
\src\sys\driver
|
3636
|
3896
|
entry.c
|
DriverEntry
|
IOCTL …
|
|
678
|
\src\sys\driver
|
3636
|
3896
|
entry.c
|
DriverEntry
|
IOCTL …
|
|
680
|
\src\sys\driver
|
3636
|
3896
|
entry.c
|
DriverEntry
|
IOCTL …
|
|
681
|
\src\sys\driver
|
3636
|
3896
|
entry.c
|
DriverEntry
|
IOCTL …
|
|
1145
|
\src\sys\driver
|
3636
|
4960
|
entry.c
|
DriverEntry
|
IOCTL …
|
|
1153
|
\src\sys\driver
|
3636
|
4960
|
entry.c
|
DriverEntry
|
IOCTL …
|
|
1154
|
\src\sys\driver
|
3636
|
4960
|
entry.c
|
DriverEntry
|
IOCTL …
|
|
…
|
…
|
…
|
…
|
…
|
…
|
…
|
(*) A bit of digression. Looks like biology keeps giving insights into software, there is even a software phenotype metaphor albeit a bit restricted to code, I just thought that we need also an Extended Software Phenotype.
- Dmitry Vostokov @ DumpAnalysis.org + TraceAnalysis.org -
Posted in Citrix, Computer Science, Debugging, Mathematics of Debugging, Multithreading, New Words, Science of Software Tracing, Software Trace Analysis, Software Trace Visualization, Trace Analysis Patterns | 2 Comments »
Wednesday, December 23rd, 2009
Memorianity soon to publish its Testament with 7 microkernel prophecies, childhood universal memory dump visions of its founder, the recollection of a conversion and other supporting materials. This full color scripture is small to carry around:
Title: Memory Religion: A Testament
ISBN-13: 978-1906717476
Pages: 24
The cover image is an allegorical interpretation of the concept of the Original Defect:
- Dmitry Vostokov @ Memory Religion Portal -
Posted in Announcements, Art, Books, Intelligent Memory Movement, Memorian Art, Memory Dreams, Memory Religion (Memorianity), Memory Space Art, Memory Visualization, New Words, Philosophy, Publishing | No Comments »
Tuesday, December 8th, 2009
This is another description of a memoidealistic philosophical worldview that memory exists in everything, living and nonliving. In its even stronger form, panmemorism is also a theory that memory is a part of itself, thus adding an infinite element (see Memoidealism as Monistic Aspect Pluralism for some illustrations) and providing a foundation for perceived processes.
- Dmitry Vostokov @ DumpAnalysis.org -
Posted in Memoidealism, Memory Religion (Memorianity), New Words, Philosophy | 1 Comment »
Wednesday, November 11th, 2009
A nibble is a (0,1)-matrix, a byte is a cubic 0,1-lattice and the next cubic byte-boundary 0,1-lattice represents a 64-bit qword:

This is what I call a natural memory representation as memory building blocks or qubic memory (do not mistaken it with qubit memory). This elevates bytes and 64-bit quadruple words as natural addresses and shows that 32-bit addresses are unnatural.
This also allows to us to visualize certain overlapped memory patterns in dump files (same vertice, edge or side).
- Dmitry Vostokov @ DumpAnalysis.org -
Posted in Computer Science, Mathematics of Debugging, Memoretics, Memory Visualization, New Words, Science of Memory Dump Analysis | 2 Comments »