Archive for the ‘Tools’ Category
Friday, July 13th, 2012
For some time I was struggling with finding a good name for memory dump and software trace analysis activities. The name Memoretics I use for the science of memory dump analysis (that also incorporates software traces) seems not so good to describe the whole practical activity that should be transparent to everyone in IT. Fortunately, I timely understood that all these activities constitute the essence of software diagnostics that previously lacked any solid foundation. Thus, Software Diagnostics Institute was reborn from the previous Crash Dump Analysis Portal. This institute does pure and applied research and scientific activities and in recent years was funded mainly from OpenTask publisher and recently from Memory Dump Analysis Services. The latter company also recognized that the broadening of its commercial activities requires a new name. So, Software Diagnostics Services was reborn:
The First Comprehensive Software Diagnostics Service
- Dmitry Vostokov @ DumpAnalysis.org + TraceAnalysis.org -
Posted in Announcements, Cloud Memory Dump Analysis, Complete Memory Dump Analysis, Core Dump Analysis, Crash Analysis Report Environment (CARE), Crash Dump Analysis, Debugging, Debugging Bureau, Debugging Industry, Debugging Methodology, Debugging Today, Debugging Trends, Education, Education and Research, Escalation Engineering, Event Tracing for Windows (ETW), First Fault Software Diagnostics, Generative Debugging, JIT Crash Analysis, JIT Memory Space Analysis, Java Debugging, Kernel Development, Kernel Memory Dump Analysis, Linux Crash Corner, MFC Debugging, Mac Crash Corner, Mac OS X, Malware Analysis, Memoretics, Memory Analysis Forensics and Intelligence, Memory Analysis Report System, Memory Dump Analysis Methodology, Memory Dump Analysis Services, Minidump Analysis, New Debugging School, Pattern-Driven Debugging, Pattern-Driven Software Support, Performance Monitoring, Root Cause Analysis, SQL Debugging, Security, Software Debugging Services, Software Diagnostics, Software Diagnostics Institute, Software Diagnostics Services, Software Engineering, Software Problem Solving, Software Technical Support, Software Trace Analysis, Software Trace Analysis Report Environment (STARE), Tools, Training and Seminars, Troubleshooting Methodology, Unified Software Diagnostics, Windows 7, Windows 8, Windows Azure, Windows Mobile, Windows Server 2008, Windows System Administration, x64 Mac OS X, x64 Windows | No Comments »
Sunday, April 15th, 2012
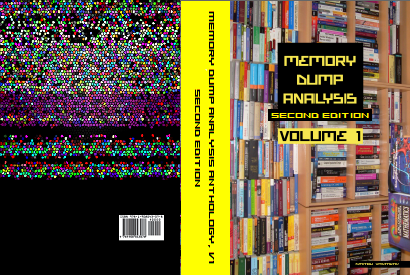
After 4 years in print this bestselling title needs an update to address minor changes, include extra examples and reference additional research published in Volumes 2, 3, 4, 5 and 6.
- Title: Memory Dump Analysis Anthology, Volume 1
- Author: Dmitry Vostokov
- Publisher: OpenTask (Summer 2012)
- Language: English
- Product Dimensions: 22.86 x 15.24
- Paperback: 800 pages
- ISBN-13: 978-1-908043-35-1
- Hardcover: 800 pages
- ISBN-13: 978-1-908043-36-8
The cover for both paperback and hardcover titles will also have a matte finish. We used A Memory Window artwork for the back cover.

- Dmitry Vostokov @ DumpAnalysis.org + TraceAnalysis.org -
Posted in Aesthetics of Memory Dumps, Announcements, AntiPatterns, Art, Assembly Language, Best Practices, Books, Bugchecks Depicted, C and C++, Complete Memory Dump Analysis, Computer Science, Crash Dump Analysis, Crash Dump Patterns, Crash Dumps for Dummies, Debugging, Debugging Methodology, Dr. Watson, Escalation Engineering, Fun with Crash Dumps, GDB for WinDbg Users, Hardware, Images of Computer Memory, Kernel Development, Mathematics of Debugging, Memiotics (Memory Semiotics), Memoretics, Memory Dump Analysis Methodology, Memory Space Art, Memory Space Music, Memory Visualization, Minidump Analysis, Multithreading, Pattern-Driven Debugging, Pattern-Driven Software Support, Publishing, Reference, Root Cause Analysis, Science of Memory Dump Analysis, Software Architecture, Software Behavior DNA, Software Behavior Patterns, Software Behavioral Genome, Software Diagnostics, Software Engineering, Software Technical Support, Stack Trace Collection, Testing, Tools, Troubleshooting Methodology, Vista, WinDbg Scripts, WinDbg Tips and Tricks, WinDbg for GDB Users, Windows 7, Windows Data Structures, Windows Server 2008, Windows System Administration, x64 Windows | No Comments »
Sunday, April 15th, 2012
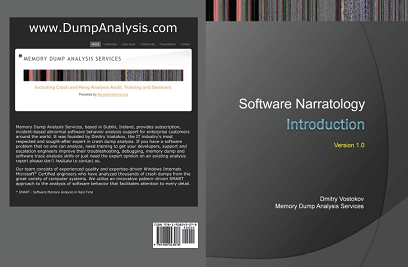
In a week this short full color book should appear in online bookstores:
- Title: Software Narratology: An Introduction to the Applied Science of Software Stories
- Authors: Dmitry Vostokov, Memory Dump Analysis Services
- Description: This is a transcript of Memory Dump Analysis Services Webinar about Software Narratology: an exciting new discipline and a field of research founded by DumpAnalysis.org. When software executes it gives us its stories in the form of UI events, software traces and logs. Such stories can be analyzed for their structure and patterns for troubleshooting, debugging and problem resolution purposes. Topics also include software narremes and their types, anticipatory software construction and software diagnostics.
- Publisher: OpenTask (April 2012)
- Language: English
- Product Dimensions: 28.0 x 21.6
- Paperback: 26 pages
- ISBN-13: 978-1908043078

- Dmitry Vostokov @ DumpAnalysis.org + TraceAnalysis.org -
Posted in Announcements, Books, CDF Analysis Tips and Tricks, Code Reading, Computer Science, Debugging, Debugging Methodology, Debugging Trends, Education and Research, Escalation Engineering, Event Tracing for Windows (ETW), Hermeneutics of Memory Dumps and Traces, Ideas, Narralog Programming Language, New Debugging School, Pattern-Driven Debugging, Pattern-Driven Software Support, Presentations, Publishing, Root Cause Analysis, SPDL, Science of Software Tracing, Software Behavior DNA, Software Behavior Patterns, Software Behavioral Genome, Software Diagnostics, Software Engineering, Software Narrative Fiction, Software Narrative Science, Software Narratology, Software Narremes, Software Problem Description Patterns, Software Problem Solving, Software Technical Support, Software Trace Analysis, Software Trace Analysis and History, Software Trace Deconstruction, Software Trace Linguistics, Software Trace Modeling, Software Trace Reading, Software Trace Visualization, Software Tracing Implementation Patterns, Software Troubleshooting Patterns, Structural Trace Patterns, Systems Thinking, Testing, Tools, Trace Analysis Patterns, Training and Seminars, Troubleshooting Methodology, UI Problem Analysis Patterns, Unified Debugging Patterns, Unified Software Diagnostics, Webinars | No Comments »
Monday, April 9th, 2012
Memory Dump Analysis Services organizes a free Webinar on Unified Software Diagnostics (USD) and the new scalable cost-effective software support model called Pattern-Driven Software Support devised to address various shortcomings in existing tiered software support organizations. Examples cover Windows, Mac OS and Linux.

Date: 22nd of June, 2012
Time: 17:00 (BST) 12:00 (EST) 09:00 (PST)
Duration: 60 minutes
Space is limited.
Reserve your Webinar seat now at:
https://www3.gotomeeting.com/register/172771078
- Dmitry Vostokov @ DumpAnalysis.org + TraceAnalysis.org -
Posted in Announcements, Best Practices, Crash Dump Analysis, Crash Dump Patterns, Debugging, Debugging Methodology, Debugging Trends, Economics, Escalation Engineering, Event Tracing for Windows (ETW), JIT Crash Analysis, JIT Memory Space Analysis, Malware Analysis, Malware Patterns, Memoretics, Memory Analysis Forensics and Intelligence, Memory Dump Analysis Methodology, Memory Dump Analysis Services, New Acronyms, New Debugging School, Pattern Prediction, Pattern-Driven Debugging, Pattern-Driven Software Support, Root Cause Analysis, Science of Memory Dump Analysis, Science of Software Tracing, Software Behavior DNA, Software Behavior Patterns, Software Behavioral Genome, Software Diagnostics, Software Engineering, Software Narratology, Software Problem Description Patterns, Software Problem Solving, Software Support Patterns, Software Technical Support, Software Trace Analysis, Software Troubleshooting Patterns, Software Victimology, Software and Economics, Structural Memory Patterns, Structural Trace Patterns, Systems Thinking, Testing, Tools, Trace Analysis Patterns, Training and Seminars, Troubleshooting Methodology, UI Problem Analysis Patterns, Unified Debugging Patterns, Unified Software Diagnostics, Victimware, Webinars, Workaround Patterns | No Comments »
Sunday, February 19th, 2012
Memory Dump Analysis Services (DumpAnalysis.com) organizes a free Webinar about software narratology: an application of ideas from narratology to software narrative stories.

Learn about this exciting new discipline and a field of research. When software executes it gives us its stories in the form of UI events, software traces and logs. Such stories can be analyzed for their structure and patterns for troubleshooting, debugging and problem resolution purposes.
Prerequisites: basic software troubleshooting and ability to read software generated logs.
Audience: anyone can benefit from this new perspective: from software users to software engineers and managers.
Space is limited.
Reserve your Webinar seat now at:
https://www3.gotomeeting.com/register/603136294
- Dmitry Vostokov @ DumpAnalysis.org + TraceAnalysis.org -
Posted in Announcements, Computer Science, Debugging, Escalation Engineering, Intelligence Analysis Patterns, Memory Dump Analysis Services, SPDL, Science of Software Tracing, Security, Software Behavior DNA, Software Behavior Patterns, Software Behavioral Genome, Software Engineering, Software Narrative Fiction, Software Narratology, Software Problem Description Patterns, Software Problem Solving, Software Technical Support, Software Trace Analysis, Software Trace Deconstruction, Software Trace Linguistics, Software Trace Modeling, Software Trace Reading, Software Trace Visualization, Software Tracing Implementation Patterns, Software Tracing for Dummies, Software Troubleshooting Patterns, Software Victimology, Structural Trace Patterns, Testing, Tools, Trace Analysis Patterns, Troubleshooting Methodology, UI Problem Analysis Patterns, Unified Debugging Patterns, Unit Testing, Victimware, Webinars, Windows System Administration | No Comments »
Sunday, February 19th, 2012
One of attendees of accelerated memory dump analysis training pointed me to the possible effects of -g option for AeDebug custom postmortem debugger command line for CDB, NTSD or WinDbg. So I tested that with x64 TestWER tool (should be the same with x86 version) and indeed there are differences.
With -g option with have this stack trace:
AeDebug\Debugger = "C:\Program Files\Debugging Tools for Windows (x64)\windbg.exe" -p %ld -e %ld -g
0:000> kL

Child-SP          RetAddr           Call Site

00000000`0012f210 00000001`40004148 TestWER64!CTestDefaultDebuggerDlg::OnBnClickedButton1+0x7e

00000000`0012f250 00000001`40004388 TestWER64!_AfxDispatchCmdMsg+0xc4

00000000`0012f280 00000001`40003552 TestWER64!CCmdTarget::OnCmdMsg+0x180

00000000`0012f2e0 00000001`4000cc44 TestWER64!CDialog::OnCmdMsg+0x32

00000000`0012f320 00000001`4000d877 TestWER64!CWnd::OnCommand+0xcc

00000000`0012f3b0 00000001`40008c2c TestWER64!CWnd::OnWndMsg+0x5f

00000000`0012f4f0 00000001`4000c272 TestWER64!CWnd::WindowProc+0x38

00000000`0012f530 00000001`4000c32d TestWER64!AfxCallWndProc+0xfe

00000000`0012f5d0 00000000`77519bd1 TestWER64!AfxWndProc+0x59

00000000`0012f610 00000000`77516aa8 USER32!UserCallWinProcCheckWow+0x1ad

00000000`0012f6d0 00000000`77516bad USER32!SendMessageWorker+0x682

00000000`0012f760 000007fe`fccb0bbf USER32!SendMessageW+0x5c

00000000`0012f7b0 000007fe`fccb47df COMCTL32!Button_ReleaseCapture+0x157

00000000`0012f7f0 00000000`77519bd1 COMCTL32!Button_WndProc+0xcbf

00000000`0012f8b0 00000000`775198da USER32!UserCallWinProcCheckWow+0x1ad

00000000`0012f970 00000000`775167c2 USER32!DispatchMessageWorker+0x3b5

00000000`0012f9f0 00000001`400079cc USER32!IsDialogMessageW+0x153

00000000`0012fa80 00000001`40009148 TestWER64!CWnd::IsDialogMessageW+0x38

00000000`0012fab0 00000001`40003513 TestWER64!CWnd::PreTranslateInput+0x28

00000000`0012fae0 00000001`4000b696 TestWER64!CDialog::PreTranslateMessage+0xc3

00000000`0012fb10 00000001`40004c1f TestWER64!CWnd::WalkPreTranslateTree+0x3a

00000000`0012fb40 00000001`40004c7f TestWER64!AfxInternalPreTranslateMessage+0x67

00000000`0012fb70 00000001`40004e26 TestWER64!AfxPreTranslateMessage+0x23

00000000`0012fba0 00000001`40004e6b TestWER64!AfxInternalPumpMessage+0x3a

00000000`0012fbd0 00000001`4000aba6 TestWER64!AfxPumpMessage+0x1b

00000000`0012fc00 00000001`40003e4a TestWER64!CWnd::RunModalLoop+0xea

00000000`0012fc60 00000001`40024da4 TestWER64!CDialog::DoModal+0x1c6

00000000`0012fd10 00000001`40024625 TestWER64!CTestDefaultDebuggerApp::InitInstance+0xc4

00000000`0012fe70 00000001`400153c2 TestWER64!AfxWinMain+0x75

00000000`0012feb0 00000000`77ad652d TestWER64!__tmainCRTStartup+0x186

00000000`0012ff60 00000000`77c0c521 kernel32!BaseThreadInitThunk+0xd

00000000`0012ff90 00000000`00000000 ntdll!RtlUserThreadStart+0x1d
0:000> r

rax=0000000000000000 rbx=0000000000000001 rcx=000000000012fd50

rdx=00000000000003e8 rsi=000000000012fd50 rdi=000000014002daa0

rip=00000001400247ae rsp=000000000012f210 rbp=0000000000000111

r8=0000000000000000  r9=0000000140024730 r10=0000000140024730

r11=000000000012f310 r12=0000000000000000 r13=00000000000003e8

r14=0000000000000110 r15=0000000000000001

iopl=0         nv up ei pl zr na po nc

cs=0033  ss=002b  ds=002b  es=002b  fs=0053  gs=002b             efl=00010244

TestWER64!CTestDefaultDebuggerDlg::OnBnClickedButton1+0x7e:

00000001`400247ae c704250000000000000000 mov dword ptr [0],0 ds:00000000`00000000=????????
Without -g option we also see exception processing (highlighted in red):
AeDebugger\Debugger = "C:\Program Files\Debugging Tools for Windows (x64)\windbg.exe" -p %ld -e %ld
0:000> kL

Child-SP          RetAddr           Call Site

00000000`0012e368 000007fe`fe301420 ntdll!ZwWaitForMultipleObjects+0xa

00000000`0012e370 00000000`77ae2cf3 KERNELBASE!WaitForMultipleObjectsEx+0xe8

00000000`0012e470 00000000`77b590f5 kernel32!WaitForMultipleObjectsExImplementation+0xb3

00000000`0012e500 00000000`77b59277 kernel32!WerpReportFaultInternal+0×215

00000000`0012e5a0 00000000`77b592cf kernel32!WerpReportFault+0×77

00000000`0012e5d0 00000000`77b594ec kernel32!BasepReportFault+0×1f

00000000`0012e600 00000000`77c743b8 kernel32!UnhandledExceptionFilter+0×1fc

00000000`0012e6e0 00000000`77bf85a8 ntdll! ?? ::FNODOBFM::`string’+0×2365

00000000`0012e710 00000000`77c09d0d ntdll!_C_specific_handler+0×8c

00000000`0012e780 00000000`77bf91af ntdll!RtlpExecuteHandlerForException+0xd

00000000`0012e7b0 00000000`77c31278 ntdll!RtlDispatchException+0×45a

00000000`0012ee90 00000001`400247ae ntdll!KiUserExceptionDispatcher+0×2e

00000000`0012f450 00000001`40004148 TestWER64!CTestDefaultDebuggerDlg::OnBnClickedButton1+0×7e

00000000`0012f490 00000001`40004388 TestWER64!_AfxDispatchCmdMsg+0xc4

00000000`0012f4c0 00000001`40003552 TestWER64!CCmdTarget::OnCmdMsg+0×180

00000000`0012f520 00000001`4000cc44 TestWER64!CDialog::OnCmdMsg+0×32

00000000`0012f560 00000001`4000d877 TestWER64!CWnd::OnCommand+0xcc

00000000`0012f5f0 00000001`40008c2c TestWER64!CWnd::OnWndMsg+0×5f

00000000`0012f730 00000001`4000c272 TestWER64!CWnd::WindowProc+0×38

00000000`0012f770 00000001`4000c32d TestWER64!AfxCallWndProc+0xfe

00000000`0012f810 00000000`77519bd1 TestWER64!AfxWndProc+0×59

00000000`0012f850 00000000`77516aa8 USER32!UserCallWinProcCheckWow+0×1ad

00000000`0012f910 00000000`77516bad USER32!SendMessageWorker+0×682

00000000`0012f9a0 00000000`7751eda7 USER32!SendMessageW+0×5c

00000000`0012f9f0 00000001`400079cc USER32!IsDialogMessageW+0×85f

00000000`0012fa80 00000001`40009148 TestWER64!CWnd::IsDialogMessageW+0×38

00000000`0012fab0 00000001`40003513 TestWER64!CWnd::PreTranslateInput+0×28

00000000`0012fae0 00000001`4000b696 TestWER64!CDialog::PreTranslateMessage+0xc3

00000000`0012fb10 00000001`40004c1f TestWER64!CWnd::WalkPreTranslateTree+0×3a

00000000`0012fb40 00000001`40004c7f TestWER64!AfxInternalPreTranslateMessage+0×67

00000000`0012fb70 00000001`40004e26 TestWER64!AfxPreTranslateMessage+0×23

00000000`0012fba0 00000001`40004e6b TestWER64!AfxInternalPumpMessage+0×3a

00000000`0012fbd0 00000001`4000aba6 TestWER64!AfxPumpMessage+0×1b

00000000`0012fc00 00000001`40003e4a TestWER64!CWnd::RunModalLoop+0xea

00000000`0012fc60 00000001`40024da4 TestWER64!CDialog::DoModal+0×1c6

00000000`0012fd10 00000001`40024625 TestWER64!CTestDefaultDebuggerApp::InitInstance+0xc4

00000000`0012fe70 00000001`400153c2 TestWER64!AfxWinMain+0×75

00000000`0012feb0 00000000`77ad652d TestWER64!__tmainCRTStartup+0×186

00000000`0012ff60 00000000`77c0c521 kernel32!BaseThreadInitThunk+0xd

00000000`0012ff90 00000000`00000000 ntdll!RtlUserThreadStart+0×1d
I now prefer omitting -g option to get stack traces equivalent to manual crash dumps saved by userdump.exe on pre-Vista platforms and Task Manager on later platforms.
- Dmitry Vostokov @ DumpAnalysis.org + TraceAnalysis.org -
Posted in .NET Debugging, Crash Dump Analysis, Debugging, Tools, WinDbg Tips and Tricks, x64 Windows | No Comments »
Sunday, December 18th, 2011
This is the first initiative for the year of software trace analysis: the first and unique software trace and log analysis training based entirely on patterns of software behavior. No longer you will be frustrated when opening a software trace with millions of messages from hundreds of software components, threads and processes.
Memory Dump Analysis Services (DumpAnalysis.com) organizes a training course:
Learn how to efficiently and effectively analyze software traces and logs from complex software environments. Covered popular software logs and trace formats from Microsoft and Citrix products and tools including Event Tracing for Windows (ETW) and Citrix Common Diagnostics Format (CDF). Learn how to use pioneering and innovative pattern-driven software problem behavior analysis to troubleshoot and debug software incidents.
If your are registered you are allowed to optionally submit your software traces and logs before the training. This will allow us in addition to the carefully constructed problems tailor additional examples to the needs of the attendees.
The training consists of 2 two-hour sessions and additional homework exercises. When you finish the training you additionally get:
- A full transcript in PDF format (retail price $200)
- 6 volumes of Memory Dump Analysis Anthology in PDF format (retail price $120)
- A personalized attendance certificate with unique CID (PDF format)
- Free Dump Analysis World Network membership including updates to full PDF transcript Q&A section
Prerequisites: Basic Windows troubleshooting.
Audience: Software technical support and escalation engineers, software maintenance engineers, system administrators.
Session 1: October 12, 2012 4:00 PM - 6:00 PM BST
Session 2: October 15, 2012 4:00 PM - 6:00 PM BST
Price: 210 USD
Space is limited.
Reserve your remote training seat now at:
https://student.gototraining.com/r/5287623225237732608

- Dmitry Vostokov @ DumpAnalysis.org + TraceAnalysis.org -
Posted in Announcements, CDF Analysis Tips and Tricks, Debugging, Software Technical Support, Software Trace Analysis, Software Trace Reading, Tools, Trace Analysis Patterns, Training and Seminars, Troubleshooting Methodology, Windows System Administration | No Comments »
Sunday, December 11th, 2011
When doing software behavior artifact collection, live debugging or postmortem memory dump analysis we must also take into consideration the possibility of Debugger Bugs. I classify them into hard and soft bugs. The former are those software defects and behavioral problems that result in further abnormal software behavior incidents like crashes and hangs. One example is this Microsoft KB article about DebugDiag. Soft debugger bugs usually manifest themselves as glitches in data output, nonsense or false positive diagnostics, for example, this excessive non-paged pool usage message in the output from !vm WinDbg command (see the corresponding MS KB article):
1: kd> !vm
*** Virtual Memory Usage ***

Physical Memory:     1031581 (   4126324 Kb)

Page File: \??\C:\pagefile.sys

Current:   4433524 Kb  Free Space:   4433520 Kb

Minimum:   4433524 Kb  Maximum:     12378972 Kb

Unimplemented error for MiSystemVaTypeCount

Available Pages:      817652 (   3270608 Kb)

ResAvail Pages:       965229 (   3860916 Kb)

Locked IO Pages:           0 (         0 Kb)

Free System PTEs:   33555714 ( 134222856 Kb)

Modified Pages:        15794 (     63176 Kb)

Modified PF Pages:     15793 (     63172 Kb)

NonPagedPool Usage: 88079121 ( 352316484 Kb)

NonPagedPoolNx Usage:  12885 (     51540 Kb)

NonPagedPool Max:     764094 (   3056376 Kb)

********** Excessive NonPaged Pool Usage *****

PagedPool 0 Usage:     35435 (    141740 Kb)

PagedPool 1 Usage:      3620 (     14480 Kb)

PagedPool 2 Usage:       573 (      2292 Kb)

PagedPool 3 Usage:       535 (      2140 Kb)

PagedPool 4 Usage:       538 (      2152 Kb)

PagedPool Usage:       40701 (    162804 Kb)

PagedPool Maximum:  33554432 ( 134217728 Kb)

Session Commit:         9309 (     37236 Kb)

Shared Commit:          6460 (     25840 Kb)

Special Pool:              0 (         0 Kb)

Shared Process:         5760 (     23040 Kb)

PagedPool Commit:      40765 (    163060 Kb)

Driver Commit:          2805 (     11220 Kb)

Committed pages:      212472 (    849888 Kb)

Commit limit:        2139487 (   8557948 Kb)
- Dmitry Vostokov @ DumpAnalysis.org + TraceAnalysis.org -
Posted in Crash Dump Analysis, Crash Dump Patterns, Debugging, Live Debugging, Software Behavior Patterns, Tools | 7 Comments »
Monday, December 5th, 2011
On the portal I published my vision of software tools as a service in the context of post-construction software problem solving. The main part is software problem description language (SPDL) which was previously introduced as Riemann programming language. I have decided to keep the name.
- Dmitry Vostokov @ DumpAnalysis.org + TraceAnalysis.org -
Posted in Announcements, Debugging, Debugging Methodology, Riemann Programming Language, SPDL, Software Problem Solving, Software Technical Support, TaaS, Tool Objects, Tools | No Comments »
Sunday, November 13th, 2011
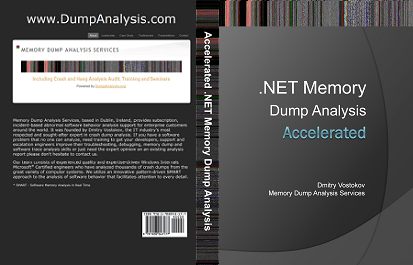
During the previous several months some companies and individuals expressed their interest in the training (the next one is scheduled for January) but its time was not suitable due to different geographic time zones. So I have decided to publish this training in a book format (currently in PDF) and make it available in paperback on Amazon and B&N later. Book details:
- Title: Accelerated .NET Memory Dump Analysis: Training Course Transcript and WinDbg Practice Exercises with Notes
- Description: The full transcript of Memory Dump Analysis Services Training with 7 step-by-step exercises, notes, source code of specially created modeling applications and selected Q&A. Covers 20 .NET memory dump analysis patterns plus additional unmanaged patterns.
- Authors: Dmitry Vostokov, Memory Dump Analysis Services
- Publisher: OpenTask (November 2011)
- Language: English
- Product Dimensions: 28.0 x 21.6
- Paperback: 204 pages
- ISBN-13: 978-1908043320

Table of Contents
Now available for sale in PDF format from Memory Dump Analysis Services.
- Dmitry Vostokov @ DumpAnalysis.org + TraceAnalysis.org -
Posted in .NET Debugging, Announcements, Books, Crash Dump Analysis, Crash Dump Patterns, Debugging, Escalation Engineering, Medicine, Memory Dump Analysis Services, Publishing, Software Engineering, Software Technical Support, Testing, Tools, Training and Seminars, WinDbg Tips and Tricks | No Comments »
Friday, November 11th, 2011
One of the new initiatives for 2012 is the development of SPDL (Software Problem Description Language). Its purpose is automatic generation of a software troubleshooting tool(s) based on the description of a problem. Here software problem means a post-construction problem as outlined in Introduction to Pattern-Driven Software Problem Solving. The tool construction will utilize an expanded set of DebugWare and Workaround patterns together with the refind version of RADII software development process. This will also provide necessary effectiveness, efficiency and enhanced problem solving capabilities to existing TaaS (Tools as a Service) implementations that are limited in the number of tools they offer.
- Dmitry Vostokov @ DumpAnalysis.org + TraceAnalysis.org -
Posted in Announcements, Computer Science, Crash Dump Analysis, DebugWare Patterns, Debugging, Generative Debugging, New Acronyms, New Debugging School, SPDL, Software Behavior DNA, Software Behavior Patterns, Software Behavioral Genome, Software Engineering, Software Problem Solving, Software Technical Support, Software Trace Analysis, Software Troubleshooting Patterns, Software and Modeling, TaaS, Testing, Tool Objects, Tools, Troubleshooting Methodology, Unified Debugging Patterns, Windows System Administration | No Comments »
Thursday, November 3rd, 2011
The new 6th volume contains revised, edited, cross-referenced, and thematically organized selected DumpAnalysis.org blog posts about memory dump and software trace analysis, software troubleshooting and debugging written in November 2010 - October 2011 for software engineers developing and maintaining products on Windows platforms, quality assurance engineers testing software on Windows platforms, technical support and escalation engineers dealing with complex software issues, and security researchers, malware analysts and reverse engineers. The sixth volume features:
- 56 new crash dump analysis patterns including 14 new .NET memory dump analysis patterns
- 4 new pattern interaction case studies
- 11 new trace analysis patterns
- New Debugware pattern
- Introduction to UI problem analysis patterns
- Introduction to intelligence analysis patterns
- Introduction to unified debugging pattern language
- Introduction to generative debugging, metadefect template library and DNA of software behaviour
- The new school of debugging and trends
- .NET memory dump analysis checklist
- Software trace analysis checklist
- Introduction to close and deconstructive readings of a software trace
- Memory dump analysis compass
- Computical and Stack Trace Art
- The abductive reasoning of Philip Marlowe
- Orbifold memory space and cloud computing
- Memory worldview
- Interpretation of cyberspace
- Relationship of memory dumps to religion
- Fully cross-referenced with Volume 1, Volume 2, Volume 3, Volume 4, and Volume 5
Product information:
- Title: Memory Dump Analysis Anthology, Volume 6
- Author: Dmitry Vostokov
- Language: English
- Product Dimensions: 22.86 x 15.24
- Paperback: 300 pages
- Publisher: Opentask (December 2011)
- ISBN-13: 978-1-908043-19-1
- Hardcover: 300 pages
- Publisher: Opentask (January 2012)
- ISBN-13: 978-1-908043-20-7

Back cover features 3d memory space visualization image created with ParaView.
- Dmitry Vostokov @ DumpAnalysis.org + TraceAnalysis.org -
Posted in .NET Debugging, Announcements, Art, Books, Cloud Computing, Cloud Memory Dump Analysis, Common Mistakes, Complete Memory Dump Analysis, Computer Science, Computicart (Computical Art), Crash Dump Analysis, Crash Dump Patterns, Cyber Intelligence, Cyber Problems, Cyber Security, Cyber Space, Cyber Warfare, DebugWare Patterns, Debugging, Debugging Industry, Debugging Methodology, Debugging Slang, Debugging Trends, Escalation Engineering, Generative Debugging, Intelligence Analysis Patterns, Kernel Development, Memoidealism, Memoretics, Memory Visualization, Metadefect Template Library, New Debugging School, Philosophy, Physicalist Art, Publishing, Root Cause Analysis, Science of Memory Dump Analysis, Science of Software Tracing, Security, Software Behavior DNA, Software Behavior Patterns, Software Behavioral Genome, Software Engineering, Software Narratology, Software Technical Support, Software Trace Analysis, Software Trace Deconstruction, Software Trace Reading, Software Victimology, Testing, The Way of Philip Marlowe, Tools, Trace Analysis Patterns, Training and Seminars, Troubleshooting Methodology, UI Problem Analysis Patterns, Unified Debugging Patterns, Victimware, WinDbg Tips and Tricks, Windows 7, Windows Azure, Windows Data Structures, Windows Server 2008, Windows System Administration, x64 Windows | No Comments »
Wednesday, September 21st, 2011
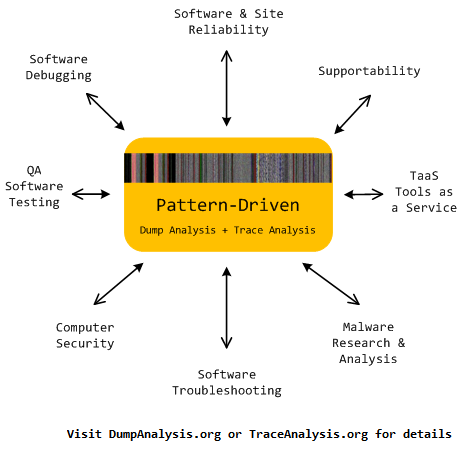
Memoretics promotes pattern-driven memory dump and software trace analysis which has many uses but not limited to:
- Software and site reliability
- Software Debugging
- QA and Software Testing
- Computer Security
- Software Troubleshooting
- Malware Research and Analysis
- Tools as a Service (TaaS)
- Supportability
- Software Diagnostics

- Dmitry Vostokov @ DumpAnalysis.org + TraceAnalysis.org -
Posted in Cloud Memory Dump Analysis, Computer Forensics, Crash Dump Analysis, Crash Dump Patterns, DebugWare Patterns, Debugging, Debugging Trends, Escalation Engineering, Malware Analysis, Malware Patterns, Memiotics (Memory Semiotics), Memoretics, Memory Analysis Forensics and Intelligence, Metadefect Template Library, Metamalware, Pattern Models, Pattern Prediction, Reverse Engineering, Root Cause Analysis, Science of Memory Dump Analysis, Science of Software Tracing, Security, Software Behavior DNA, Software Behavior Patterns, Software Behavioral Genome, Software Defect Construction, Software Engineering, Software Generalist, Software Narratology, Software Support Patterns, Software Technical Support, Software Trace Analysis, Software Troubleshooting Patterns, Structural Memory Patterns, Structural Trace Patterns, Systems Thinking, Testing, Tools, Trace Analysis Patterns, Troubleshooting Methodology, UI Problem Analysis Patterns, Unified Debugging Patterns, Victimware, Windows System Administration, Workaround Patterns | No Comments »
Wednesday, September 21st, 2011
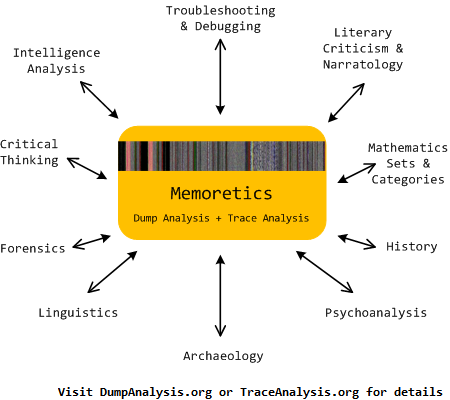
Memoretics as a science of memory snapshots borrows many ideas from the following disciplines (the list is not exhaustive):
- Troubleshooting and Debugging
- Intelligence Analysis
- Critical Thinking
- Forensics
- Linguistics
- Archaeology
- Psychoanalysis
- History
- Mathematics: Sets and Categories
- Literary Criticism and Narratology
It also contributes many ideas back. The following diagram depicts such an interaction:

- Dmitry Vostokov @ DumpAnalysis.org + TraceAnalysis.org -
Posted in Archaeology of Computer Memory, Categorical Debugging, Computer Forensics, Computer Science, Countefactual Debugging, Crash Dump Analysis, Crash Dump De-analysis, Crash Dump Patterns, Debugging, Debugging Methodology, Dublin School of Security, Education and Research, Escalation Engineering, General Memory Analysis, Generative Debugging, Hermeneutics of Memory Dumps and Traces, History, Intelligence Analysis Patterns, M->analysis, Malware Analysis, Malware Patterns, Mathematics of Debugging, Memiotics (Memory Semiotics), Memoretics, Memory Analysis Forensics and Intelligence, Memory Dump Analysis and History, Memory Systems Language, Memory Visualization, Metadefect Template Library, Metamalware, New Debugging School, Paleo-debugging, Pattern Models, Pattern Prediction, Psychoanalysis of Software Maintenance and Support, Psychology, Reverse Engineering, Root Cause Analysis, Science of Memory Dump Analysis, Science of Software Tracing, Security, Software Architecture, Software Behavior DNA, Software Behavior Patterns, Software Behavioral Genome, Software Chorography, Software Chorology, Software Defect Construction, Software Engineering, Software Narratology, Software Technical Support, Software Trace Analysis, Software Trace Analysis and History, Software Trace Deconstruction, Software Trace Linguistics, Software Trace Reading, Software Trace Visualization, Software Tracing Implementation Patterns, Software Troubleshooting Patterns, Software Victimology, Software and History, Structural Memory Analysis and Social Sciences, Structural Memory Patterns, Structural Trace Patterns, Systems Thinking, Testing, Tools, Trace Analysis Patterns, Troubleshooting Methodology, UI Problem Analysis Patterns, Unified Debugging Patterns, Victimware, Virtualization, Visual Dump Analysis, Workaround Patterns | No Comments »
Sunday, August 7th, 2011
During the previous several months many people expressed their interest in the training (the next one is scheduled for November) but its time was not suitable due to the very different geographic time zones. So I have decided to publish this training in book format (currently in PDF) and make it available in paperback on Amazon and B&N later. Book details:
- Title: Accelerated Windows Memory Dump Analysis: Training Course Transcript and WinDbg Practice Exercises with Notes
- Description: The full transcript of Memory Dump Analysis Services Training with 21 step-by-step exercises, notes, source code of specially created modeling applications and selected Q&A. Covers about 50 crash dump analysis patterns from process, kernel and complete memory dumps.
- Authors: Dmitry Vostokov, Memory Dump Analysis Services
- Publisher: OpenTask (August 2011)
- Language: English
- Product Dimensions: 28.0 x 21.6
- Paperback: 360 pages
- ISBN-13: 978-1908043290

Table of Contents
Now available for sale in PDF format from Memory Dump Analysis Services.
- Dmitry Vostokov @ DumpAnalysis.org + TraceAnalysis.org -
Posted in Announcements, Books, Complete Memory Dump Analysis, Crash Dump Analysis, Crash Dump Patterns, Escalation Engineering, Memory Dump Analysis Services, Publishing, Software Technical Support, Testing, Tools, Training and Seminars, Vista, WinDbg Tips and Tricks, Windows 7, Windows Server 2008, Windows System Administration, x64 Windows | No Comments »
Saturday, August 6th, 2011
Due to popular demand (the previous training was fully booked) Memory Dump Analysis Services scheduled the next training sessions.
Learn how to analyze application, service and system crashes and freezes, navigate through memory dump space and diagnose heap corruption, memory leaks, CPU spikes, blocked threads, deadlocks, wait chains, and much more. We use a unique and innovative pattern-driven analysis approach to speed up the learning curve. The training consists of more than 20 practical step-by-step exercises using WinDbg highlighting more than 50 patterns diagnosed in 32-bit and 64-bit process, kernel and complete memory dumps.
Public preview (selected slides) of the previous training

Memory Dump Analysis Services organizes a training course.
If you are registered you are allowed to optionally submit your memory dumps before the training. This will allow us in addition to the carefully constructed problems tailor extra examples to the needs of the attendees.
The training consists of 4 two-hour sessions (2 hours every day). When you finish the training you additionally get:
- A full transcript in PDF format (retail price $200)
- 5 volumes of Memory Dump Analysis Anthology in PDF format (retail price $100)
- A personalized attendance certificate with unique CID (PDF format)
Prerequisites: Basic Windows troubleshooting
Session 1: November 1, 2011 4:00 PM - 6:00 PM GMT
Session 2: November 2, 2011 4:00 PM - 6:00 PM GMT
Session 3: November 3, 2011 4:00 PM - 6:00 PM GMT
Session 4: November 4, 2011 4:00 PM - 6:00 PM GMT
Price: 210 USD
Space is limited.
Reserve your remote training seat now.
If scheduled dates or time are not suitable for you Memory Dump Analysis Services offers the same training in book format.
Training testimonials:
I would like to thank you and recommend your training. I think that the “Accelerated Windows Memory Dump Analysis” training is a pin-point, well taught training. I think it’s the leading training in the dump analysis area and I’ve enjoyed it, the books and materials are very detailed and well written and Dmitry answered all of the needed question. In addition after the training Dmitry sent a PDF with written answers and more information about the questions that were asked. I will give this training 5/5. Thank you Dmitry.
Yaniv Miron, Security Researcher, IL.Hack
- Dmitry Vostokov @ DumpAnalysis.org + TraceAnalysis.org -
Posted in Announcements, Complete Memory Dump Analysis, Crash Dump Analysis, Crash Dump Patterns, Escalation Engineering, Memory Dump Analysis Services, Multithreading, Software Technical Support, Testing, Tools, Training and Seminars, Vista, WinDbg Tips and Tricks, Windows 7, Windows Server 2008, Windows System Administration, x64 Windows | No Comments »
Thursday, June 16th, 2011
To generate crash dumps for my recent presentation The Old New Crash: Cloud Memory Dump Analysis I created the tool similar to TestWER. It is a .NET worker service role for Windows Azure that does a NULL pointer assignment. Here is a source code from WorkerRole.cs (I left EnableCollection twice just in case :-)):
using System;

using System.Collections.Generic;

using System.Diagnostics;

using System.Linq;

using System.Net;

using System.Threading;

using Microsoft.WindowsAzure;

using Microsoft.WindowsAzure.Diagnostics;

using Microsoft.WindowsAzure.ServiceRuntime;

using Microsoft.WindowsAzure.StorageClient;

using Microsoft.WindowsAzure.Diagnostics.Management;
namespace TestWAERWorker

{

public class WorkerRole : RoleEntryPoint

{

public override void Run()

{

Trace.WriteLine("TestWAERWorker entry point called", "Information");
Thread.Sleep(60000);
            unsafe

{

int* p = null;

*p = 1;

};
            while (true)

{

Thread.Sleep(10000);

Trace.WriteLine("Working", "Information");

}

}
        public override bool OnStart()

{

// Set the maximum number of concurrent connections

ServicePointManager.DefaultConnectionLimit = 12;
CrashDumps.EnableCollection(true);
            DiagnosticMonitorConfiguration config = DiagnosticMonitor.GetDefaultInitialConfiguration();

string conn_str = RoleEnvironment.GetConfigurationSettingValue("Microsoft.WindowsAzure.Plugins. Diagnostics.ConnectionString");

CloudStorageAccount account = CloudStorageAccount.Parse(conn_str);

config.Directories.ScheduledTransferPeriod = TimeSpan.FromMinutes(1);

DiagnosticMonitor diagnosticMonitor = DiagnosticMonitor.Start(account, config);
CrashDumps.EnableCollection(true);
            return base.OnStart();

}

}

}
The following forum discussion really helped me to get things right: http://stackoverflow.com/questions/5727692/azure-crash-dumps-not-appearing. So I’d like to thank Oliver Bock here.
If you want to deploy it to Windows Azure then don’t forget to add your storage account name and its key in the service configuration file. For your development environment you will need to replace the whole value with “UseDevelopmentStorage=true”. The full case study with detailed steps is forthcoming.
You can download the package from here: TestWAER.zip
- Dmitry Vostokov @ DumpAnalysis.org + TraceAnalysis.org -
Posted in .NET Debugging, Announcements, Cloud Memory Dump Analysis, Crash Dump Analysis, Debugging, Memory Dump Analysis Services, Presentations, Software Technical Support, Tools, Webinars, Windows Azure | No Comments »
Saturday, May 21st, 2011
Posted in Announcements, Debugging, EasyDbg, Memory Analysis Forensics and Intelligence, New Acronyms, Software Trace Analysis, Software Trace Reading, Tool Objects, Tools, Trace Analysis Patterns | No Comments »
Sunday, May 15th, 2011
Presentation Software Trace and Memory Dump Analysis: Patterns, Tools, Processes and Best Practices from E2E Virtualization Conference (13th of May, 2011) is available for download:
http://www.dumpanalysis.com/STMDA-materials
- Dmitry Vostokov @ DumpAnalysis.org + TraceAnalysis.org -
Posted in Announcements, Debugging, Debugging Methodology, Escalation Engineering, Presentations, Root Cause Analysis, Software Behavior Patterns, Software Technical Support, Software Trace Analysis, Software Trace Reading, Tools, Trace Analysis Patterns, Training and Seminars, Troubleshooting Methodology | No Comments »
