Archive for the ‘Unified Debugging Patterns’ Category
Sunday, April 15th, 2012
In a week this short full color book should appear in online bookstores:
- Title: Software Narratology: An Introduction to the Applied Science of Software Stories
- Authors: Dmitry Vostokov, Memory Dump Analysis Services
- Description: This is a transcript of Memory Dump Analysis Services Webinar about Software Narratology: an exciting new discipline and a field of research founded by DumpAnalysis.org. When software executes it gives us its stories in the form of UI events, software traces and logs. Such stories can be analyzed for their structure and patterns for troubleshooting, debugging and problem resolution purposes. Topics also include software narremes and their types, anticipatory software construction and software diagnostics.
- Publisher: OpenTask (April 2012)
- Language: English
- Product Dimensions: 28.0 x 21.6
- Paperback: 26 pages
- ISBN-13: 978-1908043078

- Dmitry Vostokov @ DumpAnalysis.org + TraceAnalysis.org -
Posted in Announcements, Books, CDF Analysis Tips and Tricks, Code Reading, Computer Science, Debugging, Debugging Methodology, Debugging Trends, Education and Research, Escalation Engineering, Event Tracing for Windows (ETW), Hermeneutics of Memory Dumps and Traces, Ideas, Narralog Programming Language, New Debugging School, Pattern-Driven Debugging, Pattern-Driven Software Support, Presentations, Publishing, Root Cause Analysis, SPDL, Science of Software Tracing, Software Behavior DNA, Software Behavior Patterns, Software Behavioral Genome, Software Diagnostics, Software Engineering, Software Narrative Fiction, Software Narrative Science, Software Narratology, Software Narremes, Software Problem Description Patterns, Software Problem Solving, Software Technical Support, Software Trace Analysis, Software Trace Analysis and History, Software Trace Deconstruction, Software Trace Linguistics, Software Trace Modeling, Software Trace Reading, Software Trace Visualization, Software Tracing Implementation Patterns, Software Troubleshooting Patterns, Structural Trace Patterns, Systems Thinking, Testing, Tools, Trace Analysis Patterns, Training and Seminars, Troubleshooting Methodology, UI Problem Analysis Patterns, Unified Debugging Patterns, Unified Software Diagnostics, Webinars | No Comments »
Monday, April 9th, 2012
Memory Dump Analysis Services organizes a free Webinar on Unified Software Diagnostics (USD) and the new scalable cost-effective software support model called Pattern-Driven Software Support devised to address various shortcomings in existing tiered software support organizations. Examples cover Windows, Mac OS and Linux.

Date: 22nd of June, 2012
Time: 17:00 (BST) 12:00 (EST) 09:00 (PST)
Duration: 60 minutes
Space is limited.
Reserve your Webinar seat now at:
https://www3.gotomeeting.com/register/172771078
- Dmitry Vostokov @ DumpAnalysis.org + TraceAnalysis.org -
Posted in Announcements, Best Practices, Crash Dump Analysis, Crash Dump Patterns, Debugging, Debugging Methodology, Debugging Trends, Economics, Escalation Engineering, Event Tracing for Windows (ETW), JIT Crash Analysis, JIT Memory Space Analysis, Malware Analysis, Malware Patterns, Memoretics, Memory Analysis Forensics and Intelligence, Memory Dump Analysis Methodology, Memory Dump Analysis Services, New Acronyms, New Debugging School, Pattern Prediction, Pattern-Driven Debugging, Pattern-Driven Software Support, Root Cause Analysis, Science of Memory Dump Analysis, Science of Software Tracing, Software Behavior DNA, Software Behavior Patterns, Software Behavioral Genome, Software Diagnostics, Software Engineering, Software Narratology, Software Problem Description Patterns, Software Problem Solving, Software Support Patterns, Software Technical Support, Software Trace Analysis, Software Troubleshooting Patterns, Software Victimology, Software and Economics, Structural Memory Patterns, Structural Trace Patterns, Systems Thinking, Testing, Tools, Trace Analysis Patterns, Training and Seminars, Troubleshooting Methodology, UI Problem Analysis Patterns, Unified Debugging Patterns, Unified Software Diagnostics, Victimware, Webinars, Workaround Patterns | No Comments »
Sunday, February 19th, 2012
Memory Dump Analysis Services (DumpAnalysis.com) organizes a free Webinar about software narratology: an application of ideas from narratology to software narrative stories.

Learn about this exciting new discipline and a field of research. When software executes it gives us its stories in the form of UI events, software traces and logs. Such stories can be analyzed for their structure and patterns for troubleshooting, debugging and problem resolution purposes.
Prerequisites: basic software troubleshooting and ability to read software generated logs.
Audience: anyone can benefit from this new perspective: from software users to software engineers and managers.
Space is limited.
Reserve your Webinar seat now at:
https://www3.gotomeeting.com/register/603136294
- Dmitry Vostokov @ DumpAnalysis.org + TraceAnalysis.org -
Posted in Announcements, Computer Science, Debugging, Escalation Engineering, Intelligence Analysis Patterns, Memory Dump Analysis Services, SPDL, Science of Software Tracing, Security, Software Behavior DNA, Software Behavior Patterns, Software Behavioral Genome, Software Engineering, Software Narrative Fiction, Software Narratology, Software Problem Description Patterns, Software Problem Solving, Software Technical Support, Software Trace Analysis, Software Trace Deconstruction, Software Trace Linguistics, Software Trace Modeling, Software Trace Reading, Software Trace Visualization, Software Tracing Implementation Patterns, Software Tracing for Dummies, Software Troubleshooting Patterns, Software Victimology, Structural Trace Patterns, Testing, Tools, Trace Analysis Patterns, Troubleshooting Methodology, UI Problem Analysis Patterns, Unified Debugging Patterns, Unit Testing, Victimware, Webinars, Windows System Administration | No Comments »
Saturday, January 7th, 2012
This is another tracing example of unified debugging patterns introduced previously.
- Analysis Patterns
Focus of Tracing
- Architectural Patterns
Debug Event Subscription / Notification
- Design Patterns
Shared Debug Event State
- Implementation Patterns
Shared Variable
- Usage Patterns
Saving a memory address obtained at a breakpoint event in a debugger pseudo-register for use at later breakpoint events
Debugging.tv published a case study for tracing window messages in WinDbg. There a pseudo-register is used to save a buffer address before GetMessage call and then to reuse it after the call. Please look at Event State Management slide on Frames episode 0×06 presentation. The full WinDbg log and the recording are available there too.
- Dmitry Vostokov @ DumpAnalysis.org + TraceAnalysis.org -
Posted in Debugging, Debugging TV, Software Architecture, Software Behavior Patterns, Software Engineering, Software Trace Analysis, Trace Analysis Patterns, Unified Debugging Patterns, WinDbg Scripts, WinDbg Tips and Tricks | No Comments »
Friday, November 11th, 2011
One of the new initiatives for 2012 is the development of SPDL (Software Problem Description Language). Its purpose is automatic generation of a software troubleshooting tool(s) based on the description of a problem. Here software problem means a post-construction problem as outlined in Introduction to Pattern-Driven Software Problem Solving. The tool construction will utilize an expanded set of DebugWare and Workaround patterns together with the refind version of RADII software development process. This will also provide necessary effectiveness, efficiency and enhanced problem solving capabilities to existing TaaS (Tools as a Service) implementations that are limited in the number of tools they offer.
- Dmitry Vostokov @ DumpAnalysis.org + TraceAnalysis.org -
Posted in Announcements, Computer Science, Crash Dump Analysis, DebugWare Patterns, Debugging, Generative Debugging, New Acronyms, New Debugging School, SPDL, Software Behavior DNA, Software Behavior Patterns, Software Behavioral Genome, Software Engineering, Software Problem Solving, Software Technical Support, Software Trace Analysis, Software Troubleshooting Patterns, Software and Modeling, TaaS, Testing, Tool Objects, Tools, Troubleshooting Methodology, Unified Debugging Patterns, Windows System Administration | No Comments »
Thursday, November 3rd, 2011
The new 6th volume contains revised, edited, cross-referenced, and thematically organized selected DumpAnalysis.org blog posts about memory dump and software trace analysis, software troubleshooting and debugging written in November 2010 - October 2011 for software engineers developing and maintaining products on Windows platforms, quality assurance engineers testing software on Windows platforms, technical support and escalation engineers dealing with complex software issues, and security researchers, malware analysts and reverse engineers. The sixth volume features:
- 56 new crash dump analysis patterns including 14 new .NET memory dump analysis patterns
- 4 new pattern interaction case studies
- 11 new trace analysis patterns
- New Debugware pattern
- Introduction to UI problem analysis patterns
- Introduction to intelligence analysis patterns
- Introduction to unified debugging pattern language
- Introduction to generative debugging, metadefect template library and DNA of software behaviour
- The new school of debugging and trends
- .NET memory dump analysis checklist
- Software trace analysis checklist
- Introduction to close and deconstructive readings of a software trace
- Memory dump analysis compass
- Computical and Stack Trace Art
- The abductive reasoning of Philip Marlowe
- Orbifold memory space and cloud computing
- Memory worldview
- Interpretation of cyberspace
- Relationship of memory dumps to religion
- Fully cross-referenced with Volume 1, Volume 2, Volume 3, Volume 4, and Volume 5
Product information:
- Title: Memory Dump Analysis Anthology, Volume 6
- Author: Dmitry Vostokov
- Language: English
- Product Dimensions: 22.86 x 15.24
- Paperback: 300 pages
- Publisher: Opentask (December 2011)
- ISBN-13: 978-1-908043-19-1
- Hardcover: 300 pages
- Publisher: Opentask (January 2012)
- ISBN-13: 978-1-908043-20-7

Back cover features 3d memory space visualization image created with ParaView.
- Dmitry Vostokov @ DumpAnalysis.org + TraceAnalysis.org -
Posted in .NET Debugging, Announcements, Art, Books, Cloud Computing, Cloud Memory Dump Analysis, Common Mistakes, Complete Memory Dump Analysis, Computer Science, Computicart (Computical Art), Crash Dump Analysis, Crash Dump Patterns, Cyber Intelligence, Cyber Problems, Cyber Security, Cyber Space, Cyber Warfare, DebugWare Patterns, Debugging, Debugging Industry, Debugging Methodology, Debugging Slang, Debugging Trends, Escalation Engineering, Generative Debugging, Intelligence Analysis Patterns, Kernel Development, Memoidealism, Memoretics, Memory Visualization, Metadefect Template Library, New Debugging School, Philosophy, Physicalist Art, Publishing, Root Cause Analysis, Science of Memory Dump Analysis, Science of Software Tracing, Security, Software Behavior DNA, Software Behavior Patterns, Software Behavioral Genome, Software Engineering, Software Narratology, Software Technical Support, Software Trace Analysis, Software Trace Deconstruction, Software Trace Reading, Software Victimology, Testing, The Way of Philip Marlowe, Tools, Trace Analysis Patterns, Training and Seminars, Troubleshooting Methodology, UI Problem Analysis Patterns, Unified Debugging Patterns, Victimware, WinDbg Tips and Tricks, Windows 7, Windows Azure, Windows Data Structures, Windows Server 2008, Windows System Administration, x64 Windows | No Comments »
Wednesday, September 21st, 2011
Memoretics promotes pattern-driven memory dump and software trace analysis which has many uses but not limited to:
- Software and site reliability
- Software Debugging
- QA and Software Testing
- Computer Security
- Software Troubleshooting
- Malware Research and Analysis
- Tools as a Service (TaaS)
- Supportability
- Software Diagnostics

- Dmitry Vostokov @ DumpAnalysis.org + TraceAnalysis.org -
Posted in Cloud Memory Dump Analysis, Computer Forensics, Crash Dump Analysis, Crash Dump Patterns, DebugWare Patterns, Debugging, Debugging Trends, Escalation Engineering, Malware Analysis, Malware Patterns, Memiotics (Memory Semiotics), Memoretics, Memory Analysis Forensics and Intelligence, Metadefect Template Library, Metamalware, Pattern Models, Pattern Prediction, Reverse Engineering, Root Cause Analysis, Science of Memory Dump Analysis, Science of Software Tracing, Security, Software Behavior DNA, Software Behavior Patterns, Software Behavioral Genome, Software Defect Construction, Software Engineering, Software Generalist, Software Narratology, Software Support Patterns, Software Technical Support, Software Trace Analysis, Software Troubleshooting Patterns, Structural Memory Patterns, Structural Trace Patterns, Systems Thinking, Testing, Tools, Trace Analysis Patterns, Troubleshooting Methodology, UI Problem Analysis Patterns, Unified Debugging Patterns, Victimware, Windows System Administration, Workaround Patterns | No Comments »
Wednesday, September 21st, 2011
Memoretics as a science of memory snapshots borrows many ideas from the following disciplines (the list is not exhaustive):
- Troubleshooting and Debugging
- Intelligence Analysis
- Critical Thinking
- Forensics
- Linguistics
- Archaeology
- Psychoanalysis
- History
- Mathematics: Sets and Categories
- Literary Criticism and Narratology
It also contributes many ideas back. The following diagram depicts such an interaction:

- Dmitry Vostokov @ DumpAnalysis.org + TraceAnalysis.org -
Posted in Archaeology of Computer Memory, Categorical Debugging, Computer Forensics, Computer Science, Countefactual Debugging, Crash Dump Analysis, Crash Dump De-analysis, Crash Dump Patterns, Debugging, Debugging Methodology, Dublin School of Security, Education and Research, Escalation Engineering, General Memory Analysis, Generative Debugging, Hermeneutics of Memory Dumps and Traces, History, Intelligence Analysis Patterns, M->analysis, Malware Analysis, Malware Patterns, Mathematics of Debugging, Memiotics (Memory Semiotics), Memoretics, Memory Analysis Forensics and Intelligence, Memory Dump Analysis and History, Memory Systems Language, Memory Visualization, Metadefect Template Library, Metamalware, New Debugging School, Paleo-debugging, Pattern Models, Pattern Prediction, Psychoanalysis of Software Maintenance and Support, Psychology, Reverse Engineering, Root Cause Analysis, Science of Memory Dump Analysis, Science of Software Tracing, Security, Software Architecture, Software Behavior DNA, Software Behavior Patterns, Software Behavioral Genome, Software Chorography, Software Chorology, Software Defect Construction, Software Engineering, Software Narratology, Software Technical Support, Software Trace Analysis, Software Trace Analysis and History, Software Trace Deconstruction, Software Trace Linguistics, Software Trace Reading, Software Trace Visualization, Software Tracing Implementation Patterns, Software Troubleshooting Patterns, Software Victimology, Software and History, Structural Memory Analysis and Social Sciences, Structural Memory Patterns, Structural Trace Patterns, Systems Thinking, Testing, Tools, Trace Analysis Patterns, Troubleshooting Methodology, UI Problem Analysis Patterns, Unified Debugging Patterns, Victimware, Virtualization, Visual Dump Analysis, Workaround Patterns | No Comments »
Thursday, July 14th, 2011
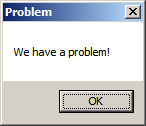
As a part of unified debugging pattern and generative debugging approach we extend software behavior analysis patterns such as memory dump and software trace analysis with UI abnormal behaviour patterns. Here by abnormality we mean behavior that users should not encounter while using software. Typical example is some error message or GUI distortion during execution of a functional use case. Such patterns will extend software behavior analysis pattern language we use for description of various post-construction software problems.
The first pattern we start with is called Error Message Box and we link it to Message Box and Self-Diagnosis memory analysis patterns. You can download x86 and x64 modeling examples from this location:
UIPMessageBox.zip
When we start the application it shows a message box:
We then launch Task Manager and find the window:
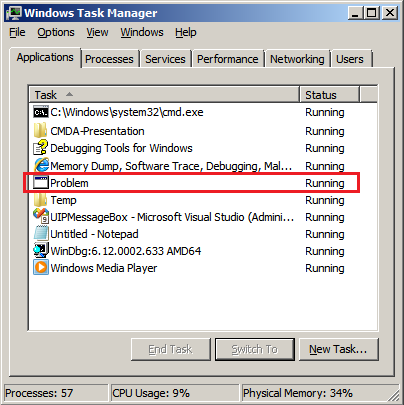
Then we save a crash dump using right-click context menu:
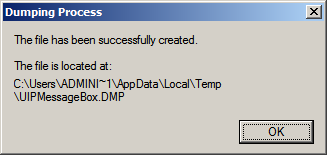
When we open the process memory dump we see this stack trace:
0:000> ~*kL
.  0  Id: d30.71c Suspend: 0 Teb: 000007ff`fffdd000 Unfrozen

Child-SP          RetAddr           Call Site

00000000`002ff1e8 00000000`77837214 user32!ZwUserWaitMessage+0xa

00000000`002ff1f0 00000000`778374a5 user32!DialogBox2+0x274

00000000`002ff280 00000000`778827f0 user32!InternalDialogBox+0x135

00000000`002ff2e0 00000000`77881ae5 user32!SoftModalMessageBox+0x9b4

00000000`002ff410 00000000`7788133b user32!MessageBoxWorker+0x31d

00000000`002ff5d0 00000000`77881232 user32!MessageBoxTimeoutW+0xb3

00000000`002ff6a0 00000001`3ffa101d user32!MessageBoxW+0×4e

00000000`002ff6e0 00000001`3ffa1039 UIPMessageBox!bar+0×1d

00000000`002ff710 00000001`3ffa1052 UIPMessageBox!foo+0×9

00000000`002ff740 00000001`3ffa11ea UIPMessageBox!wmain+0×12

00000000`002ff770 00000000`7770f56d UIPMessageBox!__tmainCRTStartup+0×15a

00000000`002ff7b0 00000000`77942cc1 kernel32!BaseThreadInitThunk+0xd

00000000`002ff7e0 00000000`00000000 ntdll!RtlUserThreadStart+0×1d
We see there that foo function called bar function which displayed the message box. In real scenarios function name could me more meaningful and give a clue for troubleshooting and debugging in addition to message text:
0:000> ub 00000001`3ffa101d

UIPMessageBox!__unguarded_readlc_active+0xfff:

00000001`3ffa0fff add     byte ptr [rax-7Dh],cl

00000001`3ffa1002 in      al,dx

00000001`3ffa1003 sub     byte ptr [rbp+33h],al

00000001`3ffa1006 leave

00000001`3ffa1007 lea     r8,[UIPMessageBox!__mnames+0×28 (00000001`3ffa83c8)]

00000001`3ffa100e lea     rdx,[UIPMessageBox!__mnames+0×38 (00000001`3ffa83d8)]

00000001`3ffa1015 xor     ecx,ecx

00000001`3ffa1017 call    qword ptr [UIPMessageBox!_imp_MessageBoxW (00000001`3ffa71d8)]
0:000> du 00000001`3ffa83c8

00000001`3ffa83c8  “Problem”
0:000> du 00000001`3ffa83d8

00000001`3ffa83d8  “We have a problem!”
- Dmitry Vostokov @ DumpAnalysis.org + TraceAnalysis.org -
Posted in Announcements, Crash Dump Analysis, Crash Dump Patterns, Debugging, Generative Debugging, Pattern Models, Software Behavior Patterns, UI Problem Analysis Patterns, Unified Debugging Patterns, x64 Windows | No Comments »
Thursday, April 28th, 2011
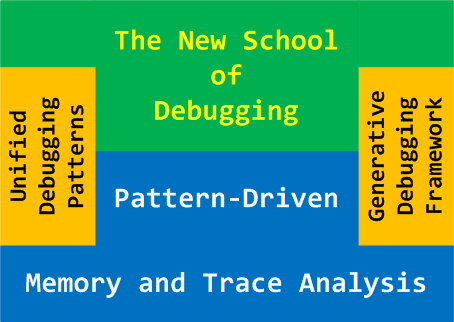
The New School of Debugging places pattern-driven memory and software trace analysis as a solid foundation for any debugging methodology, processes, tools and techniques. Unified Debugging Patterns and Generative Debugging Framework are additional features of the new school. To highlight its essentials I’ve created this draft diagram:
- Dmitry Vostokov @ DumpAnalysis.org + TraceAnalysis.org -
Posted in Crash Dump Patterns, Debugging, Generative Debugging, New Debugging School, Trace Analysis Patterns, Unified Debugging Patterns | No Comments »
Saturday, March 26th, 2011
The presentation materials from the webinar (25th of March, 2011) are available for download:
http://www.dumpanalysis.com/PDSPSI-materials
Thanks to everyone who registered and attended!
- Dmitry Vostokov @ DumpAnalysis.org + TraceAnalysis.org -
Posted in Announcements, Crash Dump Analysis, Crash Dump Patterns, DebugWare Patterns, Debugging, Debugging Methodology, Escalation Engineering, Mac Crash Corner, Malware Analysis, Malware Patterns, Memory Analysis Forensics and Intelligence, Software Architecture, Software Behavior Patterns, Software Engineering, Software Technical Support, Software Trace Analysis, Software Tracing Implementation Patterns, Software Troubleshooting Patterns, Structural Memory Patterns, Structural Trace Patterns, Tools, Trace Analysis Patterns, Training and Seminars, Troubleshooting Methodology, Unified Debugging Patterns, Webinars, Workaround Patterns | No Comments »
Monday, March 7th, 2011

The first Webinar to start an in-depth discussion of pattern-driven software troubleshooting, debugging and maintenance:
Date: 25th of March 2011
Time: 18:30 (GMT) 14:30 (EST) 11:30 (PST)
Duration: 60 minutes
Space is limited.
Reserve your Webinar seat now at:
https://www3.gotomeeting.com/register/448268158
Topics include:
- A Short History of DumpAnalysis.org
- Memory Dump Analysis Patterns
- Troubleshooting and Debugging Tools (Debugware) Patterns
- Software Trace Analysis Patterns
- From Software Defects to Software Behavior
- Workaround Patterns
- Structural Memory Patterns
- Memory Analysis Domain Pattern Hierarchy
- New Directions
Prerequisites: experience in software troubleshooting and/or debugging.
- Dmitry Vostokov @ DumpAnalysis.org + TraceAnalysis.org -
Posted in .NET Debugging, Analysis Notation, Announcements, AntiPatterns, Best Practices, CDA Pattern Classification, Crash Dump Analysis, Crash Dump Patterns, DebugWare Patterns, Debugging, Debugging Methodology, Debugging Trends, Escalation Engineering, Java Debugging, Linux Crash Corner, Mac Crash Corner, Malware Analysis, Malware Patterns, Memory Analysis Forensics and Intelligence, Memory Dump Analysis Services, Pattern Models, Pattern Prediction, Presentations, Software Behavior Patterns, Software Chorology, Software Engineering, Software Narratology, Software Technical Support, Software Trace Analysis, Software Trace Reading, Software Tracing Implementation Patterns, Software Troubleshooting Patterns, Structural Memory Patterns, Structural Trace Patterns, Systems Thinking, Testing, Trace Analysis Patterns, Training and Seminars, Troubleshooting Methodology, Unified Debugging Patterns, Webinars, Workaround Patterns | No Comments »
Saturday, January 1st, 2011
With the new year starts the new initiative to integrate traditional multidisciplinary debugging approaches and methodologies with multiplatform pattern-driven software problem solving, unified debugging patterns, best practices in memory dump analysis and software tracing, computer security, economics, and the new emerging trends I’m going to write about during this year.
- Dmitry Vostokov @ DumpAnalysis.org + TraceAnalysis.org -
Posted in Announcements, Best Practices, Computer Forensics, Computer Science, Countefactual Debugging, Crash Analysis Report Environment (CARE), Crash Dump Analysis, Crash Dump Patterns, DebugWare Patterns, Debugging, Debugging Industry, Debugging Methodology, Debugging Trends, Dublin School of Security, Economics, Education and Research, Escalation Engineering, First Fault Problem Solving, Malware Analysis, Malware Patterns, Mathematics of Debugging, Memiotics (Memory Semiotics), Memoretics, Memory Analysis Forensics and Intelligence, Memory Analysis Report System, Memory Dump Analysis Services, Memory Systems Language, Memory Visualization, New Debugging School, Science of Memory Dump Analysis, Science of Software Tracing, Security, Software Behavior Patterns, Software Defect Construction, Software Engineering, Software Generalist, Software Maintenance Institute, Software Narratology, Software Trace Analysis, Software Trace Visualization, Software Tracing Implementation Patterns, Software Troubleshooting Patterns, Structural Memory Patterns, Structural Trace Patterns, Systems Thinking, Testing, Tool Objects, Tools, Trace Analysis Patterns, Training and Seminars, Troubleshooting Methodology, Unified Debugging Patterns, Victimware, Visual Dump Analysis, Webinars, Workaround Patterns | No Comments »
Wednesday, December 29th, 2010
In these post series we are going to discuss the best practices for software tracing implementation including appropriate patterns and their links to software trace analysis patterns. The first one is called Period Timestamp where the start and the end time (and the date if necessary) are recorded in the trace file. This helps in Inter-Correlation and News Value analysis between several different trace types. For example, in one scenario, we had WindowHistory and MessageHistory logs. We identified a problem in the former log as happening at this time:
Handle: 00010196 Class: "ClassA" Title: "TitleA"

   Captured at: 13:36:30:533

[…]
However, when we looked at the latter trace to search for specific window messages posted or sent before that time we saw that the recording started later than the former event:
Start time: 13:36:35:830
Period timestamps are necessary to distinguish Incomplete History from Truncated Trace where in the former case the absence of expected trace message is due to some problem.
From a unified debugging patterns perspective we have this sequence fragment:
Implementation Patterns: Period Timestamp
Usage Patterns: Trace Simultaneously
- Dmitry Vostokov @ DumpAnalysis.org + TraceAnalysis.org -
Posted in Best Practices, Debugging, Debugging Methodology, Software Architecture, Software Engineering, Software Narratology, Software Technical Support, Software Trace Analysis, Software Trace Reading, Software Tracing Implementation Patterns, Trace Analysis Patterns, Troubleshooting Methodology, Unified Debugging Patterns | No Comments »
Friday, December 17th, 2010
As the new decade is approaching (2011-2020) we would like to make a few previews and predictions:
- Increased complexity of software will bring more methods from biological, social sciences and humanities in addition to existing methods of automated debugging and computer science techniques
- Focus on first fault software problem solving (when aspect)
- Focus on pattern-driven software problem solving (how aspect)
- Fusion of debugging and malware analysis into a unified structural and behavioral pattern framework
- Visual debugging, memory and software trace visualization techniques
- Software maintenance certification
- Focus on domain-driven troubleshooting and debugging tools as a service (debugware TaaS)
- Focus on security issues related to memory dumps and software traces
- New scripting languages and programming language extensions for debugging
- The maturation of the science of memory snapshots and software traces (memoretics)
Imagining is not not limited to the above and more to come and explain in the forthcoming parts.
- Dmitry Vostokov @ DumpAnalysis.org + TraceAnalysis.org -
Posted in Announcements, Anthropology, Archaeology of Computer Memory, Biology, Certification, Computer Science, Countefactual Debugging, Crash Analysis Report Environment (CARE), Crash Dump Analysis, Crash Dump Patterns, DebugWare Patterns, Debugging, Debugging Industry, Debugging Methodology, Debugging Trends, Dublin School of Security, EasyDbg, Economics, Escalation Engineering, Evolution, First Fault Problem Solving, Futuristic Memory Dump Analysis, General Memory Analysis, General Science, Geography, Hardware, Hermeneutics of Memory Dumps and Traces, History, Humanities, Language, Laws of Troubleshooting and Debugging, Logic, Malware Analysis, Malware Patterns, Mathematics of Debugging, Memiotics (Memory Semiotics), Memoretics, Memory Analysis Forensics and Intelligence, Memory Analysis Report System, Memory Dump Analysis and History, Memory Systems Language, Memory Visualization, Paleo-debugging, Pattern Models, Pattern Prediction, Physics, Psychology, Publishing, Science of Memory Dump Analysis, Science of Software Tracing, Security, Social Media, Social Sciences, Software Architecture, Software Behavior Patterns, Software Chorography, Software Chorology, Software Defect Construction, Software Engineering, Software Generalist, Software Maintenance Institute, Software Narrative Fiction, Software Narratology, Software Technical Support, Software Trace Analysis, Software Trace Analysis and History, Software Trace Deconstruction, Software Trace Linguistics, Software Trace Visualization, Software Troubleshooting Patterns, Software Victimology, Statistics, Structural Memory Analysis and Social Sciences, Structural Memory Patterns, Structural Trace Patterns, Systems Thinking, Testing, Tools, Trace Analysis Patterns, Troubleshooting Methodology, Unified Debugging Patterns, Uses of UML, Victimware, Virtualization, Visual Dump Analysis, Windows System Administration, Workaround Patterns | No Comments »
Friday, December 3rd, 2010
We now start unifying software behavior analysis patterns with debugging architecture, design, implementation and usage. This is analogous to software construction where a problem analysis leads to various software engineering phases. The important difference here is the addition of debugging usage patterns. Let’s look at an example (we discuss suggested patterns later):
- Analysis Patterns
Shared Buffer Overwrite
- Architectural Patterns
Debug Event Subscription / Notification
- Design Patterns
Punctuated Execution
- Implementation Patterns
Breakpoint (software and hardware)
- Usage Patterns
Kernel vs. user space breakpoints
To differentiate this systematic approach from the various published ad hoc debugging patterns we call it Unified Debugging Pattern Language. ADI parts can also correspond to various DebugWare patterns where we provide a mapping later.
- Dmitry Vostokov @ DumpAnalysis.org + TraceAnalysis.org -
Posted in Crash Dump Analysis, Crash Dump Patterns, DebugWare Patterns, Debugging, Software Architecture, Software Behavior Patterns, Software Engineering, Software Trace Analysis, Trace Analysis Patterns, Unified Debugging Patterns | No Comments »