Archive for the ‘Security’ Category
Wednesday, February 8th, 2023
There’s some kind of duality between trace data and activity. For example, trace data corresponds to CoData (CoTrace, CoLog), the analysis activity. On the other hand, Regions of Activity (and various Activity-related patterns such Thread of Activity) may contain data that itself may point to some activity (not necessarily the same), CoActivity. For example, some keyboard-related message data may contain values of passwords. This analysis pattern is illustrated schematically in the following diagram:
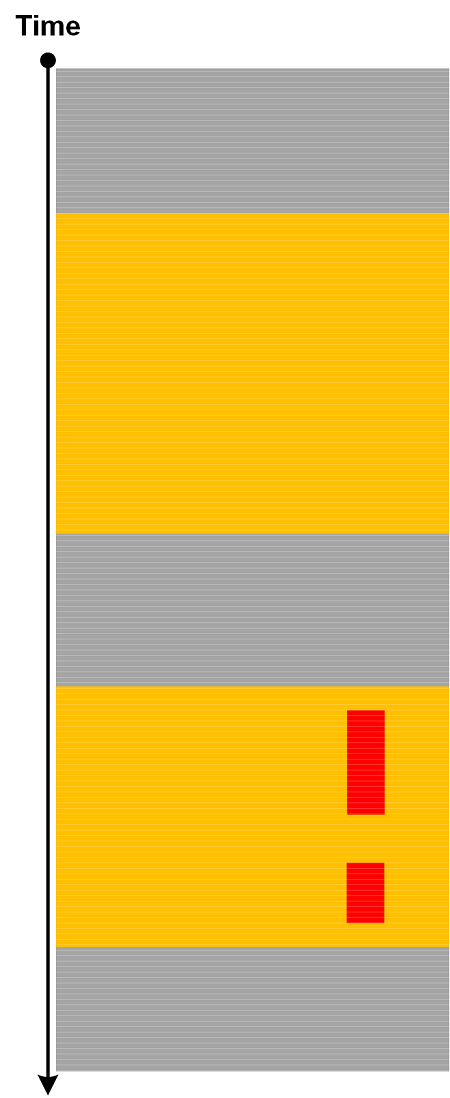
CoActivity is different from Data Flow, where the same or modified value is passed from one message to another, not necessarily inside the same activity.
- Dmitry Vostokov @ DumpAnalysis.org + TraceAnalysis.org -
Posted in Log Analysis, Security, Software Trace Analysis, Trace Analysis Patterns | Comments Off
Thursday, July 20th, 2017
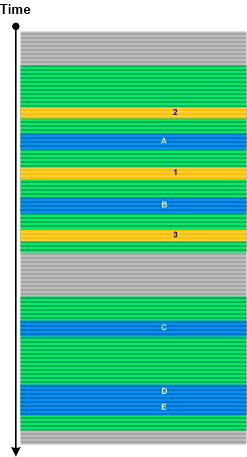
Certain types of blind SQL injection attacks may leave log messages with just one byte difference. We call with analysis pattern Ultrasimilar Messages by analogy with an ultrametric space in mathematics and the interpretation of messages as p-adic numbers. Since, such messages may be scattered in a log we can choose Message Pattern based on some Message Invariant (for example, parts of SQL request) and then analyze its Fiber of Activity (for example, Data Flow of its variable part). A log with two different types of Ultrasimilar Messages is shown in the following diagram:
- Dmitry Vostokov @ DumpAnalysis.org + TraceAnalysis.org -
Posted in Log Analysis, Mathematics of Debugging, Security, Software Trace Analysis, Trace Analysis Patterns | No Comments »
Friday, January 11th, 2013
Static program analysis is used to eliminate certain coding errors that may lead to abnormal software behaviour. So it is naturally a part of software diagnostics but at source code level. Our goal here is to identify certain patterns directly linkable to patterns we see in memory dumps and software logs and collect them into a catalog. One such pattern candidate is called Loop Construct. It covers conditional and unconditional loops, for example, in one of modern languages:
extern bool soonToBeTrue;
int mediumValue = ...;
while (true)

{

  TRACE("Waiting");

  sleep(mediumValue);

  if (soonToBeTrue)

  {

    break;

  }

  doHeavyWork();

}
while (--pControl->aFewPasses)

{

  TRACE("Waiting");

  sleep(mediumValue);

  doHeavyWork();

}
Such loops may potentially lead to Spiking Thread memory dump analysis and High Message Current and Density trace analysis patterns. Of course, we shouldn’t suspect every loop but only some that have potential to be altered by Local Buffer Overflow (for mediumValue) or Shared Buffer Overwrite (for Control.aFewPasses) or by a race condition (soonToBeTrue).
We expect things to get more interesting when we start associating source code that uses certain API with patterns of abnormal behavior.
- Dmitry Vostokov @ DumpAnalysis.org + TraceAnalysis.org -
Posted in C and C++, Code Reading, Core Dump Analysis, Crash Dump Analysis, Crash Dump Patterns, Debugging, Security, Software Behavior Patterns, Software Diagnostics, Software Trace Analysis, Static Code Analysis Patterns, Trace Analysis Patterns, Victimware Analysis | No Comments »
Monday, December 31st, 2012
Sometimes we need to check under what security principal or group we run a process or what privileges it has or whether it has impersonating threads. We call this pattern Deviant Token when we find, for example, an unexpected token with a different security identifier, for example, Network Service instead of Local System (SID: S-1-5-18):
PROCESS 8f218d88  SessionId: 0  Cid: 09c4    Peb: 7ffdf000  ParentCid: 0240

DirBase: bffd4260  ObjectTable: e10eae90  HandleCount:  93.

Image: ServiceA.exe

VadRoot 8f1f70e8 Vads 141 Clone 0 Private 477. Modified 2. Locked 0.

DeviceMap e10038d8

Token                             e10ff5d8

[…]
0: kd> !token e10ff5d8

_TOKEN e10ff5d8

TS Session ID: 0

User: S-1-5-20

[…]
Well-known SIDs can be found in this MS article: http://support.microsoft.com/kb/243330
- Dmitry Vostokov @ DumpAnalysis.org + TraceAnalysis.org -
Posted in Crash Dump Analysis, Crash Dump Patterns, Security | No Comments »
Friday, July 13th, 2012
For some time I was struggling with finding a good name for memory dump and software trace analysis activities. The name Memoretics I use for the science of memory dump analysis (that also incorporates software traces) seems not so good to describe the whole practical activity that should be transparent to everyone in IT. Fortunately, I timely understood that all these activities constitute the essence of software diagnostics that previously lacked any solid foundation. Thus, Software Diagnostics Institute was reborn from the previous Crash Dump Analysis Portal. This institute does pure and applied research and scientific activities and in recent years was funded mainly from OpenTask publisher and recently from Memory Dump Analysis Services. The latter company also recognized that the broadening of its commercial activities requires a new name. So, Software Diagnostics Services was reborn:
The First Comprehensive Software Diagnostics Service
- Dmitry Vostokov @ DumpAnalysis.org + TraceAnalysis.org -
Posted in Announcements, Cloud Memory Dump Analysis, Complete Memory Dump Analysis, Core Dump Analysis, Crash Analysis Report Environment (CARE), Crash Dump Analysis, Debugging, Debugging Bureau, Debugging Industry, Debugging Methodology, Debugging Today, Debugging Trends, Education, Education and Research, Escalation Engineering, Event Tracing for Windows (ETW), First Fault Software Diagnostics, Generative Debugging, JIT Crash Analysis, JIT Memory Space Analysis, Java Debugging, Kernel Development, Kernel Memory Dump Analysis, Linux Crash Corner, MFC Debugging, Mac Crash Corner, Mac OS X, Malware Analysis, Memoretics, Memory Analysis Forensics and Intelligence, Memory Analysis Report System, Memory Dump Analysis Methodology, Memory Dump Analysis Services, Minidump Analysis, New Debugging School, Pattern-Driven Debugging, Pattern-Driven Software Support, Performance Monitoring, Root Cause Analysis, SQL Debugging, Security, Software Debugging Services, Software Diagnostics, Software Diagnostics Institute, Software Diagnostics Services, Software Engineering, Software Problem Solving, Software Technical Support, Software Trace Analysis, Software Trace Analysis Report Environment (STARE), Tools, Training and Seminars, Troubleshooting Methodology, Unified Software Diagnostics, Windows 7, Windows 8, Windows Azure, Windows Mobile, Windows Server 2008, Windows System Administration, x64 Mac OS X, x64 Windows | No Comments »
Sunday, June 24th, 2012
Memory Dump Analysis Services organizes a free webinar on a unified malware and victimware analysis by using behavioral and structural patterns including a live memory dump analysis example.

Date: 2nd of July, 2012
Time: 17:00 (BST) 12:00 (EST) 09:00 (PST)
Duration: 60 minutes
Space is limited.
Reserve your Webinar seat now at:
https://www3.gotomeeting.com/register/332458406
- Dmitry Vostokov @ DumpAnalysis.org + TraceAnalysis.org -
Posted in Announcements, Malware Analysis, Memory Dump Analysis Services, Security, Software Behavior Patterns, Victimware, Webinars | No Comments »
Sunday, March 11th, 2012
The development of SPDL requires extending pattern-driven analysis approach to software problems such as software defect and software incident descriptions. Such a pattern language should help with accurate problem identification and problem resolution through software behaviour analysis and with choosing, for example, appropriate workaround patterns or, for a debugging strategy, unified debugging patterns. This can also be applicable to software security incident descriptions as well.
For this first part, we introduce a pattern called, Problem Summary. This is a very short description that summarizes the essence of the problem from a submitter point of view such as a software user or a technical support engineer. Whether it is correct or incorrect is another problem itself but the missing summary usually requires close reading of the whole problem description text and analyze together various relevant parts to reconstruct the summary.
- Dmitry Vostokov @ DumpAnalysis.org + TraceAnalysis.org -
Posted in Debugging, Escalation Engineering, SPDL, Security, Software Engineering, Software Problem Description Patterns, Software Problem Solving, Software Support Patterns, Software Technical Support, Victimware | No Comments »
Sunday, February 19th, 2012
Memory Dump Analysis Services (DumpAnalysis.com) organizes a free Webinar about software narratology: an application of ideas from narratology to software narrative stories.

Learn about this exciting new discipline and a field of research. When software executes it gives us its stories in the form of UI events, software traces and logs. Such stories can be analyzed for their structure and patterns for troubleshooting, debugging and problem resolution purposes.
Prerequisites: basic software troubleshooting and ability to read software generated logs.
Audience: anyone can benefit from this new perspective: from software users to software engineers and managers.
Space is limited.
Reserve your Webinar seat now at:
https://www3.gotomeeting.com/register/603136294
- Dmitry Vostokov @ DumpAnalysis.org + TraceAnalysis.org -
Posted in Announcements, Computer Science, Debugging, Escalation Engineering, Intelligence Analysis Patterns, Memory Dump Analysis Services, SPDL, Science of Software Tracing, Security, Software Behavior DNA, Software Behavior Patterns, Software Behavioral Genome, Software Engineering, Software Narrative Fiction, Software Narratology, Software Problem Description Patterns, Software Problem Solving, Software Technical Support, Software Trace Analysis, Software Trace Deconstruction, Software Trace Linguistics, Software Trace Modeling, Software Trace Reading, Software Trace Visualization, Software Tracing Implementation Patterns, Software Tracing for Dummies, Software Troubleshooting Patterns, Software Victimology, Structural Trace Patterns, Testing, Tools, Trace Analysis Patterns, Troubleshooting Methodology, UI Problem Analysis Patterns, Unified Debugging Patterns, Unit Testing, Victimware, Webinars, Windows System Administration | No Comments »
Thursday, November 3rd, 2011
The new 6th volume contains revised, edited, cross-referenced, and thematically organized selected DumpAnalysis.org blog posts about memory dump and software trace analysis, software troubleshooting and debugging written in November 2010 - October 2011 for software engineers developing and maintaining products on Windows platforms, quality assurance engineers testing software on Windows platforms, technical support and escalation engineers dealing with complex software issues, and security researchers, malware analysts and reverse engineers. The sixth volume features:
- 56 new crash dump analysis patterns including 14 new .NET memory dump analysis patterns
- 4 new pattern interaction case studies
- 11 new trace analysis patterns
- New Debugware pattern
- Introduction to UI problem analysis patterns
- Introduction to intelligence analysis patterns
- Introduction to unified debugging pattern language
- Introduction to generative debugging, metadefect template library and DNA of software behaviour
- The new school of debugging and trends
- .NET memory dump analysis checklist
- Software trace analysis checklist
- Introduction to close and deconstructive readings of a software trace
- Memory dump analysis compass
- Computical and Stack Trace Art
- The abductive reasoning of Philip Marlowe
- Orbifold memory space and cloud computing
- Memory worldview
- Interpretation of cyberspace
- Relationship of memory dumps to religion
- Fully cross-referenced with Volume 1, Volume 2, Volume 3, Volume 4, and Volume 5
Product information:
- Title: Memory Dump Analysis Anthology, Volume 6
- Author: Dmitry Vostokov
- Language: English
- Product Dimensions: 22.86 x 15.24
- Paperback: 300 pages
- Publisher: Opentask (December 2011)
- ISBN-13: 978-1-908043-19-1
- Hardcover: 300 pages
- Publisher: Opentask (January 2012)
- ISBN-13: 978-1-908043-20-7

Back cover features 3d memory space visualization image created with ParaView.
- Dmitry Vostokov @ DumpAnalysis.org + TraceAnalysis.org -
Posted in .NET Debugging, Announcements, Art, Books, Cloud Computing, Cloud Memory Dump Analysis, Common Mistakes, Complete Memory Dump Analysis, Computer Science, Computicart (Computical Art), Crash Dump Analysis, Crash Dump Patterns, Cyber Intelligence, Cyber Problems, Cyber Security, Cyber Space, Cyber Warfare, DebugWare Patterns, Debugging, Debugging Industry, Debugging Methodology, Debugging Slang, Debugging Trends, Escalation Engineering, Generative Debugging, Intelligence Analysis Patterns, Kernel Development, Memoidealism, Memoretics, Memory Visualization, Metadefect Template Library, New Debugging School, Philosophy, Physicalist Art, Publishing, Root Cause Analysis, Science of Memory Dump Analysis, Science of Software Tracing, Security, Software Behavior DNA, Software Behavior Patterns, Software Behavioral Genome, Software Engineering, Software Narratology, Software Technical Support, Software Trace Analysis, Software Trace Deconstruction, Software Trace Reading, Software Victimology, Testing, The Way of Philip Marlowe, Tools, Trace Analysis Patterns, Training and Seminars, Troubleshooting Methodology, UI Problem Analysis Patterns, Unified Debugging Patterns, Victimware, WinDbg Tips and Tricks, Windows 7, Windows Azure, Windows Data Structures, Windows Server 2008, Windows System Administration, x64 Windows | No Comments »
Monday, September 26th, 2011
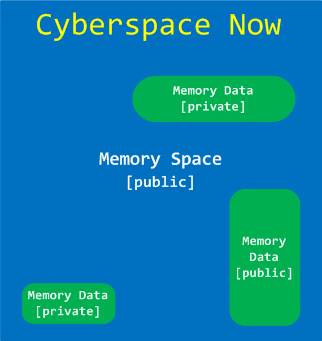
Memoretics views Cyber Space as Memory Space + Memory Data. Here Memory Space consists of many different memory spaces. Although data is private property memory space where it is located is not:
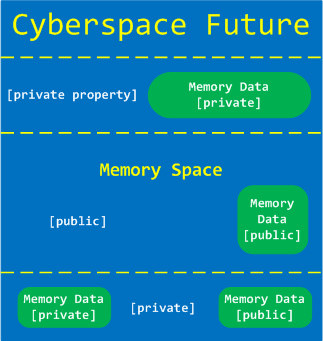
We propose private property on memory spaces and their partitions as a solution to various Cyber problems such as Cyber Crime and Cyber War:
- Dmitry Vostokov @ DumpAnalysis.org + TraceAnalysis.org -
Posted in Announcements, Cyber Intelligence, Cyber Problems, Cyber Security, Cyber Space, Cyber Warfare, Memory Analysis Forensics and Intelligence, Security | No Comments »
Wednesday, September 21st, 2011
Memoretics promotes pattern-driven memory dump and software trace analysis which has many uses but not limited to:
- Software and site reliability
- Software Debugging
- QA and Software Testing
- Computer Security
- Software Troubleshooting
- Malware Research and Analysis
- Tools as a Service (TaaS)
- Supportability
- Software Diagnostics

- Dmitry Vostokov @ DumpAnalysis.org + TraceAnalysis.org -
Posted in Cloud Memory Dump Analysis, Computer Forensics, Crash Dump Analysis, Crash Dump Patterns, DebugWare Patterns, Debugging, Debugging Trends, Escalation Engineering, Malware Analysis, Malware Patterns, Memiotics (Memory Semiotics), Memoretics, Memory Analysis Forensics and Intelligence, Metadefect Template Library, Metamalware, Pattern Models, Pattern Prediction, Reverse Engineering, Root Cause Analysis, Science of Memory Dump Analysis, Science of Software Tracing, Security, Software Behavior DNA, Software Behavior Patterns, Software Behavioral Genome, Software Defect Construction, Software Engineering, Software Generalist, Software Narratology, Software Support Patterns, Software Technical Support, Software Trace Analysis, Software Troubleshooting Patterns, Structural Memory Patterns, Structural Trace Patterns, Systems Thinking, Testing, Tools, Trace Analysis Patterns, Troubleshooting Methodology, UI Problem Analysis Patterns, Unified Debugging Patterns, Victimware, Windows System Administration, Workaround Patterns | No Comments »
Wednesday, September 21st, 2011
Memoretics as a science of memory snapshots borrows many ideas from the following disciplines (the list is not exhaustive):
- Troubleshooting and Debugging
- Intelligence Analysis
- Critical Thinking
- Forensics
- Linguistics
- Archaeology
- Psychoanalysis
- History
- Mathematics: Sets and Categories
- Literary Criticism and Narratology
It also contributes many ideas back. The following diagram depicts such an interaction:

- Dmitry Vostokov @ DumpAnalysis.org + TraceAnalysis.org -
Posted in Archaeology of Computer Memory, Categorical Debugging, Computer Forensics, Computer Science, Countefactual Debugging, Crash Dump Analysis, Crash Dump De-analysis, Crash Dump Patterns, Debugging, Debugging Methodology, Dublin School of Security, Education and Research, Escalation Engineering, General Memory Analysis, Generative Debugging, Hermeneutics of Memory Dumps and Traces, History, Intelligence Analysis Patterns, M->analysis, Malware Analysis, Malware Patterns, Mathematics of Debugging, Memiotics (Memory Semiotics), Memoretics, Memory Analysis Forensics and Intelligence, Memory Dump Analysis and History, Memory Systems Language, Memory Visualization, Metadefect Template Library, Metamalware, New Debugging School, Paleo-debugging, Pattern Models, Pattern Prediction, Psychoanalysis of Software Maintenance and Support, Psychology, Reverse Engineering, Root Cause Analysis, Science of Memory Dump Analysis, Science of Software Tracing, Security, Software Architecture, Software Behavior DNA, Software Behavior Patterns, Software Behavioral Genome, Software Chorography, Software Chorology, Software Defect Construction, Software Engineering, Software Narratology, Software Technical Support, Software Trace Analysis, Software Trace Analysis and History, Software Trace Deconstruction, Software Trace Linguistics, Software Trace Reading, Software Trace Visualization, Software Tracing Implementation Patterns, Software Troubleshooting Patterns, Software Victimology, Software and History, Structural Memory Analysis and Social Sciences, Structural Memory Patterns, Structural Trace Patterns, Systems Thinking, Testing, Tools, Trace Analysis Patterns, Troubleshooting Methodology, UI Problem Analysis Patterns, Unified Debugging Patterns, Victimware, Virtualization, Visual Dump Analysis, Workaround Patterns | No Comments »
Thursday, May 26th, 2011
A few years ago when searching for interdisciplinary ideas via metaphorical bijections I found many parallels between memory dump analysis and intelligence. At that time I started reading a book Intelligence Analysis: A Target-Centric Approach, 2nd Edition (currently in the 3rd edition
 ). Now looking at the cover of that book I think it might have later unconsciously influenced the picture of RADII process:


After some break with studying intelligence I now resume it after I found that tapping (trace analysis patterns for general memory traces with extra uncertainty attribute) could be a good basis for intelligence analysis patterns. My recent jump into cyber warfare also contributed to that. As a fictional continuation from MIx line (MI5, MI6 *) I feel the need to create MIA to promote such ideas (it is a well known fact that MI6 initially started as an amateurish organization **).
* MI5 and MI6 both look to me as pool tags  GCHQ sounds like related to Garbage Collector
** Strategic Intelligence [5 volumes], Volume 1
- Dmitry Vostokov @ DumpAnalysis.org + TraceAnalysis.org -
Posted in Announcements, Cyber Warfare, Memory Analysis Forensics and Intelligence, Memory Intelligence Agency, Security, Software Trace Analysis | No Comments »
Sunday, May 22nd, 2011
Being deep into intelligence analysis while preparing for cyberwarfare memory dump analysis presentation I came to an idea of intelligence analysis patterns based on software trace analysis patterns and software narratology. Basically we consider intelligence data as pseudo-software trace messages with an additional probability field (column). Most of the patterns can be transferred and used immediately in intelligence analysis and I’m working on such a map. Because real software trace messages are quite certain (deterministic) where their sequences sometimes not (see, for example, Impossible Trace pattern) there are some unique patterns applicable only in intelligence analysis domain and I’m working on the first such pattern to introduce it in the next part.
- Dmitry Vostokov @ DumpAnalysis.org + TraceAnalysis.org -
Posted in Cyber Warfare, Intelligence Analysis Patterns, Memory Analysis Forensics and Intelligence, Security, Software Narratology, Software Trace Analysis, Software Trace Analysis and History, Trace Analysis Patterns | No Comments »
Tuesday, April 26th, 2011
Jobs page on Memory Dump, Software Trace, Debugging and Malware Analysis Portal now accepts company job ads related to security research, computer forensics, reverse engineering, and malware analysis in addition to debugging, software defect research, crash / core / memory dump and software trace analysis.
http://www.dumpanalysis.org/jobs
- Dmitry Vostokov @ DumpAnalysis.org + TraceAnalysis.org -
Posted in Announcements, Computer Forensics, Cyber Warfare, Malware Analysis, Memory Dump Analysis Jobs, Reverse Engineering, Security | No Comments »
Tuesday, April 26th, 2011
Sometimes I get cold phone calls (once it was from 012345678 number) and a guy asks me if I have a computer. I was always telling him that I’m a security professional and after that hanging up the phone. This morning I tried a different approach (SE - Social Engineer):
SE. We are Windows consulting services. Do you have a home computer?
Me. I’m sorry, we don’t have a computer.
SE. We can sell you the one. Are you interested?
Me. No, we are not. This is a temporary accommodation and we don’t need a computer.
SE. Sorry for bothering you.^x
- Dmitry Vostokov @ DumpAnalysis.org + TraceAnalysis.org -
Posted in Fun with Social Engineering, Security | 3 Comments »
Sunday, April 17th, 2011
I’m pleased to announce that MDAA, Volume 5 is available in PDF format:
www.dumpanalysis.org/Memory+Dump+Analysis+Anthology+Volume+5
It features:
- 25 new crash dump analysis patterns
- 11 new pattern interaction case studies (including software tracing)
- 16 new trace analysis patterns
- 7 structural memory patterns
- 4 modeling case studies for memory dump analysis patterns
- Discussion of 3 common analysis mistakes
- Malware analysis case study
- Computer independent architecture of crash analysis report service
- Expanded coverage of software narratology
- Metaphysical and theological implications of memory dump worldview
- More pictures of memory space and physicalist art
- Classification of memory visualization tools
- Memory visualization case studies
- Close reading of the stories of Sherlock Holmes: Dr. Watson’s observational patterns
- Fully cross-referenced with Volume 1, Volume 2, Volume 3, and Volume 4
Its table of contents is available here:
www.dumpanalysis.org/MDAA/MDA-Anthology-V5-TOC.pdf
Paperback and hardcover versions should be available in a week or two. I also started working on Volume 6 that should be available in November-December.
- Dmitry Vostokov @ DumpAnalysis.org + TraceAnalysis.org -
Posted in Aesthetics of Memory Dumps, Analysis Notation, Announcements, AntiPatterns, Archaeology of Computer Memory, Art, Assembly Language, Best Practices, Books, C and C++, CDF Analysis Tips and Tricks, Categorical Debugging, Citrix, Common Mistakes, Common Questions, Complete Memory Dump Analysis, Computer Forensics, Computer Science, Crash Analysis Report Environment (CARE), Crash Dump Analysis, Crash Dump De-analysis, Crash Dump Patterns, Crash Dumps for Dummies, Cyber Warfare, Debugging, Debugging Bureau, Debugging Industry, Debugging Methodology, Debugging Slang, Debugging Trends, Deep Down C++, Dr. Watson, Dublin School of Security, Education and Research, Escalation Engineering, Fun with Crash Dumps, Fun with Debugging, Fun with Software Traces, General Memory Analysis, Hermeneutics of Memory Dumps and Traces, Images of Computer Memory, Kernel Development, Malware Analysis, Mathematics of Debugging, Memiotics (Memory Semiotics), Memory Analysis Forensics and Intelligence, Memory Diagrams, Memory Dump Analysis Services, Memory Dumps in Myths, Memory Space Art, Memory Systems Language, Memory Visualization, Memory and Glitches, Metaphysics of Memory Worldview, Multithreading, Music for Debugging, New Acronyms, New Debugging School, New Words, Pattern Models, Philosophy, Physicalist Art, Publishing, Reverse Engineering, Science of Memory Dump Analysis, Science of Software Tracing, Security, Software Architecture, Software Behavior Patterns, Software Chorography, Software Chorology, Software Defect Construction, Software Engineering, Software Generalist, Software Maintenance Institute, Software Narratology, Software Technical Support, Software Trace Analysis, Software Trace Reading, Software Trace Visualization, Software Tracing for Dummies, Software Troubleshooting Patterns, Software Victimology, Structural Memory Patterns, Structural Trace Patterns, Systems Thinking, Testing, The Way of Philip Marlowe, Tools, Trace Analysis Patterns, Training and Seminars, Troubleshooting Methodology, Victimware, Vista, Webinars, WinDbg Scripting Extensions, WinDbg Scripts, WinDbg Tips and Tricks, WinDbg for GDB Users, Windows 7, Windows Server 2008, Windows System Administration, Workaround Patterns, x64 Windows | No Comments »
Monday, April 11th, 2011
Memory Dump Analysis Services plans a free Webinar in July to introduce a uniform methodology and tools for analysis of memory in cyber intelligence and counterintelligence activities.

- Dmitry Vostokov @ DumpAnalysis.org + TraceAnalysis.org -
Posted in Announcements, Crash Dump Analysis, Cyber Warfare, Memory Analysis Forensics and Intelligence, Memory Dump Analysis Services, Security, Software Trace Analysis, Tools, Training and Seminars, Webinars | No Comments »
Tuesday, April 5th, 2011
Finally, after the numerous delays, the first Windows Debugging Notebook is almost ready for publication by the end of this month with a new cover and a foreword written by Mario Hewardt, the author of Advanced Windows Debugging and Advanced .NET Debugging books:
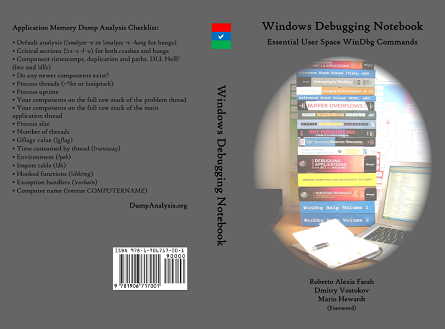
It is the first notebook because we have decided to split it into 3 different memory space volumes and one additional overview volume for concepts and tools:
- Windows Debugging Notebook: Essential User Space WinDbg Commands (ISBN: 978-1906717001 and 978-0955832857)
- Windows Debugging Notebook: Essential Kernel Space WinDbg Commands (ISBN: 978-1908043146)
- Windows Debugging Notebook: Essential Managed Space WinDbg .NET Commands (ISBN: 978-1908043153)
- Windows Debugging Notebook: Essential Concepts and Tools (ISBN: 978-1908043160)
On a bookshelf you would be able to distinguish between the first 3 volumes by a 3 color spine stripe with an appropriate check on it: red for kernel, blue for user, and green for managed space.
The Table of Contents has been changed too.
- Dmitry Vostokov @ DumpAnalysis.org + TraceAnalysis.org -
Posted in Announcements, Assembly Language, Books, Crash Dump Analysis, Debugging, Escalation Engineering, Publishing, Reverse Engineering, Security, Software Engineering, Software Technical Support, WinDbg Scripts, WinDbg Tips and Tricks | 2 Comments »
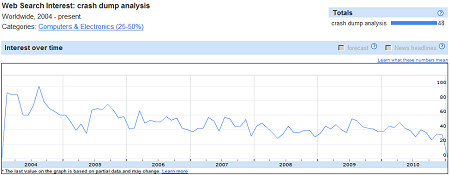
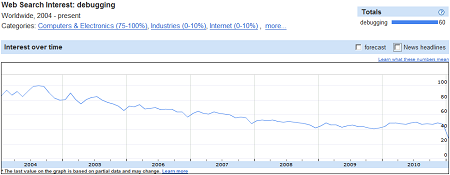
Monday, January 3rd, 2011
GI Index (Google Insights for Search) shows that crash dump analysis and debugging slowly decline in popularity:
GI for memory dump analysis searches coincides with the birth of DumpAnalysis.org in later 2006 (the only mystery for me is mid 2005 peak):
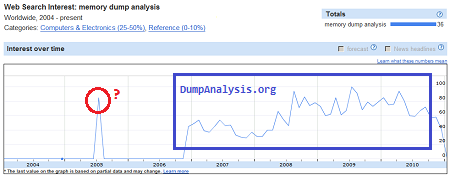
The birth of memory dump analysis as a discipline probably reinforced the emergence of memory forensics in the early 2006:
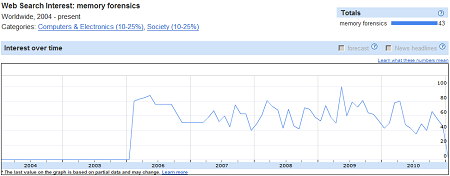
We also see that malware analysis is on the rise and it is not a surprise that DumpAnalysis.org is moving to MARS:
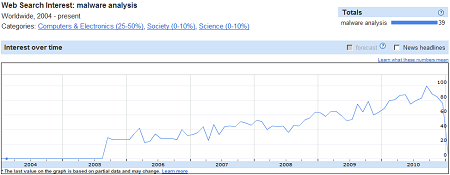
Perhaps mid 2005 peak for memory dump analysis searches coincides with the interest in malware analysis.
- Dmitry Vostokov @ DumpAnalysis.org + TraceAnalysis.org -
Posted in Announcements, Crash Dump Analysis, Debugging, History, Malware Analysis, Memoretics, Memory Analysis Forensics and Intelligence, Security | No Comments »