Archive for the ‘Kernel Development’ Category
Friday, July 13th, 2012
For some time I was struggling with finding a good name for memory dump and software trace analysis activities. The name Memoretics I use for the science of memory dump analysis (that also incorporates software traces) seems not so good to describe the whole practical activity that should be transparent to everyone in IT. Fortunately, I timely understood that all these activities constitute the essence of software diagnostics that previously lacked any solid foundation. Thus, Software Diagnostics Institute was reborn from the previous Crash Dump Analysis Portal. This institute does pure and applied research and scientific activities and in recent years was funded mainly from OpenTask publisher and recently from Memory Dump Analysis Services. The latter company also recognized that the broadening of its commercial activities requires a new name. So, Software Diagnostics Services was reborn:
The First Comprehensive Software Diagnostics Service
- Dmitry Vostokov @ DumpAnalysis.org + TraceAnalysis.org -
Posted in Announcements, Cloud Memory Dump Analysis, Complete Memory Dump Analysis, Core Dump Analysis, Crash Analysis Report Environment (CARE), Crash Dump Analysis, Debugging, Debugging Bureau, Debugging Industry, Debugging Methodology, Debugging Today, Debugging Trends, Education, Education and Research, Escalation Engineering, Event Tracing for Windows (ETW), First Fault Software Diagnostics, Generative Debugging, JIT Crash Analysis, JIT Memory Space Analysis, Java Debugging, Kernel Development, Kernel Memory Dump Analysis, Linux Crash Corner, MFC Debugging, Mac Crash Corner, Mac OS X, Malware Analysis, Memoretics, Memory Analysis Forensics and Intelligence, Memory Analysis Report System, Memory Dump Analysis Methodology, Memory Dump Analysis Services, Minidump Analysis, New Debugging School, Pattern-Driven Debugging, Pattern-Driven Software Support, Performance Monitoring, Root Cause Analysis, SQL Debugging, Security, Software Debugging Services, Software Diagnostics, Software Diagnostics Institute, Software Diagnostics Services, Software Engineering, Software Problem Solving, Software Technical Support, Software Trace Analysis, Software Trace Analysis Report Environment (STARE), Tools, Training and Seminars, Troubleshooting Methodology, Unified Software Diagnostics, Windows 7, Windows 8, Windows Azure, Windows Mobile, Windows Server 2008, Windows System Administration, x64 Mac OS X, x64 Windows | No Comments »
Sunday, April 15th, 2012
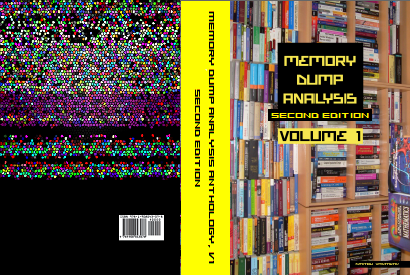
After 4 years in print this bestselling title needs an update to address minor changes, include extra examples and reference additional research published in Volumes 2, 3, 4, 5 and 6.
- Title: Memory Dump Analysis Anthology, Volume 1
- Author: Dmitry Vostokov
- Publisher: OpenTask (Summer 2012)
- Language: English
- Product Dimensions: 22.86 x 15.24
- Paperback: 800 pages
- ISBN-13: 978-1-908043-35-1
- Hardcover: 800 pages
- ISBN-13: 978-1-908043-36-8
The cover for both paperback and hardcover titles will also have a matte finish. We used A Memory Window artwork for the back cover.

- Dmitry Vostokov @ DumpAnalysis.org + TraceAnalysis.org -
Posted in Aesthetics of Memory Dumps, Announcements, AntiPatterns, Art, Assembly Language, Best Practices, Books, Bugchecks Depicted, C and C++, Complete Memory Dump Analysis, Computer Science, Crash Dump Analysis, Crash Dump Patterns, Crash Dumps for Dummies, Debugging, Debugging Methodology, Dr. Watson, Escalation Engineering, Fun with Crash Dumps, GDB for WinDbg Users, Hardware, Images of Computer Memory, Kernel Development, Mathematics of Debugging, Memiotics (Memory Semiotics), Memoretics, Memory Dump Analysis Methodology, Memory Space Art, Memory Space Music, Memory Visualization, Minidump Analysis, Multithreading, Pattern-Driven Debugging, Pattern-Driven Software Support, Publishing, Reference, Root Cause Analysis, Science of Memory Dump Analysis, Software Architecture, Software Behavior DNA, Software Behavior Patterns, Software Behavioral Genome, Software Diagnostics, Software Engineering, Software Technical Support, Stack Trace Collection, Testing, Tools, Troubleshooting Methodology, Vista, WinDbg Scripts, WinDbg Tips and Tricks, WinDbg for GDB Users, Windows 7, Windows Data Structures, Windows Server 2008, Windows System Administration, x64 Windows | No Comments »
Thursday, March 22nd, 2012
This is another “blockage” pattern called Blocked DPC. Here we have blocked per-processor Deferred Procedure Call queues because of threads running on processors with IRQL > DISPATCH_LEVEL. For example, on the processor 11 (0×0b):
11: kd> !dpcs

CPU Type      KDPC       Function

3: Normal  : 0x8accacec 0xf710567a DriverA
5: Normal : 0x89f449e4 0xf595b83a DriverB
7: Normal : 0x8a63664c 0xf59e3f04 USBPORT!USBPORT_IsrDpc
11: Normal  : 0x8acb2cec 0xf710567a DriverA

11: Normal  : 0x8b5e955c 0xf73484e6 ACPI!ACPIInterruptServiceRoutineDPC
11: kd> !thread

THREAD 89806428  Cid 0934.0944  Teb: 7ffdb000 Win32Thread: bc17dda0 RUNNING on processor b

Not impersonating

DeviceMap                 e1002258

Owning Process            89972290       Image:         ApplicationA.exe

Attached Process          N/A            Image:         N/A

Wait Start TickCount      2863772        Ticks: 368905 (0:01:36:04.140)

Context Switch Count      145085                 LargeStack

UserTime                  00:00:00.015

KernelTime                01:36:04.203

Win32 Start Address MSVCR90!_threadstartex (0×7854345e)

Start Address kernel32!BaseThreadStartThunk (0×77e617ec)

Stack Init f3f63000 Current f3f62c4c Base f3f63000 Limit f3f5f000 Call 0

Priority 10 BasePriority 10 PriorityDecrement 0

ChildEBP RetAddr  Args to Child

f777d3b0 f3f62d28 00000010 00000000 00000000 hal!KeAcquireInStackQueuedSpinLockRaiseToSynch+0×36

WARNING: Frame IP not in any known module. Following frames may be wrong.

f777d3b4 00000000 00000000 00000000 00000000 0xf3f62d28
- Dmitry Vostokov @ DumpAnalysis.org + TraceAnalysis.org -
Posted in Crash Dump Analysis, Debugging, Kernel Development | No Comments »
Friday, January 27th, 2012
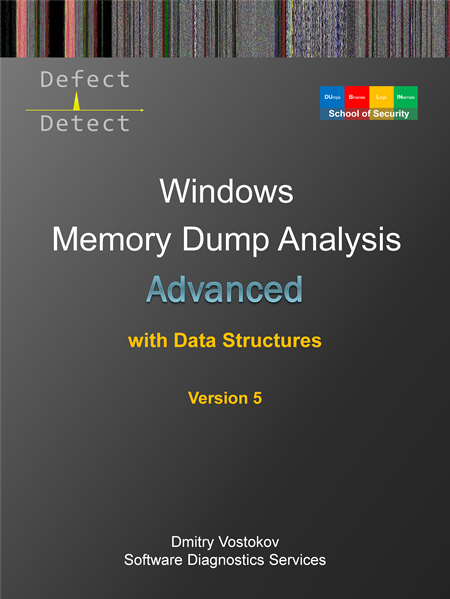
Advanced training sessions time may not suitable due to different geographic time zones. So I have decided to publish this training in a book format (currently in PDF) and make it available in paperback on Amazon and B&N later. Book details:
- Title: Advanced Windows Memory Dump Analysis with Data Structures: Training Course Transcript and WinDbg Practice Exercises with Notes
- Description: The full transcript of Memory Dump Analysis Services Training with 10 step-by-step exercises, notes, and selected Q&A.
- Authors: Dmitry Vostokov, Memory Dump Analysis Services
- Publisher: OpenTask (January 2012)
- Language: English
- Product Dimensions: 28.0 x 21.6
- Paperback: 180 pages
- ISBN-13: 978-1908043344

Table of Contents
Now available for sale in PDF format from Memory Dump Analysis Services.
- Dmitry Vostokov @ DumpAnalysis.org + TraceAnalysis.org -
Posted in Announcements, Books, Complete Memory Dump Analysis, Crash Dump Analysis, Crash Dump Patterns, Debugging, Escalation Engineering, Kernel Development, Memory Dump Analysis Services, Publishing, Software Technical Support, Training and Seminars, Uses of UML, WinDbg Scripts, WinDbg Tips and Tricks, x64 Windows | No Comments »
Wednesday, January 11th, 2012
In addition to stack trace collections for threads (unmanaged, managed and predicate) we introduce an additional pattern for I/O requests. Such requests are implemented via the so called I/O request packets (IRP) that “travel” from a device driver to a device driver similar to a C++ class method to another C++ class method (where a device object address is similar to a C++ object instance address). An IRP stack is used to keep a track of the current driver which is processing an IRP that is reused between device drivers. Its is basically an array of structures describing how a particular driver function was called with appropriate parameters similar to a call frame on an execution thread stack. Long time ago I created an UML diagram depicting the flow of an IRP through the driver (device) stack (diagram #3). An I/O stack location pointer is decremented (from the bottom to the top) like a thread stack pointer (ESP or RSP). We can list active and completed I/O requests with their stack traces using !irpfind -v WinDbg command:
1: kd> !irpfind -v
Scanning large pool allocation table for Tag: Irp? (832c7000 : 833c7000)
Irp    [ Thread ] irpStack: (Mj,Mn)   DevObj  [Driver]         MDL Process

8883dc18: Irp is active with 1 stacks 1 is current (= 0x8883dc88)

No Mdl: No System Buffer: Thread 888f8950:  Irp stack trace.

cmd  flg cl Device   File     Completion-Context

>[  d, 0]   5  1 88515ae8 888f82f0 00000000-00000000    pending

\FileSystem\Npfs

Args: 00000000 00000000 00110008 00000000
891204c8: Irp is active with 1 stacks 1 is current (= 0x89120538)

No Mdl: No System Buffer: Thread 889635b0:  Irp stack trace.

cmd  flg cl Device   File     Completion-Context

>[  3, 0]   0  1 88515ae8 84752028 00000000-00000000    pending

\FileSystem\Npfs

Args: 0000022a 00000000 00000000 00000000
89120ce8: Irp is active with 1 stacks 1 is current (= 0x89120d58)

No Mdl: No System Buffer: Thread 89212030:  Irp stack trace.

cmd  flg cl Device   File     Completion-Context

>[  3, 0]   0  1 88515ae8 8921be00 00000000-00000000    pending

\FileSystem\Npfs

Args: 0000022a 00000000 00000000 00000000

Searching NonPaged pool (80000000 : ffc00000) for Tag: Irp?
[...]
892cbe48: Irp is active with 9 stacks 9 is current (= 0x892cbfd8)

No Mdl: No System Buffer: Thread 892add78:  Irp stack trace.

cmd  flg cl Device   File     Completion-Context

[  0, 0]   0  0 00000000 00000000 00000000-00000000
Args: 00000000 00000000 00000000 00000000

[  0, 0]   0  0 00000000 00000000 00000000-00000000
Args: 00000000 00000000 00000000 00000000

[  0, 0]   0  0 00000000 00000000 00000000-00000000
Args: 00000000 00000000 00000000 00000000

[  0, 0]   0  0 00000000 00000000 00000000-00000000
Args: 00000000 00000000 00000000 00000000

[  0, 0]   0  0 00000000 00000000 00000000-00000000
Args: 00000000 00000000 00000000 00000000

[  0, 0]   0  0 00000000 00000000 00000000-00000000
Args: 00000000 00000000 00000000 00000000

[  0, 0]   0  0 00000000 00000000 00000000-00000000
Args: 00000000 00000000 00000000 00000000

[  0, 0]   0  0 00000000 00000000 00000000-00000000
Args: 00000000 00000000 00000000 00000000

>[  c, 2]   0  1 8474a020 892c8c80 00000000-00000000    pending

\FileSystem\Ntfs

Args: 00000800 00000002 00000000 00000000
892daa88: Irp is active with 4 stacks 4 is current (= 0x892dab64)

No Mdl: System buffer=831559c8: Thread 8322c8e8:  Irp stack trace.

cmd  flg cl Device   File     Completion-Context

[  0, 0]   0  0 00000000 00000000 00000000-00000000
Args: 00000000 00000000 00000000 00000000

[  0, 0]   0  0 00000000 00000000 00000000-00000000
Args: 00000000 00000000 00000000 00000000

[  0, 0]   0  0 00000000 00000000 00000000-00000000
Args: 00000000 00000000 00000000 00000000

>[  e,2d]   5  1 884ba750 83190c40 00000000-00000000    pending

\Driver\AFD

Args: 890cbc44 890cbc44 88e55297 8943b6c8
892ea4e8: Irp is active with 4 stacks 4 is current (= 0x892ea5c4)

No Mdl: No System Buffer: Thread 00000000:  Irp stack trace.  Pending has been returned

cmd  flg cl Device   File     Completion-Context

[  0, 0]   0  2 00000000 00000000 00000000-00000000
Args: 00000000 00000000 00000000 c0000185

[  0, 0]   0  0 00000000 00000000 00000000-00000000
Args: 00000000 00000000 00000000 00000000

[  f, 0]   0  2 83a34bb0 00000000 84d779ed-88958050

\Driver\atapi CLASSPNP!ClasspMediaChangeDetectionCompletion

Args: 88958050 00000000 00000000 83992d10

>[  0, 0]   2  0 891ee030 00000000 00000000-00000000

\Driver\cdrom

Args: 00000000 00000000 00000000 00000000
8933fcb0: Irp is active with 1 stacks 1 is current (= 0x8933fd20)

No Mdl: No System Buffer: Thread 84753d78:  Irp stack trace.

cmd  flg cl Device   File     Completion-Context

>[  3, 0]   0  1 88515ae8 84759f40 00000000-00000000    pending

\FileSystem\Npfs

Args: 0000022a 00000000 00000000 00000000
893cf550: Irp is active with 1 stacks 1 is current (= 0x893cf5c0)

No Mdl: No System Buffer: Thread 888fd3b8:  Irp stack trace.

cmd  flg cl Device   File     Completion-Context

>[  3, 0]   0  1 88515ae8 834d30d0 00000000-00000000    pending

\FileSystem\Npfs

Args: 00000400 00000000 00000000 00000000
893da468: Irp is active with 6 stacks 7 is current (= 0x893da5b0)

Mdl=892878f0: No System Buffer: Thread 00000000:  Irp is completed.  Pending has been returned

cmd  flg cl Device   File     Completion-Context

[  0, 0]   0  0 00000000 00000000 00000000-00000000
Args: 00000000 00000000 00000000 00000000

[  0, 0]   0  0 00000000 00000000 00000000-00000000
Args: 00000000 00000000 00000000 00000000

[  0, 0]   0  0 00000000 00000000 00000000-00000000
Args: 00000000 00000000 00000000 00000000

[  0, 0]   0  0 00000000 00000000 00000000-00000000
Args: 00000000 00000000 00000000 00000000

[  f, 0]   0  0 84b3e028 00000000 9747fcd0-00000000

\Driver\usbehci USBSTOR!USBSTOR_CswCompletion

Args: 00000000 00000000 00000000 00000000

[  f, 0]   0  0 892ba8f8 00000000 84d780ce-8328e0f0

\Driver\USBSTOR CLASSPNP!TransferPktComplete

Args: 00000000 00000000 00000000 00000000
893efb00: Irp is active with 10 stacks 11 is current (= 0x893efcd8)

Mdl=83159378: No System Buffer: Thread 82b7f828:  Irp is completed.  Pending has been returned

cmd  flg cl Device   File     Completion-Context

[  0, 0]   0  0 00000000 00000000 00000000-00000000
Args: 00000000 00000000 00000000 00000000

[  0, 0]   0  0 00000000 00000000 00000000-00000000
Args: 00000000 00000000 00000000 00000000

[  0, 0]   0  0 00000000 00000000 00000000-00000000
Args: 00000000 00000000 00000000 00000000

[  0, 0]   0  0 00000000 00000000 00000000-00000000
Args: 00000000 00000000 00000000 00000000

[  0, 0]   0  0 00000000 00000000 00000000-00000000
Args: 00000000 00000000 00000000 00000000

[  0, 0]   0  0 00000000 00000000 00000000-00000000
Args: 00000000 00000000 00000000 00000000

[  3, 0]   0  0 885a55b8 00000000 81614138-00000000

\Driver\disk partmgr!PmReadWriteCompletion

Args: 00000000 00000000 00000000 00000000

[  3, 0]   0  0 89257c90 00000000 8042e4d4-831caab0

\Driver\partmgr volmgr!VmpReadWriteCompletionRoutine

Args: 00000000 00000000 00000000 00000000

[  3, 0]   0  0 831ca9f8 00000000 84dad0be-00000000

\Driver\volmgr ecache!EcDispatchReadWriteCompletion

Args: 00000000 00000000 00000000 00000000

[  3, 0]   0  0 8319c020 00000000 84dcc4d4-8576f8ac

\Driver\Ecache volsnap!VspSignalCompletion

Args: 00000000 00000000 00000000 00000000
- Dmitry Vostokov @ DumpAnalysis.org + TraceAnalysis.org -
Posted in Crash Dump Analysis, Crash Dump Patterns, Debugging, Kernel Development, Stack Trace Collection, Uses of UML, WinDbg Tips and Tricks | No Comments »
Thursday, November 3rd, 2011
The new 6th volume contains revised, edited, cross-referenced, and thematically organized selected DumpAnalysis.org blog posts about memory dump and software trace analysis, software troubleshooting and debugging written in November 2010 - October 2011 for software engineers developing and maintaining products on Windows platforms, quality assurance engineers testing software on Windows platforms, technical support and escalation engineers dealing with complex software issues, and security researchers, malware analysts and reverse engineers. The sixth volume features:
- 56 new crash dump analysis patterns including 14 new .NET memory dump analysis patterns
- 4 new pattern interaction case studies
- 11 new trace analysis patterns
- New Debugware pattern
- Introduction to UI problem analysis patterns
- Introduction to intelligence analysis patterns
- Introduction to unified debugging pattern language
- Introduction to generative debugging, metadefect template library and DNA of software behaviour
- The new school of debugging and trends
- .NET memory dump analysis checklist
- Software trace analysis checklist
- Introduction to close and deconstructive readings of a software trace
- Memory dump analysis compass
- Computical and Stack Trace Art
- The abductive reasoning of Philip Marlowe
- Orbifold memory space and cloud computing
- Memory worldview
- Interpretation of cyberspace
- Relationship of memory dumps to religion
- Fully cross-referenced with Volume 1, Volume 2, Volume 3, Volume 4, and Volume 5
Product information:
- Title: Memory Dump Analysis Anthology, Volume 6
- Author: Dmitry Vostokov
- Language: English
- Product Dimensions: 22.86 x 15.24
- Paperback: 300 pages
- Publisher: Opentask (December 2011)
- ISBN-13: 978-1-908043-19-1
- Hardcover: 300 pages
- Publisher: Opentask (January 2012)
- ISBN-13: 978-1-908043-20-7

Back cover features 3d memory space visualization image created with ParaView.
- Dmitry Vostokov @ DumpAnalysis.org + TraceAnalysis.org -
Posted in .NET Debugging, Announcements, Art, Books, Cloud Computing, Cloud Memory Dump Analysis, Common Mistakes, Complete Memory Dump Analysis, Computer Science, Computicart (Computical Art), Crash Dump Analysis, Crash Dump Patterns, Cyber Intelligence, Cyber Problems, Cyber Security, Cyber Space, Cyber Warfare, DebugWare Patterns, Debugging, Debugging Industry, Debugging Methodology, Debugging Slang, Debugging Trends, Escalation Engineering, Generative Debugging, Intelligence Analysis Patterns, Kernel Development, Memoidealism, Memoretics, Memory Visualization, Metadefect Template Library, New Debugging School, Philosophy, Physicalist Art, Publishing, Root Cause Analysis, Science of Memory Dump Analysis, Science of Software Tracing, Security, Software Behavior DNA, Software Behavior Patterns, Software Behavioral Genome, Software Engineering, Software Narratology, Software Technical Support, Software Trace Analysis, Software Trace Deconstruction, Software Trace Reading, Software Victimology, Testing, The Way of Philip Marlowe, Tools, Trace Analysis Patterns, Training and Seminars, Troubleshooting Methodology, UI Problem Analysis Patterns, Unified Debugging Patterns, Victimware, WinDbg Tips and Tricks, Windows 7, Windows Azure, Windows Data Structures, Windows Server 2008, Windows System Administration, x64 Windows | No Comments »
Friday, October 7th, 2011
Similar to Double Free (process heap) and Double Free (kernel pool) that might be detected through instrumentation such as gflags and Driver Verifier there is also an IRP double completion variant implemented through Self-Diagnosis (kernel mode). Here’s a typical example:
0: kd> !analyze -v
[...]
MULTIPLE_IRP_COMPLETE_REQUESTS (44)

A driver has requested that an IRP be completed (IoCompleteRequest()), but the packet has already been completed. This is a tough bug to find because the easiest case, a driver actually attempted to complete its own packet twice, is generally not what happened.  Rather, two separate drivers each believe that they own the packet, and each attempts to complete it.  The first actually works, and the second fails.  Tracking down which drivers in the system actually did this is difficult, generally because the trails of the first driver have been covered by the second.  However, the driver stack for the current request can be found by examining the DeviceObject fields in each of the stack locations.

Arguments:

Arg1: fffffa80104aa010, Address of the IRP

Arg2: 0000000000000eae

Arg3: 0000000000000000

Arg4: 0000000000000000
STACK_TEXT:

fffff880`0e322428 fffff800`01666224 : 00000000`00000044 fffffa80`104aa010 00000000`00000eae 00000000`00000000 : nt!KeBugCheckEx

fffff880`0e322430 fffff880`03dd121f : fffffa80`0dc12c50 fffffa80`107750c8 fffffa80`104aa010 fffff880`0e322580 : nt! ?? ::FNODOBFM::`string'+0x3eb3d

fffff880`0e322520 fffff880`03def17f : fffffa80`0dc12c50 fffffa80`104aa010 fffffa80`0cacb610 00000000`00000001 : DriverA!DriverA::Create+0x3bf

[...]

fffff880`0e322740 fffff800`01972ba4 : fffffa80`0dc129f0 00000000`00000000 fffffa80`0fe7a010 00000000`00000001 : nt!IopParseDevice+0x5a7

fffff880`0e3228d0 fffff800`01977b7d : fffffa80`0fe7a010 fffff880`0e322a30 fffffa80`00000040 fffffa80`0cae5080 : nt!ObpLookupObjectName+0x585

fffff880`0e3229d0 fffff800`0197e647 : 00000000`000007ff 00000000`00000003 fffff8a0`05716d01 00000000`00000000 : nt!ObOpenObjectByName+0x1cd

fffff880`0e322a80 fffff800`01988398 : 00000000`03f3e510 fffff8a0`c0100000 fffff8a0`0c26fe50 00000000`03f3e118 : nt!IopCreateFile+0x2b7

fffff880`0e322b20 fffff800`0167b813 : fffffa80`0e10db30 00000000`00000001 fffffa80`1002b060 fffff800`0198f294 : nt!NtCreateFile+0x78

fffff880`0e322bb0 00000000`772efc0a : 000007fe`f62c358f 00000000`03f3e1b0 00000000`7719fd72 000007fe`f62c6490 : nt!KiSystemServiceCopyEnd+0x13

00000000`03f3e068 000007fe`f62c358f : 00000000`03f3e1b0 00000000`7719fd72 000007fe`f62c6490 00000000`00000005 : ntdll!NtCreateFile+0xa
[...]
0: kd> !irp fffffa80104aa010

Irp is active with 1 stacks 3 is current (= 0xfffffa80104aa170)

 No Mdl: No System Buffer: Thread fffffa801002b060:  Irp is completed.  Pending has been returned

     cmd  flg cl Device   File     Completion-Context

 [  0, 0]   0  2 fffffa800dc129f0 00000000 00000000-00000000

        \Driver\DriverA

   Args: 00000000 00000000 00000000 ffffffffc00a0006
- Dmitry Vostokov @ DumpAnalysis.org + TraceAnalysis.org -
Posted in Crash Dump Analysis, Crash Dump Patterns, Debugging, Kernel Development | No Comments »
Sunday, August 14th, 2011
Due to the need to extend existing basic and intermediate Accelerated Windows Memory Dump Analysis training Memory Dump Analysis Services organises advanced training course. Here is the description and registration information:
Learn how to navigate through memory dump space and Windows data structures to troubleshoot and debug complex software incidents. We use a unique and innovative pattern-driven analysis approach to speed up the learning curve. The training consists of practical step-by-step exercises using WinDbg to diagnose structural and behavioral patterns in 32-bit and 64-bit process, kernel and complete memory dumps.

If you are registered you are allowed to optionally submit your memory dumps before the training. This will allow us in addition to the carefully constructed problems tailor extra examples to the needs of the attendees.
The training consists of one four-hour session and additional homework exercises. When you finish the training you additionally get:
- A full transcript in PDF format (retail price $200)
- 5 volumes of Memory Dump Analysis Anthology in PDF format (retail price $100)
- A personalized attendance certificate with unique CID (PDF format)
Prerequisites: Basic and intermediate level Windows memory dump analysis: ability to list processors, processes, threads, modules, apply symbols, walk through stack traces and raw stack data, diagnose patterns such as heap corruption, CPU spike, memory and handle leaks, access violation, stack overflow, critical section and resource wait chains and deadlocks. If you don’t feel comfortable with prerequisites then Accelerated Windows Memory Dump Analysis training is recommended to take (or purchase a corresponding book) before attending this course.
Audience: Software developers, software technical support and escalation engineers.
Session: December 9, 2011 4:00 PM - 8:00 PM GMT
Price: 210 USD
Space is limited.
Reserve your remote training seat now at:
https://student.gototraining.com/24s4l/register/3788047691824598784
- Dmitry Vostokov @ DumpAnalysis.org + TraceAnalysis.org -
Posted in Announcements, Complete Memory Dump Analysis, Crash Dump Analysis, Crash Dump Patterns, Debugging, Escalation Engineering, Kernel Development, Memory Dump Analysis Services, Multithreading, Reverse Engineering, Root Cause Analysis, Software Engineering, Software Technical Support, Structural Memory Patterns, Training and Seminars, Uses of UML, Vista, WinDbg Scripts, WinDbg Tips and Tricks, Windows 7, Windows Data Structures, Windows Server 2008, x64 Windows | No Comments »
Tuesday, May 24th, 2011
One of the questions asked during Introduction to Pattern-Driven Software Problem Solving Webinar was how to map bugcheck codes to crash dump analysis patterns. I’m starting this post to provide a few initial mappings and plan to extend it later.
- Dmitry Vostokov @ DumpAnalysis.org + TraceAnalysis.org -
Posted in Bugchecks Depicted, Crash Dump Analysis, Crash Dump Patterns, Debugging, Kernel Development | No Comments »
Sunday, April 17th, 2011
I’m pleased to announce that MDAA, Volume 5 is available in PDF format:
www.dumpanalysis.org/Memory+Dump+Analysis+Anthology+Volume+5
It features:
- 25 new crash dump analysis patterns
- 11 new pattern interaction case studies (including software tracing)
- 16 new trace analysis patterns
- 7 structural memory patterns
- 4 modeling case studies for memory dump analysis patterns
- Discussion of 3 common analysis mistakes
- Malware analysis case study
- Computer independent architecture of crash analysis report service
- Expanded coverage of software narratology
- Metaphysical and theological implications of memory dump worldview
- More pictures of memory space and physicalist art
- Classification of memory visualization tools
- Memory visualization case studies
- Close reading of the stories of Sherlock Holmes: Dr. Watson’s observational patterns
- Fully cross-referenced with Volume 1, Volume 2, Volume 3, and Volume 4
Its table of contents is available here:
www.dumpanalysis.org/MDAA/MDA-Anthology-V5-TOC.pdf
Paperback and hardcover versions should be available in a week or two. I also started working on Volume 6 that should be available in November-December.
- Dmitry Vostokov @ DumpAnalysis.org + TraceAnalysis.org -
Posted in Aesthetics of Memory Dumps, Analysis Notation, Announcements, AntiPatterns, Archaeology of Computer Memory, Art, Assembly Language, Best Practices, Books, C and C++, CDF Analysis Tips and Tricks, Categorical Debugging, Citrix, Common Mistakes, Common Questions, Complete Memory Dump Analysis, Computer Forensics, Computer Science, Crash Analysis Report Environment (CARE), Crash Dump Analysis, Crash Dump De-analysis, Crash Dump Patterns, Crash Dumps for Dummies, Cyber Warfare, Debugging, Debugging Bureau, Debugging Industry, Debugging Methodology, Debugging Slang, Debugging Trends, Deep Down C++, Dr. Watson, Dublin School of Security, Education and Research, Escalation Engineering, Fun with Crash Dumps, Fun with Debugging, Fun with Software Traces, General Memory Analysis, Hermeneutics of Memory Dumps and Traces, Images of Computer Memory, Kernel Development, Malware Analysis, Mathematics of Debugging, Memiotics (Memory Semiotics), Memory Analysis Forensics and Intelligence, Memory Diagrams, Memory Dump Analysis Services, Memory Dumps in Myths, Memory Space Art, Memory Systems Language, Memory Visualization, Memory and Glitches, Metaphysics of Memory Worldview, Multithreading, Music for Debugging, New Acronyms, New Debugging School, New Words, Pattern Models, Philosophy, Physicalist Art, Publishing, Reverse Engineering, Science of Memory Dump Analysis, Science of Software Tracing, Security, Software Architecture, Software Behavior Patterns, Software Chorography, Software Chorology, Software Defect Construction, Software Engineering, Software Generalist, Software Maintenance Institute, Software Narratology, Software Technical Support, Software Trace Analysis, Software Trace Reading, Software Trace Visualization, Software Tracing for Dummies, Software Troubleshooting Patterns, Software Victimology, Structural Memory Patterns, Structural Trace Patterns, Systems Thinking, Testing, The Way of Philip Marlowe, Tools, Trace Analysis Patterns, Training and Seminars, Troubleshooting Methodology, Victimware, Vista, Webinars, WinDbg Scripting Extensions, WinDbg Scripts, WinDbg Tips and Tricks, WinDbg for GDB Users, Windows 7, Windows Server 2008, Windows System Administration, Workaround Patterns, x64 Windows | No Comments »
Tuesday, April 5th, 2011
This is a kernel space counterpart to Custom Exception Handler pattern in user space. In the following stack trace below we see that DriverA code intercepted an access violation exception resulted from dereferencing a NULL pointer and generated a custom bugcheck:
kd> !analyze -v
[...]
EXCEPTION_RECORD: fffff8801c757158 -- (.exr 0xfffff8801c757158)

ExceptionAddress: fffff88003977de1 (DriverA!foo+0x0000000000000381)

ExceptionCode: c0000005 (Access violation)

  ExceptionFlags: 00000000

NumberParameters: 2

  Parameter[0]: 0000000000000000

  Parameter[1]: 0000000000000070

Attempt to read from address 0000000000000070
TRAP_FRAME: fffff8801c757200 -- (.trap 0xfffff8801c757200)

NOTE: The trap frame does not contain all registers.

Some register values may be zeroed or incorrect.

rax=0000000000000000 rbx=0000000000000000 rcx=fffff8a00da3f3c0

rdx=0000000000000000 rsi=0000000000000000 rdi=0000000000000000

rip=fffff88003977de1 rsp=fffff8801c757390 rbp=fffffa8009a853f0

 r8=0000000000000000 r9=0000000000000000 r10=006800740020006e

r11=fffff8a00da3f3c6 r12=0000000000000000 r13=0000000000000000

r14=0000000000000000 r15=0000000000000000

iopl=0 nv up ei pl zr na po nc

DriverA!foo+0×381:

fffff880`03977de1 0fb74070 movzx eax,word ptr [rax+70h] ds:0703:0070=????

Resetting default scope
[...]
kd> kL 100

Child-SP          RetAddr           Call Site

fffff880`1c7560f8 fffff880`039498f7 nt!KeBugCheckEx

fffff880`1c756100 fffff880`039352a0 DriverA!MyBugCheckEx+0×93

fffff880`1c756140 fffff800`016f1d1c DriverA!MyExceptionFilter+0×1d0

fffff880`1c756210 fffff800`016e940d nt!_C_specific_handler+0×8c

fffff880`1c756280 fffff800`016f0a90 nt!RtlpExecuteHandlerForException+0xd

fffff880`1c7562b0 fffff800`016fd9ef nt!RtlDispatchException+0×410

fffff880`1c756990 fffff800`016c2d82 nt!KiDispatchException+0×16f

fffff880`1c757020 fffff800`016c18fa nt!KiExceptionDispatch+0xc2

fffff880`1c757200 fffff880`03977de1 nt!KiPageFault+0×23a

fffff880`1c757390 fffff880`03977754 DriverA!foo+0×381

fffff880`1c757430 fffff880`0396f006 DriverA!bar+0×74

[…]

fffff880`1c7579b0 fffff800`019a6e0a DriverA!QueryInformation+0×30b

fffff880`1c757a70 fffff800`016c2993 nt!NtQueryInformationFile+0×535

fffff880`1c757bb0 00000000`76e5fe6a nt!KiSystemServiceCopyEnd+0×13

00000000`0a08dfe8 00000000`00000000 0×76e5fe6a
kd> !exchain

24 stack frames, scanning for handlers...

Frame 0×05: nt!RtlpExecuteHandlerForException+0xd (fffff800`016e940d)

  ehandler nt!RtlpExceptionHandler (fffff800`016e93d0)

Frame 0×07: nt!KiDispatchException+0×16f (fffff800`016fd9ef)

  ehandler nt!_GSHandlerCheck_SEH (fffff800`0169aec0)

Frame 0×0b: DriverA!bar+0×74 (fffff880`03977754)

  ehandler DriverA!__GSHandlerCheck (fffff880`039a12fc)

[…]

Frame 0×14: DriverA!QueryInformation+0×30b (fffff880`039303ab)

  ehandler DriverA!_C_specific_handler (fffff880`039a1864)

Frame 0×15: nt!NtQueryInformationFile+0×535 (fffff800`019a6e0a)

  ehandler nt!_C_specific_handler (fffff800`016f1c90)

Frame 0×16: nt!KiSystemServiceCopyEnd+0×13 (fffff800`016c2993)

  ehandler nt!KiSystemServiceHandler (fffff800`016c2580)

Frame 0×17: error getting module for 0000000076e5fe6a
- Dmitry Vostokov @ DumpAnalysis.org + TraceAnalysis.org -
Posted in Crash Dump Analysis, Crash Dump Patterns, Debugging, Kernel Development, x64 Windows | No Comments »
Tuesday, March 1st, 2011
Stack Overflow pattern variants in user and kernel mode are ISA (Instruction Set Architecture) and processor architecture oriented. Another pattern variant is software stack implementations where push and pop operations check stack ADT preconditions and throw a software exception (overflow or underflow) or call an assertion mechanism to display an error message. For the latter example, we look at a bugcheck for the specific stack implementation on Windows: IRP stack locations array. For a graphical reminder on how driver-to-driver communication is implemented by an IRP stack corresponding to a driver stack please refer to UML diagram no. 3 in the old post about using UML for describing device driver design. The following WinDbg command output is from a kernel memory dump:
0: kd> !analyze -v

[...]

NO_MORE_IRP_STACK_LOCATIONS (35)

A higher level driver has attempted to call a lower level driver through the IoCallDriver() interface, but there are no more stack locations in the packet, hence, the lower level driver would not be able to access its parameters, as there are no parameters for it. This is a disasterous situation, since the higher level driver "thinks" it has filled in the parameters for the lower level driver (something it MUST do before it calls it), but since there is no stack location for the latter driver, the former has written off of the end of the packet.  This means that some other memory has probably been trashed at this point.

Arguments:

Arg1: fffffa800500c9e0, Address of the IRP

Arg2: 0000000000000000

Arg3: 0000000000000000

Arg4: 0000000000000000

[…]
0: kd> kL 100

Child-SP          RetAddr           Call Site

fffff880`01fe2338 fffff800`016d7732 nt!KeBugCheckEx

fffff880`01fe2340 fffff800`01754f27 nt!KiBugCheck3+0x12

fffff880`01fe2370 fffff880`0177e271 nt! ?? ::FNODOBFM::`string’+0×3f31b

fffff880`01fe23a0 fffff880`0177c138 DriverA!CallProvider+0×161

[…]

fffff880`01fe2cb0 fffff800`0197a7c6 nt!ExpWorkerThread+0×111

fffff880`01fe2d40 fffff800`016b5c26 nt!PspSystemThreadStartup+0×5a

fffff880`01fe2d80 00000000`00000000 nt!KxStartSystemThread+0×16
0: kd> !irp fffffa800500c9e0

Irp is active with 1 stacks 0 is current (= 0xfffffa8006c2e960)

 No Mdl: No System Buffer: Thread 00000000:  Irp stack trace.

     cmd  flg cl Device   File     Completion-Context

 [  4, 0]   0 e0 fffffa8004045c50 fffffa8006c2e960 fffff88005a04460-fffffa8005b9c370 Success Error Cancel

        \DriverA DriverB!CompleteRoutine

   Args: 00000008 00000000 00000000 00000000
0: kd> ub fffff880`0177e271

DriverA!CallProvider+0×13e:

fffff880`0177e24e mov     qword ptr [r11-10h],rax

fffff880`0177e252 mov     qword ptr [r11-8],r12

fffff880`0177e256 mov     byte ptr [r11-45h],0E0h

fffff880`0177e25b mov     rcx,qword ptr [rdi+40h]

fffff880`0177e25f call    qword ptr [DriverA!_imp_IoGetAttachedDevice (fffff880`017790b0)]

fffff880`0177e265 mov     rdx,rbp

fffff880`0177e268 mov     rcx,rax

fffff880`0177e26b call    qword ptr [DriverA!_imp_IofCallDriver (fffff880`01779068)]
- Dmitry Vostokov @ DumpAnalysis.org + TraceAnalysis.org -
Posted in Crash Dump Analysis, Crash Dump Patterns, Debugging, Kernel Development | No Comments »
Thursday, February 24th, 2011
Learning from Philip Marlowe, a detective:
“I like you,” she said suddenly. “You believe in miracles.”
Raymond Chandler, The Big Sleep
Do you believe in miracles from a driver modifying an arbitrary user space? Or in a miracle of suddenly disappearing software incidents?
- Dmitry Vostokov @ DumpAnalysis.org + TraceAnalysis.org -
Posted in Bugtations, Debugging, Escalation Engineering, Fun with Debugging, Kernel Development, Software Technical Support, The Way of Philip Marlowe | 1 Comment »
Thursday, November 25th, 2010
Posted in Announcements, Complete Memory Dump Analysis, Crash Analysis Report Environment (CARE), Crash Dump Analysis, Crash Dump De-analysis, Crash Dump Patterns, Debugging, Debugging Industry, Escalation Engineering, Kernel Development, Memory Analysis Forensics and Intelligence, Memory Dump Analysis Services, Minidump Analysis, Software Behavior Patterns, Software Engineering, Software Technical Support, Software Trace Analysis, Software Troubleshooting Patterns, Tools, Trace Analysis Patterns, Vista, Windows 7, Windows Server 2008, Windows System Administration, Workaround Patterns, x64 Windows | No Comments »
Friday, November 12th, 2010
Five volumes of cross-disciplinary Anthology (dubbed by the author “The Summa Memorianica”) lay the foundation of the scientific discipline of Memoretics (study of computer memory snapshots and their evolution in time) that is also called Memory Dump and Software Trace Analysis.ca
The 5th volume contains revised, edited, cross-referenced, and thematically organized selected DumpAnalysis.org blog posts about crash dump, software trace analysis and debugging written in February 2010 - October 2010 for software engineers developing and maintaining products on Windows platforms, quality assurance engineers testing software on Windows platforms, technical support and escalation engineers dealing with complex software issues, and security researchers, malware analysts and reverse engineers. The fifth volume features:
- 25 new crash dump analysis patterns
- 11 new pattern interaction case studies (including software tracing)
- 16 new trace analysis patterns
- 7 structural memory patterns
- 4 modeling case studies for memory dump analysis patterns
- Discussion of 3 common analysis mistakes
- Malware analysis case study
- Computer independent architecture of crash analysis report service
- Expanded coverage of software narratology
- Metaphysical and theological implications of memory dump worldview
- More pictures of memory space and physicalist art
- Classification of memory visualization tools
- Memory visualization case studies
- Close reading of the stories of Sherlock Holmes: Dr. Watson’s observational patterns
- Fully cross-referenced with Volume 1, Volume 2, Volume 3, and Volume 4
Product information:
- Title: Memory Dump Analysis Anthology, Volume 5
- Author: Dmitry Vostokov
- Language: English
- Product Dimensions: 22.86 x 15.24
- Paperback: 400 pages
- Publisher: Opentask (10 December 2010)
- ISBN-13: 978-1-906717-96-4
- Hardcover: 400 pages
- Publisher: Opentask (10 December 2010)
- ISBN-13: 978-1-906717-97-1

Back cover features memory space art image Hot Computation: Memory on Fire.
- Dmitry Vostokov @ DumpAnalysis.org + TraceAnalysis.org -
Posted in Aesthetics of Memory Dumps, Announcements, Archaeology of Computer Memory, Art, Assembly Language, Books, C and C++, CDF Analysis Tips and Tricks, Categorical Debugging, Common Mistakes, Complete Memory Dump Analysis, Computer Science, Crash Analysis Report Environment (CARE), Crash Dump Analysis, Crash Dump De-analysis, Crash Dump Patterns, Debugging, Debugging Methodology, Debugging Slang, Deep Down C++, Dr. Watson, Dublin School of Security, Education and Research, Escalation Engineering, Fun with Crash Dumps, Fun with Debugging, Fun with Software Traces, General Memory Analysis, Hermeneutics of Memory Dumps and Traces, Images of Computer Memory, Kernel Development, Malware Analysis, Malware Patterns, Mathematics of Debugging, Memiotics (Memory Semiotics), Memoidealism, Memoretics, Memory Analysis Culture, Memory Analysis Forensics and Intelligence, Memory Analysis Report System, Memory Diagrams, Memory Dreams, Memory Dump Analysis Jobs, Memory Dump Analysis Services, Memory Dump Analysis and History, Memory Dumps in Movies, Memory Dumps in Myths, Memory Religion (Memorianity), Memory Space Art, Memory Systems Language, Memory Visualization, Memory and Glitches, Memuonics, Metaphysical Society of Ireland, Minidump Analysis, Movies and Debugging, Multithreading, Museum of Debugging, Music for Debugging, Music of Computation, New Acronyms, New Words, Paleo-debugging, Pattern Models, Pattern Prediction, Philosophy, Physicalist Art, Psychoanalysis of Software Maintenance and Support, Publishing, Science of Memory Dump Analysis, Science of Software Tracing, Security, Software Architecture, Software Behavior Patterns, Software Chorography, Software Chorology, Software Defect Construction, Software Engineering, Software Generalist, Software Maintenance Institute, Software Narratology, Software Technical Support, Software Trace Analysis, Software Trace Analysis and History, Software Trace Deconstruction, Software Trace Reading, Software Trace Visualization, Software Tracing for Dummies, Software Troubleshooting Patterns, Software Victimology, Stack Trace Collection, Structural Memory Analysis and Social Sciences, Structural Memory Patterns, Structural Trace Patterns, Systems Thinking, Testing, Theology, Tool Objects, Tools, Trace Analysis Patterns, Training and Seminars, Troubleshooting Methodology, Uses of UML, Victimware, Virtualization, Vista, Visual Dump Analysis, Webinars, WinDbg Scripts, WinDbg Tips and Tricks, WinDbg for GDB Users, Windows 7, Windows Server 2008, Windows System Administration, Workaround Patterns, x64 Windows | No Comments »
Saturday, November 6th, 2010
I’m pleased to announce that MDAA, Volume 4 is available in PDF format:
www.dumpanalysis.org/Memory+Dump+Analysis+Anthology+Volume+4
It features:
- 15 new crash dump analysis patterns
- 13 new pattern interaction case studies
- 10 new trace analysis patterns
- 6 new Debugware patterns and case study
- Workaround patterns
- Updated checklist
- Fully cross-referenced with Volume 1, Volume 2 and Volume 3
- Memory visualization tutorials
- Memory space art
Its table of contents is available here:
http://www.dumpanalysis.org/MDAA/MDA-Anthology-V4-TOC.pdf
Paperback and hardcover versions should be available in a week or two. I also started working on Volume 5 that should be available in December.
- Dmitry Vostokov @ DumpAnalysis.org + TraceAnalysis.org -
Posted in .NET Debugging, Aesthetics of Memory Dumps, Announcements, AntiPatterns, Art, Assembly Language, Books, C and C++, CDF Analysis Tips and Tricks, Categorical Debugging, Common Mistakes, Complete Memory Dump Analysis, Computer Science, Countefactual Debugging, Crash Dump Analysis, Crash Dump Patterns, DebugWare Patterns, Debugging, Debugging Slang, Deep Down C++, Education and Research, Escalation Engineering, Fun with Crash Dumps, Fun with Debugging, Images of Computer Memory, Kernel Development, Memiotics (Memory Semiotics), Memoidealism, Memoretics, Memory Space Art, Memory Visualization, Memuonics, Metaphysics of Memory Worldview, Multithreading, Opcodism, Philosophy, Physicalist Art, Publishing, Science Fiction, Science of Memory Dump Analysis, Science of Software Tracing, Security, Software Architecture, Software Behavior Patterns, Software Defect Construction, Software Engineering, Software Narratology, Software Technical Support, Software Trace Analysis, Software Trace Reading, Software Victimology, Stack Trace Collection, Testing, Tools, Trace Analysis Patterns, Troubleshooting Methodology, Uses of UML, Victimware, Virtualization, Vista, Visual Dump Analysis, WinDbg Scripts, WinDbg Tips and Tricks, Windows 7, Windows Server 2008, Windows System Administration, Workaround Patterns, x64 Windows | No Comments »
Saturday, October 30th, 2010
If you develop and debug user space applications (and/or doing crash dump analysis in user space) or specialize in user space security and you want to understand Windows kernel dumps and device drivers better (and probably start writing your own kernel tools) or understand malware rootkits better here is the reading list I found the most effective over the last 7 years:
0.0. Read and re-read Windows Internals book in parallel while reading all other books. I read all editions by the way. It will show you the big picture and useful WinDbg commands and techniques but you need to read device driver books to fill the gaps and be confident in kernel space:


0.1. Start with The Windows 2000 Device Driver Book: A Guide for Programmers . This short book will show you the basics and you can start writing your drivers and kernel tools immediately.


0.2. Next read Windows NT Device Driver Development book to consolidate your knowledge. This book has been reprinted by OSR (I own the original New Riders Press edition):


0.3. Don’t stop here. Read Developing Windows NT Device Drivers: A Programmer’s Handbook . This is the very good book explaining everything in great detail and good pictures. You will finally understand various buffering methods.


0.4. Continue with WDM drivers and modern presentation: Programming the Microsoft Windows Driver Model . Must read even if your drivers are not WDM.


0.5. Finally read Developing Drivers with the Windows Driver Foundation book. It also covers ETW (event tracing for Windows), WinDbg extensions, PREfast and static driver verifier.


0.6. There is a forthcoming book Windows 7 Device Driver at the time of this writing that also covers WDF so you might want to start with #0.6 and continue with #0.5 as a reference:


Additional reading (not including DDK Help which you will use anyway) can be done in parallel after finishing “Windows NT Device Driver Development” book:
1.1. OSR NT Insider articles. I have their full printed collection 1996 - 2006 plus all the latest issues (looks like print editions are discontinued and the new ones are only digital):
http://www.osronline.com/
1.2. Windows NT File System Internals reprinted by OSR (I have the original O’Reilly edition):


1.3. Windows NT/2000 Native API Reference is fun to browse occasionally and indispensable if you don’t have access to Windows source code:


1.4. Rootkits: Subverting the Windows Kernel book will show you Windows kernel from the hacker perspective. In addition you will find the overview of kernel areas not covered in other books.


1.5. The Rootkit Arsenal: Escape and Evasion in the Dark Corners of the System is another excellent book that is up to date and explains kernel staff from ab initio. I’m reading it at the time of this writing and recommend it to read first or in parallel to all other books:


Of course, you must know C language and its idioms really well. Really know it down to assembly language level! I’ll publish other reading lists soon including reverse engineering classics. Stay tuned.
- Dmitry Vostokov @ DumpAnalysis.org + TraceAnalysis.org -
Posted in Books, Crash Dump Analysis, Debugging, Kernel Development, Malware Analysis, Memory Analysis Forensics and Intelligence, Security, Software Architecture | 1 Comment »
Monday, October 4th, 2010
Don’t name your driver a “Missile” blog post dealt with funny names seen in crash dumps. However, even innocuous driver names may occasionally provoke a laughter from people in the know. For example, SGUB32.SYS can be read 23BUGS in reverse. My recent encounter is a print driver SGNUD64.dll where we read 46DUNGS in reverse. Don’t rush to Google the name to find ISV, it was modified to avoid an engineering embarrassment, although a dung was really there 
- Dmitry Vostokov @ DumpAnalysis.org + TraceAnalysis.org -
Posted in Crash Dump Analysis, Fun with Crash Dumps, Kernel Development | No Comments »
Thursday, August 19th, 2010
Addison-Wesley is publishing early next year this book:
Windows 7 Device Driver (Addison-Wesley Microsoft Technology Series)


From TOC on the publisher website it looks like it mainly covers WDF: KMDF + UMDF.
- Dmitry Vostokov @ DumpAnalysis.org + TraceAnalysis.org -
Posted in Books, Kernel Development, Windows 7 | 2 Comments »
