Archive for the ‘Categorical Debugging’ Category
Sunday, June 14th, 2020
When interpreting a value as a pointer to a memory address we are usually interested in adjacent values pointed to:

0:000> ? rdx

Evaluate expression: 982485297288 = 000000e4`c0afe888
0:000> ? poi(000000e4`c0afe888)

Evaluate expression: 180 = 00000000`000000b4
0:000> ? poi(rdx)

Evaluate expression: 180 = 00000000`000000b4
0:000> dps rdx-10 rdx+10

000000e4`c0afe878  000000e4`c0afeac0

000000e4`c0afe880  000000e4`c0971000

000000e4`c0afe888  00000000`000000b4

000000e4`c0afe890  00000000`0000008c

000000e4`c0afe898  00000000`00000088
0:000> r $t0 = 0
0:000> dps rdx-@$t0 rdx+@$t0

000000e4`c0afe888  00000000`000000b4
0:000> r $t0 = 20
0:000> dps rdx-@$t0 rdx+@$t0

000000e4`c0afe868  00000000`00000001

000000e4`c0afe870  00001a38`00000001

000000e4`c0afe878  000000e4`c0afeac0

000000e4`c0afe880  000000e4`c0971000

000000e4`c0afe888  00000000`000000b4

000000e4`c0afe890  00000000`0000008c

000000e4`c0afe898  00000000`00000088

000000e4`c0afe8a0  00000000`00000088

000000e4`c0afe8a8  00000000`0000008c
We call this analysis pattern Pointer Cone by analogy with cones in category theory and our earlier attempts to use it. The reason for this pattern appearance is that it has been used in many times in other analysis pattern descriptions. We also intend to use this pattern language building block in our next analysis pattern.
- Dmitry Vostokov @ DumpAnalysis.org + TraceAnalysis.org -
Posted in Categorical Debugging, Crash Dump Analysis, Crash Dump Patterns, Mathematics of Debugging, x64 Windows | No Comments »
Wednesday, September 21st, 2011
Memoretics as a science of memory snapshots borrows many ideas from the following disciplines (the list is not exhaustive):
- Troubleshooting and Debugging
- Intelligence Analysis
- Critical Thinking
- Forensics
- Linguistics
- Archaeology
- Psychoanalysis
- History
- Mathematics: Sets and Categories
- Literary Criticism and Narratology
It also contributes many ideas back. The following diagram depicts such an interaction:

- Dmitry Vostokov @ DumpAnalysis.org + TraceAnalysis.org -
Posted in Archaeology of Computer Memory, Categorical Debugging, Computer Forensics, Computer Science, Countefactual Debugging, Crash Dump Analysis, Crash Dump De-analysis, Crash Dump Patterns, Debugging, Debugging Methodology, Dublin School of Security, Education and Research, Escalation Engineering, General Memory Analysis, Generative Debugging, Hermeneutics of Memory Dumps and Traces, History, Intelligence Analysis Patterns, M->analysis, Malware Analysis, Malware Patterns, Mathematics of Debugging, Memiotics (Memory Semiotics), Memoretics, Memory Analysis Forensics and Intelligence, Memory Dump Analysis and History, Memory Systems Language, Memory Visualization, Metadefect Template Library, Metamalware, New Debugging School, Paleo-debugging, Pattern Models, Pattern Prediction, Psychoanalysis of Software Maintenance and Support, Psychology, Reverse Engineering, Root Cause Analysis, Science of Memory Dump Analysis, Science of Software Tracing, Security, Software Architecture, Software Behavior DNA, Software Behavior Patterns, Software Behavioral Genome, Software Chorography, Software Chorology, Software Defect Construction, Software Engineering, Software Narratology, Software Technical Support, Software Trace Analysis, Software Trace Analysis and History, Software Trace Deconstruction, Software Trace Linguistics, Software Trace Reading, Software Trace Visualization, Software Tracing Implementation Patterns, Software Troubleshooting Patterns, Software Victimology, Software and History, Structural Memory Analysis and Social Sciences, Structural Memory Patterns, Structural Trace Patterns, Systems Thinking, Testing, Tools, Trace Analysis Patterns, Troubleshooting Methodology, UI Problem Analysis Patterns, Unified Debugging Patterns, Victimware, Virtualization, Visual Dump Analysis, Workaround Patterns | No Comments »
Sunday, April 17th, 2011
I’m pleased to announce that MDAA, Volume 5 is available in PDF format:
www.dumpanalysis.org/Memory+Dump+Analysis+Anthology+Volume+5
It features:
- 25 new crash dump analysis patterns
- 11 new pattern interaction case studies (including software tracing)
- 16 new trace analysis patterns
- 7 structural memory patterns
- 4 modeling case studies for memory dump analysis patterns
- Discussion of 3 common analysis mistakes
- Malware analysis case study
- Computer independent architecture of crash analysis report service
- Expanded coverage of software narratology
- Metaphysical and theological implications of memory dump worldview
- More pictures of memory space and physicalist art
- Classification of memory visualization tools
- Memory visualization case studies
- Close reading of the stories of Sherlock Holmes: Dr. Watson’s observational patterns
- Fully cross-referenced with Volume 1, Volume 2, Volume 3, and Volume 4
Its table of contents is available here:
www.dumpanalysis.org/MDAA/MDA-Anthology-V5-TOC.pdf
Paperback and hardcover versions should be available in a week or two. I also started working on Volume 6 that should be available in November-December.
- Dmitry Vostokov @ DumpAnalysis.org + TraceAnalysis.org -
Posted in Aesthetics of Memory Dumps, Analysis Notation, Announcements, AntiPatterns, Archaeology of Computer Memory, Art, Assembly Language, Best Practices, Books, C and C++, CDF Analysis Tips and Tricks, Categorical Debugging, Citrix, Common Mistakes, Common Questions, Complete Memory Dump Analysis, Computer Forensics, Computer Science, Crash Analysis Report Environment (CARE), Crash Dump Analysis, Crash Dump De-analysis, Crash Dump Patterns, Crash Dumps for Dummies, Cyber Warfare, Debugging, Debugging Bureau, Debugging Industry, Debugging Methodology, Debugging Slang, Debugging Trends, Deep Down C++, Dr. Watson, Dublin School of Security, Education and Research, Escalation Engineering, Fun with Crash Dumps, Fun with Debugging, Fun with Software Traces, General Memory Analysis, Hermeneutics of Memory Dumps and Traces, Images of Computer Memory, Kernel Development, Malware Analysis, Mathematics of Debugging, Memiotics (Memory Semiotics), Memory Analysis Forensics and Intelligence, Memory Diagrams, Memory Dump Analysis Services, Memory Dumps in Myths, Memory Space Art, Memory Systems Language, Memory Visualization, Memory and Glitches, Metaphysics of Memory Worldview, Multithreading, Music for Debugging, New Acronyms, New Debugging School, New Words, Pattern Models, Philosophy, Physicalist Art, Publishing, Reverse Engineering, Science of Memory Dump Analysis, Science of Software Tracing, Security, Software Architecture, Software Behavior Patterns, Software Chorography, Software Chorology, Software Defect Construction, Software Engineering, Software Generalist, Software Maintenance Institute, Software Narratology, Software Technical Support, Software Trace Analysis, Software Trace Reading, Software Trace Visualization, Software Tracing for Dummies, Software Troubleshooting Patterns, Software Victimology, Structural Memory Patterns, Structural Trace Patterns, Systems Thinking, Testing, The Way of Philip Marlowe, Tools, Trace Analysis Patterns, Training and Seminars, Troubleshooting Methodology, Victimware, Vista, Webinars, WinDbg Scripting Extensions, WinDbg Scripts, WinDbg Tips and Tricks, WinDbg for GDB Users, Windows 7, Windows Server 2008, Windows System Administration, Workaround Patterns, x64 Windows | No Comments »
Friday, November 12th, 2010
Five volumes of cross-disciplinary Anthology (dubbed by the author “The Summa Memorianica”) lay the foundation of the scientific discipline of Memoretics (study of computer memory snapshots and their evolution in time) that is also called Memory Dump and Software Trace Analysis.ca
The 5th volume contains revised, edited, cross-referenced, and thematically organized selected DumpAnalysis.org blog posts about crash dump, software trace analysis and debugging written in February 2010 - October 2010 for software engineers developing and maintaining products on Windows platforms, quality assurance engineers testing software on Windows platforms, technical support and escalation engineers dealing with complex software issues, and security researchers, malware analysts and reverse engineers. The fifth volume features:
- 25 new crash dump analysis patterns
- 11 new pattern interaction case studies (including software tracing)
- 16 new trace analysis patterns
- 7 structural memory patterns
- 4 modeling case studies for memory dump analysis patterns
- Discussion of 3 common analysis mistakes
- Malware analysis case study
- Computer independent architecture of crash analysis report service
- Expanded coverage of software narratology
- Metaphysical and theological implications of memory dump worldview
- More pictures of memory space and physicalist art
- Classification of memory visualization tools
- Memory visualization case studies
- Close reading of the stories of Sherlock Holmes: Dr. Watson’s observational patterns
- Fully cross-referenced with Volume 1, Volume 2, Volume 3, and Volume 4
Product information:
- Title: Memory Dump Analysis Anthology, Volume 5
- Author: Dmitry Vostokov
- Language: English
- Product Dimensions: 22.86 x 15.24
- Paperback: 400 pages
- Publisher: Opentask (10 December 2010)
- ISBN-13: 978-1-906717-96-4
- Hardcover: 400 pages
- Publisher: Opentask (10 December 2010)
- ISBN-13: 978-1-906717-97-1

Back cover features memory space art image Hot Computation: Memory on Fire.
- Dmitry Vostokov @ DumpAnalysis.org + TraceAnalysis.org -
Posted in Aesthetics of Memory Dumps, Announcements, Archaeology of Computer Memory, Art, Assembly Language, Books, C and C++, CDF Analysis Tips and Tricks, Categorical Debugging, Common Mistakes, Complete Memory Dump Analysis, Computer Science, Crash Analysis Report Environment (CARE), Crash Dump Analysis, Crash Dump De-analysis, Crash Dump Patterns, Debugging, Debugging Methodology, Debugging Slang, Deep Down C++, Dr. Watson, Dublin School of Security, Education and Research, Escalation Engineering, Fun with Crash Dumps, Fun with Debugging, Fun with Software Traces, General Memory Analysis, Hermeneutics of Memory Dumps and Traces, Images of Computer Memory, Kernel Development, Malware Analysis, Malware Patterns, Mathematics of Debugging, Memiotics (Memory Semiotics), Memoidealism, Memoretics, Memory Analysis Culture, Memory Analysis Forensics and Intelligence, Memory Analysis Report System, Memory Diagrams, Memory Dreams, Memory Dump Analysis Jobs, Memory Dump Analysis Services, Memory Dump Analysis and History, Memory Dumps in Movies, Memory Dumps in Myths, Memory Religion (Memorianity), Memory Space Art, Memory Systems Language, Memory Visualization, Memory and Glitches, Memuonics, Metaphysical Society of Ireland, Minidump Analysis, Movies and Debugging, Multithreading, Museum of Debugging, Music for Debugging, Music of Computation, New Acronyms, New Words, Paleo-debugging, Pattern Models, Pattern Prediction, Philosophy, Physicalist Art, Psychoanalysis of Software Maintenance and Support, Publishing, Science of Memory Dump Analysis, Science of Software Tracing, Security, Software Architecture, Software Behavior Patterns, Software Chorography, Software Chorology, Software Defect Construction, Software Engineering, Software Generalist, Software Maintenance Institute, Software Narratology, Software Technical Support, Software Trace Analysis, Software Trace Analysis and History, Software Trace Deconstruction, Software Trace Reading, Software Trace Visualization, Software Tracing for Dummies, Software Troubleshooting Patterns, Software Victimology, Stack Trace Collection, Structural Memory Analysis and Social Sciences, Structural Memory Patterns, Structural Trace Patterns, Systems Thinking, Testing, Theology, Tool Objects, Tools, Trace Analysis Patterns, Training and Seminars, Troubleshooting Methodology, Uses of UML, Victimware, Virtualization, Vista, Visual Dump Analysis, Webinars, WinDbg Scripts, WinDbg Tips and Tricks, WinDbg for GDB Users, Windows 7, Windows Server 2008, Windows System Administration, Workaround Patterns, x64 Windows | No Comments »
Saturday, November 6th, 2010
I’m pleased to announce that MDAA, Volume 4 is available in PDF format:
www.dumpanalysis.org/Memory+Dump+Analysis+Anthology+Volume+4
It features:
- 15 new crash dump analysis patterns
- 13 new pattern interaction case studies
- 10 new trace analysis patterns
- 6 new Debugware patterns and case study
- Workaround patterns
- Updated checklist
- Fully cross-referenced with Volume 1, Volume 2 and Volume 3
- Memory visualization tutorials
- Memory space art
Its table of contents is available here:
http://www.dumpanalysis.org/MDAA/MDA-Anthology-V4-TOC.pdf
Paperback and hardcover versions should be available in a week or two. I also started working on Volume 5 that should be available in December.
- Dmitry Vostokov @ DumpAnalysis.org + TraceAnalysis.org -
Posted in .NET Debugging, Aesthetics of Memory Dumps, Announcements, AntiPatterns, Art, Assembly Language, Books, C and C++, CDF Analysis Tips and Tricks, Categorical Debugging, Common Mistakes, Complete Memory Dump Analysis, Computer Science, Countefactual Debugging, Crash Dump Analysis, Crash Dump Patterns, DebugWare Patterns, Debugging, Debugging Slang, Deep Down C++, Education and Research, Escalation Engineering, Fun with Crash Dumps, Fun with Debugging, Images of Computer Memory, Kernel Development, Memiotics (Memory Semiotics), Memoidealism, Memoretics, Memory Space Art, Memory Visualization, Memuonics, Metaphysics of Memory Worldview, Multithreading, Opcodism, Philosophy, Physicalist Art, Publishing, Science Fiction, Science of Memory Dump Analysis, Science of Software Tracing, Security, Software Architecture, Software Behavior Patterns, Software Defect Construction, Software Engineering, Software Narratology, Software Technical Support, Software Trace Analysis, Software Trace Reading, Software Victimology, Stack Trace Collection, Testing, Tools, Trace Analysis Patterns, Troubleshooting Methodology, Uses of UML, Victimware, Virtualization, Vista, Visual Dump Analysis, WinDbg Scripts, WinDbg Tips and Tricks, Windows 7, Windows Server 2008, Windows System Administration, Workaround Patterns, x64 Windows | No Comments »
Monday, October 11th, 2010
Tool Objects name was motivated by the title of the book Tool and Object: A History and Philosophy of Category Theory that I’m reading:

I realized that troubleshooting can be represented as a category of memory states (or collections of proximate states) as objects and troubleshooting tools as arrows.
We can also consider tools as categories with arrows as troubleshooting actions. In the latter case we can model a collection of tools and transformations (morphisms) between them as a functor.
- Dmitry Vostokov @ DumpAnalysis.org + TraceAnalysis.org -
Posted in Books, Categorical Debugging, History, Mathematics of Debugging, Tool Objects, Tools | No Comments »
Thursday, September 23rd, 2010
When I was a child I experienced dreams where I was carried by a huge wave that was transforming to a torus completely absorbing me up to a breakpoint of my wake up. A year ago I got the book Memory Evolutive Systems because of my interest in applying category theory to memory analysis and debugging and immediately recalled my long-time forgotten childhood dreams while staring at its front cover:

- Dmitry Vostokov @ DumpAnalysis.org + TraceAnalysis.org -
Posted in Books, Categorical Debugging, History, Mathematics, Memoretics, Memory Dreams, Memory Visualization, Science of Memory Dump Analysis | No Comments »
Sunday, April 18th, 2010
OpenTask to offer first 3 volumes of Memory Dump Analysis Anthology in one set:


The set is available exclusively from OpenTask e-Commerce web site starting from June. Individual volumes are also available from Amazon, Barnes & Noble and other bookstores worldwide.
Product information:
- Title: Modern Memory Dump and Software Trace Analysis: Volumes 1-3
- Author: Dmitry Vostokov
- Language: English
- Product Dimensions: 22.86 x 15.24
- Paperback: 1600 pages
- Publisher: Opentask (31 May 2010)
- ISBN-13: 978-1-906717-99-5
Information about individual volumes:
- Dmitry Vostokov @ DumpAnalysis.org + TraceAnalysis.org -
Posted in .NET Debugging, Aesthetics of Memory Dumps, Announcements, AntiPatterns, Art, Assembly Language, Books, Bugchecks Depicted, C and C++, CDA Pattern Classification, CDF Analysis Tips and Tricks, Categorical Debugging, Certification, Citrix, Code Reading, Common Mistakes, Computational Ghosts and Bug Hauntings, Computer Science, Countefactual Debugging, Crash Analysis Report Environment (CARE), Crash Dump Analysis, Crash Dump Patterns, Crash Dumps for Dummies, Data Recovery, DebugWare Patterns, Debugging, Debugging Methodology, Debugging Slang, Deep Down C++, Dictionary of Debugging, Dr. Watson, Education and Research, Escalation Engineering, Fun with Crash Dumps, Futuristic Memory Dump Analysis, GDB for WinDbg Users, Hardware, History, Horrors of Computation, Hyper-V, Intelligent Memory Movement, Kernel Development, Laws of Troubleshooting and Debugging, Mathematics of Debugging, Memiotics (Memory Semiotics), Memoidealism, Memoretics, Memory Analysis Culture, Memory Analysis Forensics and Intelligence, Memory Auralization, Memory Dump Analysis Jobs, Memory Religion (Memorianity), Memory Space Art, Memory Space Music, Memory Systems Language, Memory Visualization, Memuonics, Minidump Analysis, Multithreading, Music for Debugging, Music of Computation, New Acronyms, New Words, Occult Debugging, Philosophy, Psi-computation, Publishing, Science of Memory Dump Analysis, Science of Software Tracing, Security, Software Architecture, Software Defect Construction, Software Engineering, Software Generalist, Software Maintenance Institute, Software Narratology, Software Technical Support, Software Trace Analysis, Software Trace Visualization, Software Tracing for Dummies, Software Victimology, Stack Trace Collection, Testing, Tools, Trace Analysis Patterns, Training and Seminars, Troubleshooting Methodology, Victimware, Virtualization, Vista, Visual Dump Analysis, WinDbg Scripts, WinDbg Tips and Tricks, WinDbg for GDB Users, Windows 7, Windows Server 2008, Windows System Administration | No Comments »
Monday, March 22nd, 2010
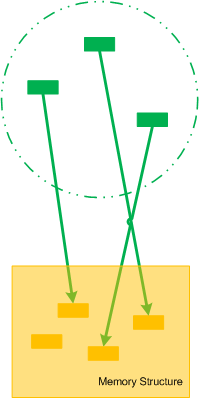
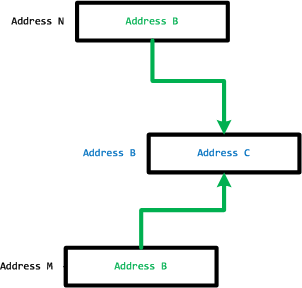
Let’s now introduce collective pointers or pointer cones. Suppose we have a set of pointers pointing to fields of some memory structure. This set of pointers could be another structure as well or just a collection of pointers that can be logically brought together:
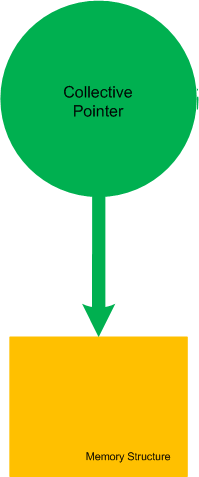
If we make the boundary opaque we can name such set of pointers as Collective Pointer (or Pointer Cone):
Another example is when we split the perception field of a pointer into disjoint collective pointers (the perception field as a whole is already a trivial collective pointer):

- Dmitry Vostokov @ DumpAnalysis.org + TraceAnalysis.org -
Posted in Categorical Debugging, Mathematics of Debugging, Memoretics, Science of Memory Dump Analysis | No Comments »
Thursday, February 11th, 2010
This is a revised, edited, cross-referenced and thematically organized volume of selected DumpAnalysis.org blog posts about crash dump analysis and debugging written in July 2009 - January 2010 for software engineers developing and maintaining products on Windows platforms, quality assurance engineers testing software on Windows platforms and technical support and escalation engineers dealing with complex software issues. The fourth volume features:
- 13 new crash dump analysis patterns
- 13 new pattern interaction case studies
- 10 new trace analysis patterns
- 6 new Debugware patterns and case study
- Workaround patterns
- Updated checklist
- Fully cross-referenced with Volume 1, Volume 2 and Volume 3
- New appendixes
Product information:
- Title: Memory Dump Analysis Anthology, Volume 4
- Author: Dmitry Vostokov
- Language: English
- Product Dimensions: 22.86 x 15.24
- Paperback: 410 pages
- Publisher: Opentask (30 March 2010)
- ISBN-13: 978-1-906717-86-5
- Hardcover: 410 pages
- Publisher: Opentask (30 April 2010)
- ISBN-13: 978-1-906717-87-2

Back cover features memory space art image: Internal Process Combustion.
- Dmitry Vostokov @ DumpAnalysis.org + TraceAnalysis.org -
Posted in .NET Debugging, Aesthetics of Memory Dumps, Announcements, AntiPatterns, Art, Assembly Language, Books, C and C++, CDA Pattern Classification, CDF Analysis Tips and Tricks, Categorical Debugging, Certification, Citrix, Code Reading, Common Mistakes, Computer Science, Countefactual Debugging, Crash Analysis Report Environment (CARE), Crash Dump Analysis, Crash Dump Patterns, Crash Dumps for Dummies, DebugWare Patterns, Debugging, Debugging Slang, Education and Research, Escalation Engineering, Fun with Crash Dumps, Games for Debugging, Hardware, Horrors of Computation, Hyper-V, Kernel Development, Laws of Troubleshooting and Debugging, Mathematics of Debugging, Memiotics (Memory Semiotics), Memoidealism, Memoretics, Memory Analysis Culture, Memory Analysis Forensics and Intelligence, Memory Dreams, Memory Dump Analysis Jobs, Memory Dumps in Movies, Memory Space Art, Memory Visualization, Memuonics, Minidump Analysis, Multithreading, Music for Debugging, New Acronyms, New Words, Opcodism, Philosophy, Physicalist Art, Publishing, Science Fiction, Science of Memory Dump Analysis, Science of Software Tracing, Security, Software Architecture, Software Defect Construction, Software Engineering, Software Generalist, Software Maintenance Institute, Software Narratology, Software Technical Support, Software Trace Analysis, Software Trace Visualization, Software Tracing for Dummies, Software Victimology, Stack Trace Collection, Testing, Tools, Trace Analysis Patterns, Training and Seminars, Troubleshooting Methodology, Victimware, Virtualization, Vista, Visual Dump Analysis, WinDbg Scripts, WinDbg Tips and Tricks, WinDbg for GDB Users, Windows 7, Windows Server 2008, Windows System Administration, Workaround Patterns | No Comments »
Tuesday, January 26th, 2010
In part 1 we defined MemP category and the operating field of a pointer as its link to a memory location it is pointing to. This operating field value can be in a different pseudo-memory plane if its value is outside memory bounds, for example, 8FFFFFF0 for a memory with the highest possible address 7FFFFFFF:

We define the closure of memory as the smallest MemP category that includes memory for operating fields of every pointer for the current memory snapshot. For example above, by adding another memory location that has a pointer value pointing back to the original memory region we have the following operating closure:

We can also add more memory as well:

- Dmitry Vostokov @ DumpAnalysis.org + TraceAnalysis.org -
Posted in Categorical Debugging, Mathematics of Debugging, Memoretics, Science of Memory Dump Analysis | No Comments »
Friday, January 8th, 2010
I started applying category theory (as an alternative to traditional set-theoretic approach of memory bits) to memory dump analysis, debugging and software trace analysis in parallel to my studies of that branch of mathematics and reading the book Memory Evolutive Systems. In addition to complex systems modelled in the latter book I apply evolutive systems approach to computer memory. Here is a picture illustrating MemD category of memory dumps (snapshots) as category objects and category arrows as different ways in arriving at the same memory picture:
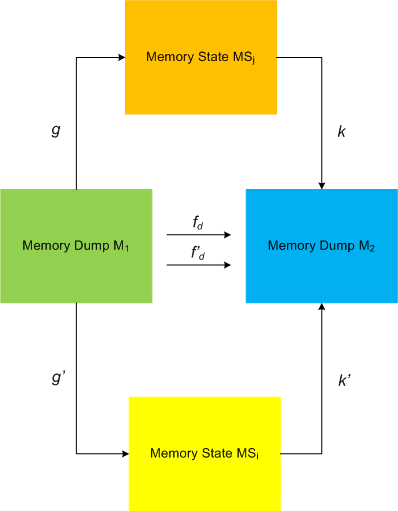
This category definitely applies to software traces as well if we consider every individual trace message or statement as a minidump. We currently consider software trace category MemT as a subcategory of MemD.
Configuration category of a computer memory dump represents its memory internals at an instant t (ideal memory dumps) or at a time interval T: components and links, pointers, wait chains, causal relations, data flows, … .
Pointers and their links are also objects and arrows to form a category, called MemP(tr). The following picture illustrates it with the last pointer shown as a dereference fixpoint:
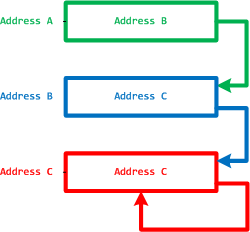
The perception field of a pointer is a category of all links to its memory location:
However, the operating field of a pointer is its link to a memory location it is pointing to.
- Dmitry Vostokov @ DumpAnalysis.org -
Posted in Categorical Debugging, Mathematics of Debugging, Memoretics, Memory Visualization, Philosophy, Science of Memory Dump Analysis, Science of Software Tracing | 3 Comments »