Archive for the ‘Software Engineering’ Category
Saturday, November 29th, 2014
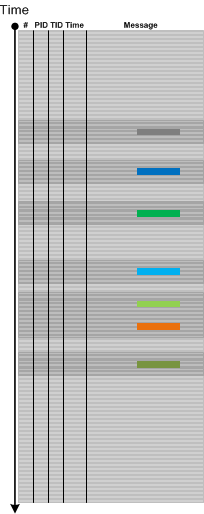
Some traces and logs may have Periodic Message Blocks with very similar message structure and content (mostly Message Invariants). The only significant difference between them is some unique data. We call such pattern Visitor Trace by analogy with Visitor design pattern where tracing code “visits” each object data or data part to log its content or status.
- Dmitry Vostokov @ DumpAnalysis.org + TraceAnalysis.org -
Posted in Log Analysis, Software Engineering, Software Trace Analysis, Software Trace Reading, Trace Analysis Patterns, Tracing and Design Patterns | No Comments »
Wednesday, November 19th, 2014
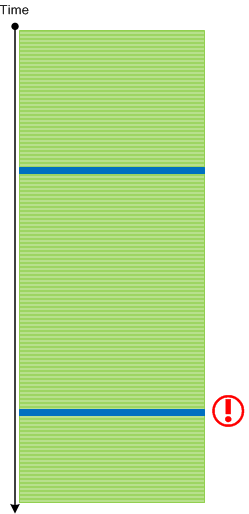
There are events that by design or system configuration should be seen in a log only once or not seen at all if code responsible for them was executed before tracing session. For example, the launch of certain services during system initialization shouldn’t be seen again when we trace system activity long after that. It can also be just messages from singleton objects in the application log. The appearance of extra Singleton Events may point to design violations or some abnormal system events such as process restart. The latter may Intra-Correlate with the start of the fault handling process such as WerFault.exe in Windows Process Monitor logs (Guest Component).
- Dmitry Vostokov @ DumpAnalysis.org + TraceAnalysis.org -
Posted in Log Analysis, Software Engineering, Software Trace Analysis, Software Trace Analysis Tips and Tricks, Software Trace Reading, Trace Analysis Patterns, Tracing and Design Patterns | No Comments »
Saturday, June 21st, 2014
The pattern called Small Value deals with easily recognizable values such as handles, timeouts, mouse pointer coordinates, enumeration values, window messages, etc. There is another kind of values we call Design Values, for example, 256 (+/- 1) or some other round value. Here we can also add some regular patterns in hex representation such as window handles or flags, for example, such as 0×10008000. Such designed values may fall into some module range too, the so called Coincidental Symbolic Information pattern. If we see a design value in the output of WinDbg commands especially related to abnormal behaviour patterns, not necessarily as a stack trace parameter, which can be False, then it might point to some design limitations that were reached. For example, Blocked ALPC Queue may have a limitation on I/O Completion Port when we have ALPC Wait Chains in an unresponsive system:
0: kd> !alpc /p <port_address>

[...]

512 thread(s) are registered with port IO completion object:

[…]
- Dmitry Vostokov @ DumpAnalysis.org + TraceAnalysis.org -
Posted in Crash Dump Analysis, Crash Dump Patterns, Software Engineering | No Comments »
Monday, May 5th, 2014
So far we have been discussing trace analysis patterns related to execution of a particular software version. However, software code changes and also its tracing and logging output: from large scale changes where components are replaced to small scale code refactoring affecting message structure and format. On a software narratological level this corresponds to a narrative about a software trace or log, it evolution. Such Meta Trace analysis pattern is different from Master Trace pattern where the latter is similar to what Metanarrative is usually meant in narratology: a master or grand idea - an expected trace if all functional requirements were correctly identified and implemented during software construction and non-functional ones are met during software execution.
- Dmitry Vostokov @ DumpAnalysis.org + TraceAnalysis.org -
Posted in Code Reading, Debugging, Log Analysis, Software Engineering, Software Narrative Science, Software Narratology, Software Technical Support, Software Trace Analysis, Software Trace Analysis and History, Software Trace Deconstruction, Software Trace Diagramming, Software Trace Reading, Software Trace Visualization, Trace Analysis Patterns | No Comments »
Friday, January 4th, 2013
Before deciding on whether to retrospect on 2012 we found that since March 14, 2008 this site has had more than 1 million visitors with more than 33% returning. So instead of just 2012 we decided to retrospect on that interval up to December 31, 2012. Google Analytics has improved since last January, 2012 and now made our task easier. So we start with the first one hundred sites referring to us:
| Source / Medium |
Visits
|
| google |
698156
|
| (direct) |
164142
|
| bing |
27923
|
| google.com |
17868
|
| windbg.org |
12994
|
| yahoo |
8682
|
| stackoverflow.com |
7194
|
| yandex |
5985
|
| windbg.dumpanalysis.org |
5375
|
| dumpanalysis.com |
5369
|
| live |
5310
|
| google.co.in |
4598
|
| blogs.msdn.com |
4385
|
| baike.baidu.com |
3475
|
| twitter.com |
2972
|
| facebook.com |
2733
|
| dumpanalysis.org |
2708
|
| images.google.com |
2314
|
| t.co |
2095
|
| baidu |
1916
|
| winvistaclub.com |
1862
|
| google.co.uk |
1449
|
| advancedwindowsdebugging.com |
1427
|
| jasonhaley.com |
1370
|
| search |
1328
|
| rsdn.ru |
1294
|
| en.wikipedia.org |
1276
|
| msn |
1256
|
| nynaeve.net |
1256
|
| blog.codeimproved.net |
1213
|
| google.de |
1074
|
| google.ca |
979
|
| reddit.com |
951
|
| bytetalk.net |
908
|
| citrixblogger.org |
819
|
| stumbleupon.com |
819
|
| linkedin.com |
780
|
| social.technet.microsoft.com |
774
|
| analyze-v.com |
757
|
| naver |
750
|
| forum.sysinternals.com |
735
|
| google.ru |
710
|
| blogs.microsoft.co.il |
693
|
| kumo.com |
678
|
| google.co.kr |
658
|
| google.com.au |
654
|
| blog.naver.com |
646
|
| reconstructer.org |
645
|
| community.citrix.com |
632
|
| blog.not-a-kernel-guy.com |
604
|
| itdatabase.com |
601
|
| advanceddotnetdebugging.com |
581
|
| serverfault.com |
564
|
| voneinem-windbg.blogspot.com |
561
|
| support.citrix.com |
555
|
| debuggingexperts.com |
549
|
| blog.miniasp.com |
527
|
| google.fr |
495
|
| caloni.com.br |
488
|
| google.com.br |
479
|
| ask |
459
|
| msuiche.net |
439
|
| insidewindows.kr |
432
|
| google.es |
430
|
| gynvael.coldwind.pl |
430
|
| blog.flexilis.com |
429
|
| aol |
418
|
| netfxharmonics.com |
416
|
| advdbg.org |
413
|
| images.google.co.uk |
401
|
| google.it |
391
|
| images.google.co.in |
391
|
| google.nl |
354
|
| serious-code.net |
340
|
| admin.itdatabase.com |
337
|
| blogs.technet.com |
334
|
| brianmadden.com |
327
|
| google.pl |
319
|
| google.com.ua |
318
|
| experts-exchange.com |
316
|
| delicious.com |
312
|
| images.google.de |
305
|
| opentask.com |
301
|
| codemachine.com |
296
|
| driveronline.org |
287
|
| google.com.tw |
282
|
| wasm.ru |
275
|
| debuglab.com |
265
|
| isisaka.com |
262
|
| literatescientist.com |
261
|
| blog.zoller.lu |
258
|
| shellexecute.wordpress.com |
257
|
| google.com.hk |
256
|
| managementbits.com |
253
|
| d.hatena.ne.jp |
251
|
| bloglines.com |
249
|
| google.com.tr |
248
|
| clausbrod.de |
246
|
| bing.com |
243
|
Next table is distribution of visits among countries:
| Country / Territory |
Visits
|
| United States |
342291
|
| India |
89303
|
| United Kingdom |
76131
|
| Russia |
46472
|
| Germany |
44472
|
| China |
40155
|
| Canada |
34781
|
| Japan |
24985
|
| France |
24084
|
| South Korea |
21056
|
| Australia |
20606
|
| Taiwan |
17949
|
| Netherlands |
15607
|
| Ireland |
15579
|
| Israel |
13514
|
| Ukraine |
13449
|
| Italy |
12542
|
| Brazil |
11834
|
| Spain |
11786
|
| Singapore |
11703
|
| Sweden |
11201
|
| Poland |
10340
|
| Romania |
9423
|
| (not set) |
8909
|
| Czech Republic |
8355
|
| Belgium |
6731
|
| Switzerland |
6624
|
| Finland |
6596
|
| Norway |
5585
|
| Malaysia |
5289
|
| Philippines |
5052
|
| Austria |
5046
|
| Denmark |
4980
|
| Hong Kong |
4914
|
| Turkey |
4728
|
| Slovakia |
4599
|
| New Zealand |
4369
|
| Portugal |
4228
|
| Argentina |
3712
|
| Belarus |
3518
|
| Hungary |
3465
|
| Bulgaria |
3301
|
| Mexico |
2960
|
| South Africa |
2945
|
| Vietnam |
2721
|
| Greece |
2712
|
| Indonesia |
2527
|
| Croatia |
1881
|
| Serbia |
1843
|
| Iran |
1842
|
| Thailand |
1726
|
| Pakistan |
1660
|
| Egypt |
1519
|
| Malta |
1422
|
| Estonia |
1385
|
| Slovenia |
1334
|
| Lithuania |
1304
|
| United Arab Emirates |
1167
|
| Chile |
1104
|
| Saudi Arabia |
1096
|
| Colombia |
1067
|
| Latvia |
922
|
| Kazakhstan |
725
|
| Peru |
649
|
| Morocco |
585
|
| Sri Lanka |
516
|
| Luxembourg |
516
|
| Moldova |
439
|
| Uruguay |
435
|
| Venezuela |
431
|
| Jordan |
425
|
| Tunisia |
425
|
| Bolivia |
418
|
| Armenia |
371
|
| Algeria |
362
|
| Costa Rica |
355
|
| Iceland |
353
|
| Panama |
352
|
| Macedonia [FYROM] |
347
|
| Bosnia and Herzegovina |
327
|
| Cyprus |
317
|
| Bangladesh |
314
|
| Nigeria |
298
|
| Puerto Rico |
296
|
| Jamaica |
251
|
| Ecuador |
248
|
| Kuwait |
239
|
| Lebanon |
218
|
| Qatar |
217
|
| Kenya |
195
|
| Georgia |
194
|
| Mongolia |
189
|
| Dominican Republic |
163
|
| Macau |
156
|
| Trinidad and Tobago |
147
|
| Bahrain |
143
|
| Uzbekistan |
142
|
| Guatemala |
141
|
| Azerbaijan |
134
|
| Mauritius |
128
|
| Oman |
117
|
| Nepal |
110
|
| El Salvador |
106
|
| Syria |
103
|
| Iraq |
102
|
| Ghana |
96
|
| Kyrgyzstan |
86
|
| Cambodia |
72
|
| Albania |
71
|
| Serbia and Montenegro |
63
|
| Ethiopia |
63
|
| Uganda |
61
|
| Brunei |
57
|
| Honduras |
55
|
| Isle of Man |
55
|
| Yemen |
55
|
| Cuba |
54
|
| Sudan |
54
|
| Palestinian Territories |
52
|
| Barbados |
49
|
| Myanmar [Burma] |
48
|
| Paraguay |
45
|
| Liechtenstein |
43
|
| Montenegro |
43
|
| Rwanda |
42
|
| Libya |
41
|
| Namibia |
41
|
| Jersey |
40
|
| Maldives |
40
|
| Turks and Caicos Islands |
39
|
| Bermuda |
38
|
| Zimbabwe |
34
|
| Fiji |
32
|
| Nicaragua |
32
|
| Tanzania |
29
|
| Réunion |
27
|
| Gibraltar |
26
|
| New Caledonia |
26
|
| Bahamas |
25
|
| Monaco |
25
|
| Netherlands Antilles |
24
|
| Aruba |
24
|
| Botswana |
24
|
| Cayman Islands |
23
|
| Angola |
22
|
| Madagascar |
20
|
| Guam |
19
|
| Afghanistan |
17
|
| Côte d’Ivoire |
17
|
| Papua New Guinea |
17
|
| Dominica |
16
|
| Guernsey |
16
|
| Guyana |
16
|
| Suriname |
16
|
| Andorra |
14
|
| Belize |
14
|
| Congo [DRC] |
14
|
| Lesotho |
14
|
| Mozambique |
13
|
| Antigua and Barbuda |
12
|
| Laos |
12
|
| French Polynesia |
11
|
| Zambia |
11
|
| Saint Lucia |
10
|
| San Marino |
10
|
| Senegal |
10
|
| Saint Vincent and the Grenadines |
10
|
| Benin |
9
|
| Guinea |
9
|
| Guadeloupe |
9
|
| Malawi |
9
|
| Turkmenistan |
9
|
| U.S. Virgin Islands |
8
|
| Faroe Islands |
7
|
| Grenada |
7
|
| Haiti |
7
|
| British Virgin Islands |
7
|
| Cameroon |
6
|
| French Guiana |
6
|
| Greenland |
6
|
| Martinique |
6
|
| Seychelles |
6
|
| Timor-Leste |
6
|
| Mali |
5
|
| Tajikistan |
5
|
| Gabon |
4
|
| Anguilla |
3
|
| Å land Islands |
3
|
| Swaziland |
3
|
| Burundi |
2
|
| Congo [Republic] |
2
|
| Cape Verde |
2
|
| Djibouti |
2
|
| Saint Kitts and Nevis |
2
|
| Liberia |
2
|
| Somalia |
2
|
| Togo |
2
|
| Vanuatu |
2
|
| Burkina Faso |
1
|
| Bhutan |
1
|
| Falkland Islands [Islas Malvinas] |
1
|
| Gambia |
1
|
| Equatorial Guinea |
1
|
| Guinea-Bissau |
1
|
| Comoros |
1
|
| Mauritania |
1
|
| Palau |
1
|
| Sierra Leone |
1
|
| Vatican City |
1
|
| Samoa |
1
|
Then the first 100 network locations:
| Service Provider |
Visits
|
| microsoft corp |
33646
|
| comcast cable communications inc. |
18544
|
| road runner holdco llc |
16529
|
| internet service provider |
12815
|
| comite gestor da internet no brasil |
10995
|
| hewlett-packard company |
10961
|
| deutsche telekom ag |
9889
|
| japan network information center |
9746
|
| verizon internet services inc. |
7851
|
| network of citrix systems inc |
6945
|
| intel corporation |
6873
|
| symantec corporation |
6812
|
| chunghwa telecom data communication business group |
6381
|
| ip pools |
6314
|
| insignium llc |
6206
|
| reliance communications ltd |
5870
|
| charter communications |
5583
|
| uunet non-portable customer assignment |
4931
|
| verizon online llc |
4900
|
| comcast cable communications holdings inc |
4700
|
| at&t internet services |
4617
|
| eircom |
4567
|
| cox communications |
4540
|
| proxad / free sas |
4451
|
| korea telecom |
4397
|
| abts (karnataka) |
4251
|
| nib (national internet backbone) |
4243
|
| chinanet guangdong province network |
4189
|
| comcast cable communications |
3896
|
| unknown |
3279
|
| xo communications |
3274
|
| chinanet shanghai province network |
3248
|
| shaw communications inc. |
3179
|
| qwest communications company llc |
3156
|
| telstra internet |
3130
|
| tw telecom holdings inc. |
3091
|
| citrix systems inc. |
3029
|
| data general corporation |
2998
|
| cox communications inc. |
2946
|
| bellsouth.net inc. |
2925
|
| optimum online (cablevision systems) |
2853
|
| china unicom beijing province network |
2850
|
| chtd chunghwa telecom co. ltd. |
2791
|
| krnic |
2786
|
| ntt communications corporation |
2779
|
| psinet inc. |
2599
|
| emc corporation |
2499
|
| comcast cable communications ip services |
2435
|
| arcor ag |
2371
|
| cisco systems inc. |
2364
|
| (not set) |
2335
|
| broadband multiplay project o/o dgm bb noc bsnl bangalore |
2285
|
| research in motion limited |
2283
|
| samtel |
2257
|
| rcs & rds s.a. |
2246
|
| computer associates international |
2166
|
| honeywell international inc. |
2106
|
| telus communications inc. |
2103
|
| customers ie |
1954
|
| sympatico hse |
1929
|
| comcast business communications llc |
1853
|
| telefonica de espana sau |
1843
|
| iinet limited |
1840
|
| ziggo consumers |
1810
|
| easynet ltd |
1758
|
| comcast business communications inc. |
1738
|
| microsoft |
1717
|
| kaspersky lab internet |
1698
|
| appense |
1687
|
| chinanet jiangsu province network |
1665
|
| dell computer corporation |
1656
|
| eircom ltd |
1644
|
| taipei taiwan |
1612
|
| abts tamilnadu |
1594
|
| network of ign arch. and design gb |
1578
|
| starhub cable vision ltd |
1555
|
| wipro technologies |
1537
|
| level 3 communications inc. |
1522
|
| tpg internet pty ltd. |
1510
|
| siemens ag |
1483
|
| microsoft corporation |
1478
|
| global crossing |
1433
|
| singnet pte ltd |
1429
|
| dynamic pools |
1426
|
| this space is statically assigned. |
1425
|
| videsh sanchar nigam ltd - india. |
1414
|
| provider local registry |
1403
|
| abts delhi |
1385
|
| qwest communications corporation |
1356
|
| kla instruments corp. |
1316
|
| telia network services |
1311
|
| cncgroup beijing province network |
1278
|
| frontier communications of america inc. |
1264
|
| telecom italia s.p.a. tin easy lite |
1257
|
| videotron ltee |
1255
|
| oracle datenbanksysteme gmbh |
1234
|
| neostrada plus |
1228
|
| suddenlink communications |
1214
|
| dynamic ip pool for broadband customers |
1202
|
| eset s.r.o. |
1200
|
Then the first 100 search keywords and phrases that led to us:
| Keyword |
Visits
|
| (not provided) |
53903
|
| kifastsystemcallret |
10644
|
| crash dump analysis |
10348
|
| crash dump |
9863
|
| ntdll!kifastsystemcallret |
4305
|
| dump analysis |
4143
|
| adplus |
3332
|
| win32 error 0n2 |
2553
|
| windbg commands |
2198
|
| memory dump analysis |
2183
|
| windbg |
2131
|
| crash dumps |
1825
|
| dumpanalysis.org |
1818
|
| nt!_gshandlercheck_seh |
1734
|
| dmitry vostokov |
1718
|
| crashdump |
1683
|
| symbol file could not be found |
1669
|
| bugcheck 3b |
1458
|
| memory dump analysis anthology |
1393
|
| crash dump analyzer |
1360
|
| warning: frame ip not in any known module. following frames may be wrong. |
1347
|
| windbg cheat sheet |
1318
|
| windbg crash dump analysis |
1271
|
| minidump analysis |
1259
|
| adplus download |
1214
|
| core dump analysis |
1167
|
| fnodobfm |
1159
|
| dumpanalysis |
1142
|
| windows 7 crash dump |
1142
|
| windbg analyze |
1118
|
| kisystemservicecopyend |
1066
|
| frame ip not in any known module |
1010
|
| getcontextstate failed, 0×80070026 |
949
|
| crash dump windows 7 |
930
|
| the stored exception information can be accessed via .ecxr. |
925
|
| windbg script |
922
|
| error: symbol file could not be found |
912
|
| vista crash dump |
895
|
| windows crash dump analysis |
888
|
| system_thread_exception_not_handled |
857
|
| анализ дампа памяти |
857
|
| dump analyzer |
847
|
| дамп памяти |
821
|
| pool corruption |
820
|
| time travel debugging |
776
|
| system_service_exception |
772
|
| kernel_mode_exception_not_handled |
741
|
| ntdll kifastsystemcallret |
741
|
| the stored exception information can be accessed via .ecxr |
734
|
| kmode_exception_not_handled |
726
|
| trap frame |
719
|
| idna trace |
695
|
| windbg crash dump |
694
|
| kiuserexceptiondispatcher |
691
|
| minidump analyzer |
672
|
| bugcheck 7e |
670
|
| kernel32!pnlsuserinfo |
643
|
| windbg scripts |
641
|
| rtlpwaitoncriticalsection |
635
|
| minidump |
628
|
| bugcheck system_service_exception |
621
|
| exception_double_fault |
597
|
| warning: stack unwind information not available. following frames may be wrong. |
584
|
| application_fault_status_breakpoint |
583
|
| crash dump vista |
582
|
| memory dump analysis tool |
576
|
| getcontextstate failed, 0xd0000147 |
575
|
| memoretics |
544
|
| dumpanalysis.org/asmpedia |
537
|
| failure_bucket_id |
524
|
| “dec 15″ module windbg |
511
|
| error: symbol file could not be found. |
511
|
| download adplus |
507
|
| basethreadinitthunk |
505
|
| dr watson vista |
505
|
| ntkrnlmp.exe crash dump |
499
|
| ntdll.dll!kifastsystemcallret |
492
|
| rtlplowfragheapfree |
488
|
| analyze minidump |
477
|
| adplus tutorial |
473
|
| application_hang_blockedon_fileio |
468
|
| bios disassembly ninjutsu uncovered |
460
|
| ntdll.kifastsystemcallret |
460
|
| analyze crash dump |
459
|
| windows dump analysis |
459
|
| debug_flr_image_timestamp |
456
|
| system_thread_exception_not_handled (7e) |
456
|
| windbg dump analysis |
446
|
| windbg hang |
438
|
| windows debugging: practical foundations |
434
|
| crash dump analysis windbg |
432
|
| dynamicbase aslr |
422
|
| crash dump analysis tool |
419
|
| nt!kebugcheckex |
414
|
| rtluserthreadstart |
414
|
| type referenced: kernel32!pnlsuserinfo |
407
|
| error: symbol file could not be found. defaulted to export symbols for ntkrnlmp.exe |
405
|
| memory dump |
403
|
| warning: frame ip not in any known module. following frames may be wrong |
399
|
| application_hang_busyhang |
398
|
Then browser stats (we have never thought that there are so many of them):
| Browser |
Visits
|
| Internet Explorer |
446051
|
| Firefox |
356686
|
| Chrome |
184535
|
| Opera |
45787
|
| Safari |
24123
|
| Mozilla |
3780
|
| Mozilla Compatible Agent |
2401
|
| Android Browser |
1337
|
| Konqueror |
1057
|
| IE with Chrome Frame |
982
|
| Opera Mini |
705
|
| SeaMonkey |
503
|
| Safari (in-app) |
197
|
| Lunascape |
144
|
| BlackBerry8900 |
128
|
| Camino |
126
|
| RockMelt |
124
|
| (not set) |
96
|
| Netscape |
72
|
| Playstation 3 |
36
|
| IUC |
34
|
| Googlebot |
29
|
| Lynx |
24
|
| Unsupported Browser Version |
22
|
| BlackBerry9630 |
21
|
| NetFront |
17
|
| BlackBerry9700 |
15
|
| Microsoft-Symbol-Server |
14
|
| BlackBerry9000 |
12
|
| Galeon |
11
|
| Midori |
9
|
| NokiaE63 |
9
|
| Yahoo! Slurp |
9
|
| BlackBerry8530 |
8
|
| BlackBerry8520 |
7
|
| PagePeeker.com |
7
|
| SAMSUNG-SGH-I617 |
7
|
| BlackBerry9530 |
6
|
| JUC |
6
|
| MSR-ISRCCrawler |
6
|
| OpenWave |
6
|
| anonimo |
5
|
| BlackBerry9300 |
5
|
| HTC_HD2_T8585 Opera |
5
|
| Nokia5233 |
5
|
| Space Bison |
5
|
| -Vasya |
4
|
| Blazer |
4
|
| Uzbl |
4
|
-^_^- Hello  |
3
|
| <?echo ‘<pre>’; system |
3
|
| 12345 |
3
|
| BlackBerry9330 |
3
|
| BlackBerry9650 |
3
|
| HTC_P3700 Opera |
3
|
| HTC_TyTN_II Mozilla |
3
|
| NOKIAN78 |
3
|
| Playstation Portable |
3
|
| PPC; 240×320; HTC_P3450 |
3
|
| undefined GoogleToolbarBB |
3
|
| anonymous |
2
|
| Empty |
2
|
| GreatBrowse |
2
|
| Helyi user agent |
2
|
| HTC_Touch_Pro2_T7373 Opera |
2
|
| HTC_Touch2_T3333 Opera |
2
|
| J2ME |
2
|
| Mozilla 5.0 |
2
|
| NokiaC1-01 |
2
|
| NokiaC3-00 |
2
|
| NokiaC7-00 |
2
|
| NokiaX2-01 |
2
|
| nwzfq |
2
|
| test |
2
|
| — |
1
|
| ?M5 |
1
|
| “PagePeeker.com” |
1
|
| <?include |
1
|
| <script>alert |
1
|
| <SCRIPT>window.location=’http: |
1
|
| 2.0.0.11 |
1
|
| 31337′ |
1
|
| 8900b |
1
|
| AltaVista Intranet V2.0 evreka.com crawler@evreka.com |
1
|
| annoying |
1
|
| AppEngine-Google; |
1
|
| BlackBerry9500 |
1
|
| BlackBerry9550 |
1
|
| bwh3_user_agent |
1
|
| Citrix |
1
|
| EBABrowser |
1
|
| EY |
1
|
| fake_user_agent Mozilla |
1
|
| FAST Enterprise Crawler 6 used by Reed Exhibitions |
1
|
| foo |
1
|
| General Browser |
1
|
| GOOGLEBOT |
1
|
| HD_mini_T5555 Opera |
1
|
| Hellbrowser 6.66 |
1
|
| holy_teacher FirePHP |
1
|
| HTC_P3490 Opera |
1
|
| HTC_P4550 Mozilla |
1
|
| HTC_Polaris Mozilla |
1
|
| HTC_Touch_3G_T3232 Opera |
1
|
| HTC_Touch_HD_T8282 Opera |
1
|
| HTC_Touch_Pro_T7272 Opera |
1
|
| HTC_Touch2_T3320 Opera |
1
|
| HTC-8900 |
1
|
| IE 8 |
1
|
| IE6 |
1
|
| iTunes |
1
|
| Keep Out |
1
|
| KraftwayBrowser2 |
1
|
| Links |
1
|
| Maemo Browser |
1
|
| Medusa |
1
|
| MERONG |
1
|
| Motorola_ES405B |
1
|
| mozilla |
1
|
| Mozilla Firefox |
1
|
| MS-OC 4.0 |
1
|
| msie |
1
|
| NCSA Mosaic |
1
|
| NightDynamo AdminPanel v0.2.1 |
1
|
| Nokia2700c-2 |
1
|
| Nokia2730c-1 |
1
|
| Nokia305 |
1
|
| Nokia5230 |
1
|
| Nokia5310XpressMusic |
1
|
| Nokia5800 XpressMusic |
1
|
| Nokia6300 |
1
|
| Nokia6700c-1 |
1
|
| NokiaC2-01 |
1
|
| NokiaC2-02 |
1
|
| NokiaC2-03 |
1
|
| NokiaC5-03 |
1
|
| nokiac6-00 |
1
|
| NokiaC6-00 |
1
|
| NOKIAE65 |
1
|
| NokiaE66 |
1
|
| NokiaE71 |
1
|
| NokiaE71-2;Mozilla |
1
|
| NokiaE72-1 |
1
|
| NokiaN-GageQD |
1
|
| NokiaN70-1 |
1
|
| NokiaNokia 6210s |
1
|
| NoneOfYourBusiness |
1
|
| nothisname_wangxiaoyang3 |
1
|
| OmniWeb |
1
|
| Palm750 |
1
|
| Peeplo Screenshot Bot |
1
|
| PerTrUsTsQuiD |
1
|
| pippos.7 |
1
|
| PPC; 480×800; HTC_Touch_HD_T8282; OpVer 34.159.1.612 |
1
|
| PriceGoblin User Agent |
1
|
| Private |
1
|
| Privoxy |
1
|
| Read Later |
1
|
| SAMSUNG-GT-E2222 |
1
|
| samsung-gt-s3653 |
1
|
| samsung-gt-s3653 UNTRUSTED |
1
|
| SAMSUNG-S8000 |
1
|
| SAMSUNG-SGH-I637 |
1
|
| Samsung-SPHM540 Polaris |
1
|
| SmallProxy 3.5.4 |
1
|
| SonyEricssonK750 |
1
|
| Surf |
1
|
| tdhbrowser |
1
|
| TiFiC Client Z |
1
|
| union update table sd_users set userid=9 where username=’coco |
1
|
| unknown |
1
|
| Unknown |
1
|
| UNTRUSTED |
1
|
| Updownerbot |
1
|
| WIN |
1
|
| WinXP SP2 |
1
|
| Wlwap |
1
|
| WM5 PIE |
1
|
| Xda_orbit_2; 240×320 |
1
|
| Xyi znat kakoi browser MRA 5.7 |
1
|
| ZooShot 0.1a |
1
|
| ZooShot 0.42 |
1
|
and finally mobile devices stats (you may find your own device there):
| Mobile Device Info |
Visits
|
| Apple iPhone |
2292
|
| Apple iPad |
1940
|
| (not set) |
1099
|
| Samsung GT-I9100 Galaxy S II |
167
|
| Apple iPod Touch |
112
|
| Asus Eee Pad Transformer TF101 |
112
|
| SonyEricsson LT15i Xperia Arc |
94
|
| Motorola Xoom |
47
|
| Samsung Galaxy Nexus |
47
|
| Samsung GT-I9000 Galaxy S |
34
|
| Samsung GT-P7510 Galaxy Tab 10.1 |
30
|
| Google Nexus S Samsung Nexus S |
26
|
| HTC EVO 4G |
26
|
| Google Nexus 7 |
21
|
| RIM BlackBerry Bold Touch 9900 Dakota |
21
|
| Samsung GT-N7000 Galaxy Note |
21
|
| Acer A500 Picasso |
17
|
| Asus Eee Pad TF201 Transformer Prime |
17
|
| HTC Desire HD |
17
|
| Motorola DroidX |
17
|
| Motorola XT862 Droid 3 |
17
|
| Samsung GT-S5830 Galaxy Ace |
17
|
| Samsung SGH-I747 Galaxy SIII |
17
|
| Samsung SGH-i917 Omnia 7 |
17
|
| Verizon Droid2 |
17
|
| Google Nexus One |
13
|
| Google Nexus One HTC Nexus One |
13
|
| HTC ADR6300 Incredible |
13
|
| Motorola Droid 2 |
13
|
| Samsung GT-P7500 P4 |
13
|
| Samsung SHW-M250K GALAXY S II (KT) |
13
|
| Apple iPod |
9
|
| BlackBerry 9780 |
9
|
| BlackBerry 9800 Torch |
9
|
| Dell Venue Pro |
9
|
| HTC Desire |
9
|
| HTC G2 HTC Sappire |
9
|
| HTC HD7 |
9
|
| HTC T9292 HD7 |
9
|
| Motorola MB860 Atrix |
9
|
| Nokia E63 |
9
|
| RIM BlackBerry 8530 Curve |
9
|
| Samsung GT-I9001 |
9
|
| Samsung GT-I9300 Galaxy S3 |
9
|
| Samsung GT-N8000 Galaxy Note 10.1 |
9
|
| Samsung GT-P1000 Galaxy Tab |
9
|
| Sharp IS03 IS03 for KDDI |
9
|
| T-Mobile myTouch4G |
9
|
| Toshiba AT100 |
9
|
| ZTE N860 |
9
|
| Acer A101 Vangogh |
4
|
| Acer A200 Picasso_E |
4
|
| Acer Acer E310 Liquid Mini |
4
|
| Asus TF300T Transformer Pad TF300T |
4
|
| BlackBerry 8520 Curve |
4
|
| BlackBerry 9900 Dakota |
4
|
| DoCoMo L-05D Optimus it |
4
|
| DoCoMo P502i |
4
|
| Fujitsu F-12C F-12C for DoCoMo |
4
|
| Google Nexus S |
4
|
| Google Wireless Transcoder |
4
|
| HTC A8181 Desire |
4
|
| HTC ADR6350 Droid Incredible 2 |
4
|
| HTC ADR6400L Thunderbolt |
4
|
| HTC ADR6400L Thunderbolt 4G |
4
|
| HTC APC715CKT EVO Design 4G |
4
|
| HTC Bravo |
4
|
| HTC Desire X0H6T |
4
|
| HTC Glacier |
4
|
| HTC Incredible S Incredible S |
4
|
| HTC Inspire 4G |
4
|
| HTC ISW12HT EVO 3D ISW12HT for KDDI |
4
|
| HTC Mozart 7 Mozart |
4
|
| HTC PC36100 EVO 4G |
4
|
| HTC PJ83100 One X |
4
|
| HTC Radar 4G |
4
|
| HTC S510e Desire S |
4
|
| HTC T7380 TouchFLO |
4
|
| HTC X515 EVO 3D |
4
|
| Huawei M860 Ascend |
4
|
| Huawei u8800 Ideos X5 |
4
|
| kddi ISW11HT HTC EVO WiMAX ISW11HT for KDDI |
4
|
| LG C900 Quantum |
4
|
| LG E900 Optimus 7 |
4
|
| LG LS670 Optimus S |
4
|
| LG MS690 Optimus M |
4
|
| LG VM670 Optimus V |
4
|
| LG VS910 4G Revolution |
4
|
| Motorola A953 MILESTONE 2 |
4
|
| Motorola ISW11M PHOTON ISW11M for KDDI |
4
|
| Motorola MB501 |
4
|
| Motorola MB525 DEFY |
4
|
| Motorola MB611 |
4
|
| Motorola MOTXT912B Droid Razr 4G |
4
|
| Motorola MZ601 Xoom |
4
|
| Motorola MZ604 Xoom |
4
|
| Motorola MZ605 Xoom |
4
|
| Motorola xt875 Droid Bionic |
4
|
| Nokia 5800d XpressMusic |
4
|
| Nokia C3-00 |
4
|
| Nokia C5-03 C5 |
4
|
| Nokia C6-00 |
4
|
| Nokia Lumia 710 |
4
|
| Nokia Lumia 800 |
4
|
| RIM BlackBerry 9300 Curve 3G |
4
|
| RIM BlackBerry 9700 Bold |
4
|
| RIM BlackBerry 9800 Torch |
4
|
| RIM Blackberry Bold Touch 9930 |
4
|
| Samsung GT i5700 Galaxy Spica |
4
|
| Samsung GT I9000T Galaxy S |
4
|
| Samsung GT-I9100G Galaxy S II |
4
|
| Samsung GT-I9100P Galaxy S II NFC |
4
|
| Samsung GT-I9103 |
4
|
| Samsung GT-I9300 Galaxy SIII |
4
|
| Samsung GT-N8010 Galaxy Note 10.1 |
4
|
| Samsung GT-P7500 Galaxy Tab 10.1 |
4
|
| Samsung SCH-I500 Fascinate |
4
|
| Samsung SCH-I535 4G Galaxy SIII |
4
|
| Samsung SGH-i717 Galaxy Note |
4
|
| Samsung SGH-I747 Galaxy S3 |
4
|
| Samsung SGH-I777 |
4
|
| Samsung SGH-I777 Galaxy S II |
4
|
| Samsung SGH-I897 Galaxy S Captivate |
4
|
| Samsung SHW-M250S GALAXY S II (SKT) |
4
|
| Samsung SPH-D700 Epic 4G |
4
|
| Samsung SWH-M110S |
4
|
| Sharp 003SH Sharp Galapagos 003SH for SoftBank |
4
|
| Softbank 001DL DELL Streak |
4
|
| SonyEricsson LT26i Xperia Arc HD |
4
|
| Xiaomi MI-ONE Plus M1 Plus |
4
|
- Dmitry Vostokov @ DumpAnalysis.org + TraceAnalysis.org -
Posted in Announcements, Crash Dump Analysis, Debugging, DumpAnalysis.org Statistics, History, Malware Analysis, Software Diagnostics, Software Diagnostics Institute, Software Engineering, Software Technical Support, Software Trace Analysis, Victimware Analysis | No Comments »
Friday, July 13th, 2012
For some time I was struggling with finding a good name for memory dump and software trace analysis activities. The name Memoretics I use for the science of memory dump analysis (that also incorporates software traces) seems not so good to describe the whole practical activity that should be transparent to everyone in IT. Fortunately, I timely understood that all these activities constitute the essence of software diagnostics that previously lacked any solid foundation. Thus, Software Diagnostics Institute was reborn from the previous Crash Dump Analysis Portal. This institute does pure and applied research and scientific activities and in recent years was funded mainly from OpenTask publisher and recently from Memory Dump Analysis Services. The latter company also recognized that the broadening of its commercial activities requires a new name. So, Software Diagnostics Services was reborn:
The First Comprehensive Software Diagnostics Service
- Dmitry Vostokov @ DumpAnalysis.org + TraceAnalysis.org -
Posted in Announcements, Cloud Memory Dump Analysis, Complete Memory Dump Analysis, Core Dump Analysis, Crash Analysis Report Environment (CARE), Crash Dump Analysis, Debugging, Debugging Bureau, Debugging Industry, Debugging Methodology, Debugging Today, Debugging Trends, Education, Education and Research, Escalation Engineering, Event Tracing for Windows (ETW), First Fault Software Diagnostics, Generative Debugging, JIT Crash Analysis, JIT Memory Space Analysis, Java Debugging, Kernel Development, Kernel Memory Dump Analysis, Linux Crash Corner, MFC Debugging, Mac Crash Corner, Mac OS X, Malware Analysis, Memoretics, Memory Analysis Forensics and Intelligence, Memory Analysis Report System, Memory Dump Analysis Methodology, Memory Dump Analysis Services, Minidump Analysis, New Debugging School, Pattern-Driven Debugging, Pattern-Driven Software Support, Performance Monitoring, Root Cause Analysis, SQL Debugging, Security, Software Debugging Services, Software Diagnostics, Software Diagnostics Institute, Software Diagnostics Services, Software Engineering, Software Problem Solving, Software Technical Support, Software Trace Analysis, Software Trace Analysis Report Environment (STARE), Tools, Training and Seminars, Troubleshooting Methodology, Unified Software Diagnostics, Windows 7, Windows 8, Windows Azure, Windows Mobile, Windows Server 2008, Windows System Administration, x64 Mac OS X, x64 Windows | No Comments »
Monday, July 2nd, 2012
Sometimes I get requests to review application memory dump capture design. Of course, such requests usually come only when such designs don’t work or there are problems with loading saved crash dumps. The common blueprint of such architectures is a top level exception handler that use some API do capture and save process memory state. However, such designs forget why separate processed were introduced in the first place: to guard process memory space of different unrelated tasks (for related tasks there are threads). The data of the module (and its thread state) that does process memory capture may also be corrupt. The right design would be to show a message box with an information on how to use external process memory dumper such as Task Manager. If we need an automation then the right thing is to rely on WER features. Let separate processes do their work in separate spaces.
- Dmitry Vostokov @ DumpAnalysis.org + TraceAnalysis.org -
Posted in Core Dump Analysis, Debugging, Software Architecture, Software Diagnostics, Software Engineering | No Comments »
Sunday, June 24th, 2012
This is a second Webinar from Memory Dump Analysis Services on software diagnostics. The first one is about pattern recognition. During this Webinar you will learn how to apply systems theory and systems thinking for effective and efficient abnormal software behavior diagnostics: the foundation of software troubleshooting and debugging. The seminar summarizes 6 years of research done by Software Diagnostics Institute started with a short blog post Dumps and Systems Theory.

Title: Introduction to Systemic Software Diagnostics: Systems Thinking in Memory Dump and Software Trace Analysis
Date: 3rd of September, 2012
Time: 17:00 (BST) 12:00 (EST) 09:00 (PST)
Duration: 60 minutes
Space is limited.
Reserve your Webinar seat now at:
https://www3.gotomeeting.com/register/377382766
- Dmitry Vostokov @ DumpAnalysis.org + TraceAnalysis.org -
Posted in Announcements, Memory Dump Analysis Services, Software Diagnostics, Software Diagnostics Institute, Software Diagnostics Patterns, Software Engineering, Software Technical Support, Systems Thinking, Training and Seminars, Unified Software Diagnostics, Webinars | No Comments »
Monday, June 18th, 2012
Posted in Announcements, Certification, Core Dump Analysis, Crash Dump Analysis, Crash Dump Patterns, Debugging, Software Diagnostics, Software Diagnostics Institute, Software Diagnostics Patterns, Software Engineering, Software Technical Support, Software Trace Analysis, Trace Analysis Patterns | No Comments »
Tuesday, June 12th, 2012
DumpAnalysis.org portal has been reorganized to Software Diagnostics Institute to reflect the nature of its research activities. More updates later on.
- Dmitry Vostokov @ DumpAnalysis.org + TraceAnalysis.org -
Posted in Announcements, Core Dump Analysis, Crash Dump Analysis, Crash Dump Patterns, Debugging, Software Behavior Patterns, Software Diagnostics, Software Diagnostics Institute, Software Diagnostics Patterns, Software Engineering, Software Trace Analysis, Trace Analysis Patterns | No Comments »
Tuesday, June 5th, 2012
-
Motivated by 7 Habits of Highly Effective Debuggers I would like to reflect on a distinction between diagnostics and problem solving as separate processes (although highly related). First, we reverse the precept from that article because stories such as software logs and traces are of primary importance to software diagnostics (and not only). And without diagnostics there is no effective debugging (treatment, problem solving, etc.)
The Principle Precept of Diagnostics
Stories NOT Statistics secure certainty.
Next parts will be about actual habits so please stay tuned. I would try to finish this list before the forthcoming Webinar on software diagnostics.
- Dmitry Vostokov @ DumpAnalysis.org + TraceAnalysis.org -
Posted in 7 Habits, Core Dump Analysis, Crash Dump Analysis, Escalation Engineering, Software Diagnostics, Software Engineering, Software Narratology, Software Problem Solving, Software Technical Support, Software Trace Analysis | No Comments »
Sunday, April 15th, 2012
After 4 years in print this bestselling title needs an update to address minor changes, include extra examples and reference additional research published in Volumes 2, 3, 4, 5 and 6.
- Title: Memory Dump Analysis Anthology, Volume 1
- Author: Dmitry Vostokov
- Publisher: OpenTask (Summer 2012)
- Language: English
- Product Dimensions: 22.86 x 15.24
- Paperback: 800 pages
- ISBN-13: 978-1-908043-35-1
- Hardcover: 800 pages
- ISBN-13: 978-1-908043-36-8
The cover for both paperback and hardcover titles will also have a matte finish. We used A Memory Window artwork for the back cover.

- Dmitry Vostokov @ DumpAnalysis.org + TraceAnalysis.org -
Posted in Aesthetics of Memory Dumps, Announcements, AntiPatterns, Art, Assembly Language, Best Practices, Books, Bugchecks Depicted, C and C++, Complete Memory Dump Analysis, Computer Science, Crash Dump Analysis, Crash Dump Patterns, Crash Dumps for Dummies, Debugging, Debugging Methodology, Dr. Watson, Escalation Engineering, Fun with Crash Dumps, GDB for WinDbg Users, Hardware, Images of Computer Memory, Kernel Development, Mathematics of Debugging, Memiotics (Memory Semiotics), Memoretics, Memory Dump Analysis Methodology, Memory Space Art, Memory Space Music, Memory Visualization, Minidump Analysis, Multithreading, Pattern-Driven Debugging, Pattern-Driven Software Support, Publishing, Reference, Root Cause Analysis, Science of Memory Dump Analysis, Software Architecture, Software Behavior DNA, Software Behavior Patterns, Software Behavioral Genome, Software Diagnostics, Software Engineering, Software Technical Support, Stack Trace Collection, Testing, Tools, Troubleshooting Methodology, Vista, WinDbg Scripts, WinDbg Tips and Tricks, WinDbg for GDB Users, Windows 7, Windows Data Structures, Windows Server 2008, Windows System Administration, x64 Windows | No Comments »
Sunday, April 15th, 2012
In a week this short full color book should appear in online bookstores:
- Title: Software Narratology: An Introduction to the Applied Science of Software Stories
- Authors: Dmitry Vostokov, Memory Dump Analysis Services
- Description: This is a transcript of Memory Dump Analysis Services Webinar about Software Narratology: an exciting new discipline and a field of research founded by DumpAnalysis.org. When software executes it gives us its stories in the form of UI events, software traces and logs. Such stories can be analyzed for their structure and patterns for troubleshooting, debugging and problem resolution purposes. Topics also include software narremes and their types, anticipatory software construction and software diagnostics.
- Publisher: OpenTask (April 2012)
- Language: English
- Product Dimensions: 28.0 x 21.6
- Paperback: 26 pages
- ISBN-13: 978-1908043078

- Dmitry Vostokov @ DumpAnalysis.org + TraceAnalysis.org -
Posted in Announcements, Books, CDF Analysis Tips and Tricks, Code Reading, Computer Science, Debugging, Debugging Methodology, Debugging Trends, Education and Research, Escalation Engineering, Event Tracing for Windows (ETW), Hermeneutics of Memory Dumps and Traces, Ideas, Narralog Programming Language, New Debugging School, Pattern-Driven Debugging, Pattern-Driven Software Support, Presentations, Publishing, Root Cause Analysis, SPDL, Science of Software Tracing, Software Behavior DNA, Software Behavior Patterns, Software Behavioral Genome, Software Diagnostics, Software Engineering, Software Narrative Fiction, Software Narrative Science, Software Narratology, Software Narremes, Software Problem Description Patterns, Software Problem Solving, Software Technical Support, Software Trace Analysis, Software Trace Analysis and History, Software Trace Deconstruction, Software Trace Linguistics, Software Trace Modeling, Software Trace Reading, Software Trace Visualization, Software Tracing Implementation Patterns, Software Troubleshooting Patterns, Structural Trace Patterns, Systems Thinking, Testing, Tools, Trace Analysis Patterns, Training and Seminars, Troubleshooting Methodology, UI Problem Analysis Patterns, Unified Debugging Patterns, Unified Software Diagnostics, Webinars | No Comments »
Thursday, April 12th, 2012
There are many lists for great books but I’d like to share the one that have a more personal touch. These books I wanted to read on the first sight and devoured them when I had an occasion.
First book that made a great impression on me was C Programming Language  which I saw and read in 1987 (in Russian translation with very nice hardcover binding). There was a C implementation available on a PDP-11 clone I worked with at that time.

Another book that reinforced my better function prototype reading and pointer declarations was Expert C Programming.

I confess I had a long trouble understanding C++ long back ago despite reading The C++ Programming Language by Bjarne Stroustrup (reading several editions) and Effective C++ series by Scott Meyers partly because of my long practice of Win32 programming using C and partly because I didn’t understand why I needed C++ to do the same. Popular books such as C++ for Real Programmers (in Russian translation) terrified me with their complexity (although I made honest efforts to read them from cover to cover). However, when I saw and started reading the book Advanced CORBA Programming with C++
 I really understood why we needed C++ and how it all worked.

After that rereading The C++ Programming Language and (More) Effective C++ books was a great pleasure.
The other part of C++, STL was greatly clarified by reading the following book in 2003 from cover to cover (at that time the first edition): The C++ Standard Library: A Tutorial and Reference .
.

Inside the C++ Object Model book clarified C++ implementation issues and helped later with crash dump analysis of C++ programs.

I plan to continue this “Great Impression” series with other topics and also to publish a recommended reading list for C++ based on books from my personal library that started growing when I was an employee at Programming Research in 2001 - 2003:

The row of books is all about C++. Except the big thick red book about English language grammar (as I became interested in other grammars than C++) The Cambridge Grammar of the English Language :
:

Now !ad debugger command: I’m developing a traning course Deep Down C++ with Memory Dump Analysis.
- Dmitry Vostokov @ DumpAnalysis.org + TraceAnalysis.org -
Posted in Bigraphical Details, Books, C and C++, Deep Down C++, History, Software Engineering | No Comments »
Monday, April 9th, 2012
Memory Dump Analysis Services organizes a free Webinar on Unified Software Diagnostics (USD) and the new scalable cost-effective software support model called Pattern-Driven Software Support devised to address various shortcomings in existing tiered software support organizations. Examples cover Windows, Mac OS and Linux.

Date: 22nd of June, 2012
Time: 17:00 (BST) 12:00 (EST) 09:00 (PST)
Duration: 60 minutes
Space is limited.
Reserve your Webinar seat now at:
https://www3.gotomeeting.com/register/172771078
- Dmitry Vostokov @ DumpAnalysis.org + TraceAnalysis.org -
Posted in Announcements, Best Practices, Crash Dump Analysis, Crash Dump Patterns, Debugging, Debugging Methodology, Debugging Trends, Economics, Escalation Engineering, Event Tracing for Windows (ETW), JIT Crash Analysis, JIT Memory Space Analysis, Malware Analysis, Malware Patterns, Memoretics, Memory Analysis Forensics and Intelligence, Memory Dump Analysis Methodology, Memory Dump Analysis Services, New Acronyms, New Debugging School, Pattern Prediction, Pattern-Driven Debugging, Pattern-Driven Software Support, Root Cause Analysis, Science of Memory Dump Analysis, Science of Software Tracing, Software Behavior DNA, Software Behavior Patterns, Software Behavioral Genome, Software Diagnostics, Software Engineering, Software Narratology, Software Problem Description Patterns, Software Problem Solving, Software Support Patterns, Software Technical Support, Software Trace Analysis, Software Troubleshooting Patterns, Software Victimology, Software and Economics, Structural Memory Patterns, Structural Trace Patterns, Systems Thinking, Testing, Tools, Trace Analysis Patterns, Training and Seminars, Troubleshooting Methodology, UI Problem Analysis Patterns, Unified Debugging Patterns, Unified Software Diagnostics, Victimware, Webinars, Workaround Patterns | No Comments »
Sunday, April 1st, 2012
Software trace analysis is notoriously difficult so a bit of folk music is needed to make debugging sessions less boring. The following album came to my attention in a local library and after listening to it I recommend it for software log analysis sessions:
Make It Through This World

Here’s my own track title interpretation:
1. Dream Away The Defects
2. This I’d Analyze
3. A Magnifier
4. Make It Through This Trace
5. Don’t Let It Go Unanalyzed
6. Request-Reply Pair
7. I Love It When It’s Short
8. No Higher Specs
9. Said, Said.
10. When I Think Of You, My Customers
11. Close to The Defect
12. A Debugger For You Now
- Dmitry Vostokov @ DumpAnalysis.org + TraceAnalysis.org -
Posted in CDF Analysis Tips and Tricks, Escalation Engineering, Fun with Debugging, Fun with Software Traces, Music for Debugging, Software Engineering, Software Technical Support, Software Trace Analysis | No Comments »
Wednesday, March 28th, 2012
Always imitate the behavior of the working program when it is crashing.
George Meredith
- Dmitry Vostokov @ DumpAnalysis.org + TraceAnalysis.org -
Posted in Bugtations, Fun with Crash Dumps, Software Engineering | No Comments »
Tuesday, March 20th, 2012
The previous definition of software narratology was restricted to software traces and logs (the top left quadrant on a software narrative square, also the part of Memoretics which studies memory snapshots). Now, with the broadening of the domain of software narratology to the whole world of software narrative stories including actor interactions with software in construction requirements use cases and post-construction incidents we give another definition:
Software narrative is a representation of software events and changes of state. Software Narratology is a discipline that studies such software narratives (software narrative science).
- Dmitry Vostokov @ DumpAnalysis.org + TraceAnalysis.org -
Posted in Announcements, Cloud Computing, Code Reading, Computer Forensics, Computer Science, Crash Dump Analysis, Crash Dump Patterns, Debugging, Memoretics, Science of Memory Dump Analysis, Science of Software Tracing, Software Behavior DNA, Software Behavior Patterns, Software Behavioral Genome, Software Engineering, Software Narrative Science, Software Narratology, Software Narremes, Software Problem Description Patterns, Software Problem Solving, Software Technical Support, Software Trace Analysis, Software Trace Deconstruction, Software Trace Modeling, Software Trace Reading, Structural Trace Patterns, Testing, Trace Analysis Patterns | No Comments »
Sunday, March 11th, 2012
The development of SPDL requires extending pattern-driven analysis approach to software problems such as software defect and software incident descriptions. Such a pattern language should help with accurate problem identification and problem resolution through software behaviour analysis and with choosing, for example, appropriate workaround patterns or, for a debugging strategy, unified debugging patterns. This can also be applicable to software security incident descriptions as well.
For this first part, we introduce a pattern called, Problem Summary. This is a very short description that summarizes the essence of the problem from a submitter point of view such as a software user or a technical support engineer. Whether it is correct or incorrect is another problem itself but the missing summary usually requires close reading of the whole problem description text and analyze together various relevant parts to reconstruct the summary.
- Dmitry Vostokov @ DumpAnalysis.org + TraceAnalysis.org -
Posted in Debugging, Escalation Engineering, SPDL, Security, Software Engineering, Software Problem Description Patterns, Software Problem Solving, Software Support Patterns, Software Technical Support, Victimware | No Comments »
