Archive for the ‘AntiPatterns’ Category
Sunday, April 15th, 2012
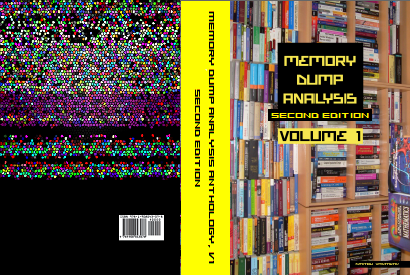
After 4 years in print this bestselling title needs an update to address minor changes, include extra examples and reference additional research published in Volumes 2, 3, 4, 5 and 6.
- Title: Memory Dump Analysis Anthology, Volume 1
- Author: Dmitry Vostokov
- Publisher: OpenTask (Summer 2012)
- Language: English
- Product Dimensions: 22.86 x 15.24
- Paperback: 800 pages
- ISBN-13: 978-1-908043-35-1
- Hardcover: 800 pages
- ISBN-13: 978-1-908043-36-8
The cover for both paperback and hardcover titles will also have a matte finish. We used A Memory Window artwork for the back cover.

- Dmitry Vostokov @ DumpAnalysis.org + TraceAnalysis.org -
Posted in Aesthetics of Memory Dumps, Announcements, AntiPatterns, Art, Assembly Language, Best Practices, Books, Bugchecks Depicted, C and C++, Complete Memory Dump Analysis, Computer Science, Crash Dump Analysis, Crash Dump Patterns, Crash Dumps for Dummies, Debugging, Debugging Methodology, Dr. Watson, Escalation Engineering, Fun with Crash Dumps, GDB for WinDbg Users, Hardware, Images of Computer Memory, Kernel Development, Mathematics of Debugging, Memiotics (Memory Semiotics), Memoretics, Memory Dump Analysis Methodology, Memory Space Art, Memory Space Music, Memory Visualization, Minidump Analysis, Multithreading, Pattern-Driven Debugging, Pattern-Driven Software Support, Publishing, Reference, Root Cause Analysis, Science of Memory Dump Analysis, Software Architecture, Software Behavior DNA, Software Behavior Patterns, Software Behavioral Genome, Software Diagnostics, Software Engineering, Software Technical Support, Stack Trace Collection, Testing, Tools, Troubleshooting Methodology, Vista, WinDbg Scripts, WinDbg Tips and Tricks, WinDbg for GDB Users, Windows 7, Windows Data Structures, Windows Server 2008, Windows System Administration, x64 Windows | No Comments »
Sunday, April 17th, 2011
I’m pleased to announce that MDAA, Volume 5 is available in PDF format:
www.dumpanalysis.org/Memory+Dump+Analysis+Anthology+Volume+5
It features:
- 25 new crash dump analysis patterns
- 11 new pattern interaction case studies (including software tracing)
- 16 new trace analysis patterns
- 7 structural memory patterns
- 4 modeling case studies for memory dump analysis patterns
- Discussion of 3 common analysis mistakes
- Malware analysis case study
- Computer independent architecture of crash analysis report service
- Expanded coverage of software narratology
- Metaphysical and theological implications of memory dump worldview
- More pictures of memory space and physicalist art
- Classification of memory visualization tools
- Memory visualization case studies
- Close reading of the stories of Sherlock Holmes: Dr. Watson’s observational patterns
- Fully cross-referenced with Volume 1, Volume 2, Volume 3, and Volume 4
Its table of contents is available here:
www.dumpanalysis.org/MDAA/MDA-Anthology-V5-TOC.pdf
Paperback and hardcover versions should be available in a week or two. I also started working on Volume 6 that should be available in November-December.
- Dmitry Vostokov @ DumpAnalysis.org + TraceAnalysis.org -
Posted in Aesthetics of Memory Dumps, Analysis Notation, Announcements, AntiPatterns, Archaeology of Computer Memory, Art, Assembly Language, Best Practices, Books, C and C++, CDF Analysis Tips and Tricks, Categorical Debugging, Citrix, Common Mistakes, Common Questions, Complete Memory Dump Analysis, Computer Forensics, Computer Science, Crash Analysis Report Environment (CARE), Crash Dump Analysis, Crash Dump De-analysis, Crash Dump Patterns, Crash Dumps for Dummies, Cyber Warfare, Debugging, Debugging Bureau, Debugging Industry, Debugging Methodology, Debugging Slang, Debugging Trends, Deep Down C++, Dr. Watson, Dublin School of Security, Education and Research, Escalation Engineering, Fun with Crash Dumps, Fun with Debugging, Fun with Software Traces, General Memory Analysis, Hermeneutics of Memory Dumps and Traces, Images of Computer Memory, Kernel Development, Malware Analysis, Mathematics of Debugging, Memiotics (Memory Semiotics), Memory Analysis Forensics and Intelligence, Memory Diagrams, Memory Dump Analysis Services, Memory Dumps in Myths, Memory Space Art, Memory Systems Language, Memory Visualization, Memory and Glitches, Metaphysics of Memory Worldview, Multithreading, Music for Debugging, New Acronyms, New Debugging School, New Words, Pattern Models, Philosophy, Physicalist Art, Publishing, Reverse Engineering, Science of Memory Dump Analysis, Science of Software Tracing, Security, Software Architecture, Software Behavior Patterns, Software Chorography, Software Chorology, Software Defect Construction, Software Engineering, Software Generalist, Software Maintenance Institute, Software Narratology, Software Technical Support, Software Trace Analysis, Software Trace Reading, Software Trace Visualization, Software Tracing for Dummies, Software Troubleshooting Patterns, Software Victimology, Structural Memory Patterns, Structural Trace Patterns, Systems Thinking, Testing, The Way of Philip Marlowe, Tools, Trace Analysis Patterns, Training and Seminars, Troubleshooting Methodology, Victimware, Vista, Webinars, WinDbg Scripting Extensions, WinDbg Scripts, WinDbg Tips and Tricks, WinDbg for GDB Users, Windows 7, Windows Server 2008, Windows System Administration, Workaround Patterns, x64 Windows | No Comments »
Monday, March 7th, 2011

The first Webinar to start an in-depth discussion of pattern-driven software troubleshooting, debugging and maintenance:
Date: 25th of March 2011
Time: 18:30 (GMT) 14:30 (EST) 11:30 (PST)
Duration: 60 minutes
Space is limited.
Reserve your Webinar seat now at:
https://www3.gotomeeting.com/register/448268158
Topics include:
- A Short History of DumpAnalysis.org
- Memory Dump Analysis Patterns
- Troubleshooting and Debugging Tools (Debugware) Patterns
- Software Trace Analysis Patterns
- From Software Defects to Software Behavior
- Workaround Patterns
- Structural Memory Patterns
- Memory Analysis Domain Pattern Hierarchy
- New Directions
Prerequisites: experience in software troubleshooting and/or debugging.
- Dmitry Vostokov @ DumpAnalysis.org + TraceAnalysis.org -
Posted in .NET Debugging, Analysis Notation, Announcements, AntiPatterns, Best Practices, CDA Pattern Classification, Crash Dump Analysis, Crash Dump Patterns, DebugWare Patterns, Debugging, Debugging Methodology, Debugging Trends, Escalation Engineering, Java Debugging, Linux Crash Corner, Mac Crash Corner, Malware Analysis, Malware Patterns, Memory Analysis Forensics and Intelligence, Memory Dump Analysis Services, Pattern Models, Pattern Prediction, Presentations, Software Behavior Patterns, Software Chorology, Software Engineering, Software Narratology, Software Technical Support, Software Trace Analysis, Software Trace Reading, Software Tracing Implementation Patterns, Software Troubleshooting Patterns, Structural Memory Patterns, Structural Trace Patterns, Systems Thinking, Testing, Trace Analysis Patterns, Training and Seminars, Troubleshooting Methodology, Unified Debugging Patterns, Webinars, Workaround Patterns | No Comments »
Saturday, January 22nd, 2011
Pre-analysis - Avoiding crash dump analysis anti-patterns like wrong dump or zippocricy. Sometimes it goes with wild explanation no one asked for. Checking whether a software trace is empty before sending it.
Examples: He is always doing !locks pre-analysis before sending any dump.
- Dmitry Vostokov @ DumpAnalysis.org + TraceAnalysis.org -
Posted in AntiPatterns, Crash Dump Analysis, Crash Dump De-analysis, Debugging, Debugging Slang, Fun with Crash Dumps, Fun with Debugging, Fun with Software Traces, Software Trace Analysis | No Comments »
Saturday, November 6th, 2010
I’m pleased to announce that MDAA, Volume 4 is available in PDF format:
www.dumpanalysis.org/Memory+Dump+Analysis+Anthology+Volume+4
It features:
- 15 new crash dump analysis patterns
- 13 new pattern interaction case studies
- 10 new trace analysis patterns
- 6 new Debugware patterns and case study
- Workaround patterns
- Updated checklist
- Fully cross-referenced with Volume 1, Volume 2 and Volume 3
- Memory visualization tutorials
- Memory space art
Its table of contents is available here:
http://www.dumpanalysis.org/MDAA/MDA-Anthology-V4-TOC.pdf
Paperback and hardcover versions should be available in a week or two. I also started working on Volume 5 that should be available in December.
- Dmitry Vostokov @ DumpAnalysis.org + TraceAnalysis.org -
Posted in .NET Debugging, Aesthetics of Memory Dumps, Announcements, AntiPatterns, Art, Assembly Language, Books, C and C++, CDF Analysis Tips and Tricks, Categorical Debugging, Common Mistakes, Complete Memory Dump Analysis, Computer Science, Countefactual Debugging, Crash Dump Analysis, Crash Dump Patterns, DebugWare Patterns, Debugging, Debugging Slang, Deep Down C++, Education and Research, Escalation Engineering, Fun with Crash Dumps, Fun with Debugging, Images of Computer Memory, Kernel Development, Memiotics (Memory Semiotics), Memoidealism, Memoretics, Memory Space Art, Memory Visualization, Memuonics, Metaphysics of Memory Worldview, Multithreading, Opcodism, Philosophy, Physicalist Art, Publishing, Science Fiction, Science of Memory Dump Analysis, Science of Software Tracing, Security, Software Architecture, Software Behavior Patterns, Software Defect Construction, Software Engineering, Software Narratology, Software Technical Support, Software Trace Analysis, Software Trace Reading, Software Victimology, Stack Trace Collection, Testing, Tools, Trace Analysis Patterns, Troubleshooting Methodology, Uses of UML, Victimware, Virtualization, Vista, Visual Dump Analysis, WinDbg Scripts, WinDbg Tips and Tricks, Windows 7, Windows Server 2008, Windows System Administration, Workaround Patterns, x64 Windows | No Comments »
Friday, June 4th, 2010
An exercise in de-analysis
This anti-pattern is called Wild Explanation. This is a free floating explanation based on loose associations. Its extreme version uses Gödel incompleteness theorems (undecidable crashes and hangs), quantum mechanics (in small time delta any bug can appear and disappear without being caught) or hydrodynamics (code fluidity, turbulence around processor cores) for abnormal software behaviour explanation (similar to Fashionable Nonsense in philosophy, humanities and social sciences). Its milder version is slightly modified original analysis monologue I found when searching Google for stack traces (I provide my comments below):
“Two hints make me assume this can be a physical memory problem:”
PAGE_FAULT_IN_NONPAGED_AREA (50)
Invalid system memory was referenced. This cannot be protected by try-except,
it must be protected by a Probe. Typically the address is just plain bad or it
is pointing at freed memory.
Arguments:
Arg1: e37cc20e, memory referenced.
Arg2: 00000001, value 0 = read operation, 1 = write operation.
Arg3: 8083fe2c, If non-zero, the instruction address which referenced the bad memory
address.
Arg4: 00000000, (reserved)
EXCEPTION_CODE: (NTSTATUS) 0xc0000005 - The instruction at “0x%08lx” referenced memory at “0x%08lx”. The memory could not be “%s”.
I wouldn’t be so quick. Check Hardware Error pattern post and comments there. So let’s de-analyze the analysis.
“c0000005 is Access Denied where C is virtual memory, meaning usually disk cache”
c is just STATUS_SEVERITY_ERROR (0×3 or 0y11) 11000000000000000000000000000101 and doesn’t have any connection to cache or crash beyond a mere coincidence. See NTSTATUS bit descriptions: http://msdn.microsoft.com/en-us/library/cc231200(PROT.10).aspx
“It could be RAM and/or it could be savrt.sys if you’re using something like an antivirus.
Check to see if you need updates for them, Norton, Symantec, McCaffee.”
Of course, it is either RAM or antivirus, what else? What about a virus? All household names.
EXCEPTION_CODE: (NTSTATUS) 0xc0000005 - The instruction at “0x%08lx” referenced memory at “0x%08lx”. ”The memory could not be “%s”.” means there is something wrong with the debugger itself; those should be addresses, not percent signs and alphanumeric garbage.”
Now even a debugger is corrupt. RAM again? It is not a garbage, they’re format codes (like for printf C function) to print actual addresses.
“8083fe2c” this address called a pointer, that referenced “e37cc20e” again, that “e” has specific meaning, some virtual device or another, probably CD ROM, trying to transfer data to RAM. This implies either SCSI or PCI buss or DMA buss timing problems.”
RAM again… Evidence mounts stronger and stronger. Its all about timing. A bus buzzes.
“Which is usually caused by a bad driver, not RAM, but sometimes replacing the RAM “masks” out the failure.”
You never know… A bit of doubt?
“This normally happens with 64-bit machines that take advantage of the 64-bit superfast address access and indexing, known as Vector Indirect Addressing, which is, apparently, too fast for even recent Operating System code.”
I always suspected these machines run x64 times faster… I can only imagine horrors when Vector Indirect Addressing hits an old Operating System code. However, the crash under discussion is x86…
“A write to the “e” device; so, is it some kind of CDR or DVDR or other storage device?”
I guess that was a rhetorical question… or let me finish this thread of thought to connect dots, e-devices, virtual memory, disk cache and CD ROM. What if a page file was configured on a DVD-R?
- Dmitry Vostokov @ DumpAnalysis.org + TraceAnalysis.org -
Posted in AntiPatterns, Crash Dump Analysis, Crash Dump De-analysis, Crash Dump Patterns, Fun with Crash Dumps, Software Technical Support | No Comments »
Sunday, April 18th, 2010
OpenTask to offer first 3 volumes of Memory Dump Analysis Anthology in one set:


The set is available exclusively from OpenTask e-Commerce web site starting from June. Individual volumes are also available from Amazon, Barnes & Noble and other bookstores worldwide.
Product information:
- Title: Modern Memory Dump and Software Trace Analysis: Volumes 1-3
- Author: Dmitry Vostokov
- Language: English
- Product Dimensions: 22.86 x 15.24
- Paperback: 1600 pages
- Publisher: Opentask (31 May 2010)
- ISBN-13: 978-1-906717-99-5
Information about individual volumes:
- Dmitry Vostokov @ DumpAnalysis.org + TraceAnalysis.org -
Posted in .NET Debugging, Aesthetics of Memory Dumps, Announcements, AntiPatterns, Art, Assembly Language, Books, Bugchecks Depicted, C and C++, CDA Pattern Classification, CDF Analysis Tips and Tricks, Categorical Debugging, Certification, Citrix, Code Reading, Common Mistakes, Computational Ghosts and Bug Hauntings, Computer Science, Countefactual Debugging, Crash Analysis Report Environment (CARE), Crash Dump Analysis, Crash Dump Patterns, Crash Dumps for Dummies, Data Recovery, DebugWare Patterns, Debugging, Debugging Methodology, Debugging Slang, Deep Down C++, Dictionary of Debugging, Dr. Watson, Education and Research, Escalation Engineering, Fun with Crash Dumps, Futuristic Memory Dump Analysis, GDB for WinDbg Users, Hardware, History, Horrors of Computation, Hyper-V, Intelligent Memory Movement, Kernel Development, Laws of Troubleshooting and Debugging, Mathematics of Debugging, Memiotics (Memory Semiotics), Memoidealism, Memoretics, Memory Analysis Culture, Memory Analysis Forensics and Intelligence, Memory Auralization, Memory Dump Analysis Jobs, Memory Religion (Memorianity), Memory Space Art, Memory Space Music, Memory Systems Language, Memory Visualization, Memuonics, Minidump Analysis, Multithreading, Music for Debugging, Music of Computation, New Acronyms, New Words, Occult Debugging, Philosophy, Psi-computation, Publishing, Science of Memory Dump Analysis, Science of Software Tracing, Security, Software Architecture, Software Defect Construction, Software Engineering, Software Generalist, Software Maintenance Institute, Software Narratology, Software Technical Support, Software Trace Analysis, Software Trace Visualization, Software Tracing for Dummies, Software Victimology, Stack Trace Collection, Testing, Tools, Trace Analysis Patterns, Training and Seminars, Troubleshooting Methodology, Victimware, Virtualization, Vista, Visual Dump Analysis, WinDbg Scripts, WinDbg Tips and Tricks, WinDbg for GDB Users, Windows 7, Windows Server 2008, Windows System Administration | No Comments »
Friday, April 9th, 2010
Plan to start providing training and seminars in my free time. If you are interested please answer these questions (you can either respond here in comments or use this form for private communication http://www.dumpanalysis.org/contact):
- Are you interested in on-site training, prefer traveling or attending webinars?
- Are you interested in software trace analysis as well?
- What specific topics are you interested in?
- What training level (beginner, intermediate, advanced) are you interested in? (please provide an example, if possible)
Additional topics of expertise that can be integrated into training include Source Code Reading and Analysis, Debugging, Windows Architecture, Device Drivers, Troubleshooting Tools Design and Implementation, Multithreading, Deep Down C and C++, x86 and x64 Assembly Language Reading.
Looking forward to your responses. Any suggestions are welcome.
- Dmitry Vostokov @ DumpAnalysis.org + TraceAnalysis.org -
Posted in .NET Debugging, Announcements, AntiPatterns, Assembly Language, Bugchecks Depicted, C and C++, CDA Pattern Classification, CDF Analysis Tips and Tricks, Certification, Code Reading, Common Mistakes, Crash Analysis Report Environment (CARE), Crash Dump Analysis, Crash Dump Patterns, Crash Dumps for Dummies, Data Recovery, DebugWare Patterns, Debugging, Debugging Methodology, Deep Down C++, Education and Research, Escalation Engineering, FreeBSD Crash Corner, GDB for WinDbg Users, Hardware, Hyper-V, Java Debugging, Kernel Development, Laws of Troubleshooting and Debugging, Linux Crash Corner, Mac Crash Corner, Memory Analysis Forensics and Intelligence, Memory Visualization, Minidump Analysis, Multithreading, Security, Software Architecture, Software Defect Construction, Software Engineering, Software Generalist, Software Maintenance Institute, Software Narratology, Software Technical Support, Software Trace Analysis, Software Trace Visualization, Software Tracing for Dummies, Software Victimology, Stack Trace Collection, Testing, Tools, Trace Analysis Patterns, Training and Seminars, Troubleshooting Methodology, Victimware, Virtualization, Vista, Visual Dump Analysis, WinDbg Scripts, WinDbg Tips and Tricks, WinDbg for GDB Users, Windows 7, Windows Server 2008, Windows System Administration, Workaround Patterns | No Comments »
Monday, April 5th, 2010
I’m very pleased to announce that the Korean edition is available:

The book can be found on:
- Dmitry Vostokov @ DumpAnalysis.org + TraceAnalysis.org -
Posted in Announcements, AntiPatterns, Assembly Language, Books, Books (Korean), C and C++, Computer Science, Crash Dump Analysis, Crash Dump Patterns, Crash Dumps for Dummies, Debugging, Dr. Watson, Escalation Engineering, Fun with Crash Dumps, GDB for WinDbg Users, Hardware, Kernel Development, Mathematics of Debugging, Memiotics (Memory Semiotics), Memoretics, Memory Space Music, Memory Visualization, Minidump Analysis, Multithreading, Publishing, Science of Memory Dump Analysis, Security, Software Architecture, Software Engineering, Software Technical Support, Testing, Tools, Troubleshooting Methodology, Virtualization, Vista, WinDbg Scripts, WinDbg Tips and Tricks, WinDbg for GDB Users, Windows Server 2008, Windows System Administration | No Comments »
Thursday, February 11th, 2010
This is a revised, edited, cross-referenced and thematically organized volume of selected DumpAnalysis.org blog posts about crash dump analysis and debugging written in July 2009 - January 2010 for software engineers developing and maintaining products on Windows platforms, quality assurance engineers testing software on Windows platforms and technical support and escalation engineers dealing with complex software issues. The fourth volume features:
- 13 new crash dump analysis patterns
- 13 new pattern interaction case studies
- 10 new trace analysis patterns
- 6 new Debugware patterns and case study
- Workaround patterns
- Updated checklist
- Fully cross-referenced with Volume 1, Volume 2 and Volume 3
- New appendixes
Product information:
- Title: Memory Dump Analysis Anthology, Volume 4
- Author: Dmitry Vostokov
- Language: English
- Product Dimensions: 22.86 x 15.24
- Paperback: 410 pages
- Publisher: Opentask (30 March 2010)
- ISBN-13: 978-1-906717-86-5
- Hardcover: 410 pages
- Publisher: Opentask (30 April 2010)
- ISBN-13: 978-1-906717-87-2

Back cover features memory space art image: Internal Process Combustion.
- Dmitry Vostokov @ DumpAnalysis.org + TraceAnalysis.org -
Posted in .NET Debugging, Aesthetics of Memory Dumps, Announcements, AntiPatterns, Art, Assembly Language, Books, C and C++, CDA Pattern Classification, CDF Analysis Tips and Tricks, Categorical Debugging, Certification, Citrix, Code Reading, Common Mistakes, Computer Science, Countefactual Debugging, Crash Analysis Report Environment (CARE), Crash Dump Analysis, Crash Dump Patterns, Crash Dumps for Dummies, DebugWare Patterns, Debugging, Debugging Slang, Education and Research, Escalation Engineering, Fun with Crash Dumps, Games for Debugging, Hardware, Horrors of Computation, Hyper-V, Kernel Development, Laws of Troubleshooting and Debugging, Mathematics of Debugging, Memiotics (Memory Semiotics), Memoidealism, Memoretics, Memory Analysis Culture, Memory Analysis Forensics and Intelligence, Memory Dreams, Memory Dump Analysis Jobs, Memory Dumps in Movies, Memory Space Art, Memory Visualization, Memuonics, Minidump Analysis, Multithreading, Music for Debugging, New Acronyms, New Words, Opcodism, Philosophy, Physicalist Art, Publishing, Science Fiction, Science of Memory Dump Analysis, Science of Software Tracing, Security, Software Architecture, Software Defect Construction, Software Engineering, Software Generalist, Software Maintenance Institute, Software Narratology, Software Technical Support, Software Trace Analysis, Software Trace Visualization, Software Tracing for Dummies, Software Victimology, Stack Trace Collection, Testing, Tools, Trace Analysis Patterns, Training and Seminars, Troubleshooting Methodology, Victimware, Virtualization, Vista, Visual Dump Analysis, WinDbg Scripts, WinDbg Tips and Tricks, WinDbg for GDB Users, Windows 7, Windows Server 2008, Windows System Administration, Workaround Patterns | No Comments »
Sunday, December 20th, 2009
“Memory dumps are facts.”
I’m very excited to announce that Volume 3 is available in paperback, hardcover and digital editions:
Memory Dump Analysis Anthology, Volume 3
Table of Contents
In two weeks paperback edition should also appear on Amazon and other bookstores. Amazon hardcover edition is planned to be available in January 2010.
The amount of information was so voluminous that I had to split the originally planned volume into two. Volume 4 should appear by the middle of February together with Color Supplement for Volumes 1-4.
- Dmitry Vostokov @ DumpAnalysis.org -
Posted in .NET Debugging, Aesthetics of Memory Dumps, Announcements, AntiPatterns, Art, Assembly Language, Books, Bugtations, C and C++, CDA Pattern Classification, CDF Analysis Tips and Tricks, Certification, Citrix, Code Reading, Common Mistakes, Computer Science, Crash Dump Analysis, Crash Dump Patterns, Crash Dumps for Dummies, DebugWare Patterns, Debugging, Debugging Slang, Deep Down C++, Education and Research, Escalation Engineering, Fun with Crash Dumps, Hardware, Horrors of Computation, Kernel Development, Mathematics of Debugging, Memiotics (Memory Semiotics), Memoidealism, Memoretics, Memory Analysis Culture, Memory Analysis Forensics and Intelligence, Memory Space Art, Memory Visualization, Minidump Analysis, Multithreading, Philosophy, Poetry, Publishing, Science of Memory Dump Analysis, Science of Software Tracing, Security, Software Architecture, Software Defect Construction, Software Engineering, Software Narratology, Software Technical Support, Software Trace Analysis, Software Trace Visualization, Software Tracing for Dummies, Software Victimology, Stack Trace Collection, Testing, Tools, Trace Analysis Patterns, Training and Seminars, Troubleshooting Methodology, Victimware, Virtualization, Vista, Visual Dump Analysis, WinDbg Scripts, WinDbg Tips and Tricks, WinDbg for GDB Users, Windows 7, Windows Server 2008, Windows System Administration | 1 Comment »
Saturday, September 26th, 2009
This is a revised, edited, cross-referenced and thematically organized volume of selected DumpAnalysis.org blog posts about crash dump analysis and debugging written in October 2008 - June 2009 for software engineers developing and maintaining products on Windows platforms, quality assurance engineers testing software on Windows platforms and technical support and escalation engineers dealing with complex software issues. The third volume features:
- 15 new crash dump analysis patterns
- 29 new pattern interaction case studies
- Trace analysis patterns
- Updated checklist
- Fully cross-referenced with Volume 1 and Volume 2
- New appendixes
Product information:
- Title: Memory Dump Analysis Anthology, Volume 3
- Author: Dmitry Vostokov
- Language: English
- Product Dimensions: 22.86 x 15.24
- Paperback: 404 pages
- Publisher: Opentask (20 December 2009)
- ISBN-13: 978-1-906717-43-8
- Hardcover: 404 pages
- Publisher: Opentask (30 January 2010)
- ISBN-13: 978-1-906717-44-5

Back cover features 3D computer memory visualization image.
- Dmitry Vostokov @ DumpAnalysis.org -
Posted in Announcements, AntiPatterns, Art, Assembly Language, Books, C and C++, CDF Analysis Tips and Tricks, Certification, Citrix, Code Reading, Common Mistakes, Computational Ghosts and Bug Hauntings, Computer Science, Countefactual Debugging, Crash Dump Analysis, Crash Dump Patterns, Crash Dumps for Dummies, DebugWare Patterns, Debugging, Debugging Slang, Deep Down C++, Education and Research, Escalation Engineering, Fun with Crash Dumps, Futuristic Memory Dump Analysis, Games for Debugging, Hardware, Horrors of Computation, Hyper-V, Intelligent Memory Movement, Kernel Development, Mathematics of Debugging, Memiotics (Memory Semiotics), Memoidealism, Memoretics, Memory Analysis Culture, Memory Analysis Forensics and Intelligence, Memory Dreams, Memory Dump Analysis Jobs, Memory Space Music, Memory Visualization, Memuonics, Minidump Analysis, Multithreading, Music for Debugging, New Acronyms, New Words, Occult Debugging, Philosophy, Poetry, Psi-computation, Publishing, Science of Memory Dump Analysis, Science of Software Tracing, Security, Software Architecture, Software Defect Construction, Software Engineering, Software Generalist, Software Narratology, Software Technical Support, Software Trace Analysis, Software Tracing for Dummies, Testing, Tools, Trace Analysis Patterns, Training and Seminars, Troubleshooting Methodology, Virtualization, Vista, Visual Dump Analysis, WinDbg Scripts, WinDbg Tips and Tricks, WinDbg for GDB Users, Windows 7, Windows Server 2008, Windows System Administration | No Comments »
Thursday, July 9th, 2009
Sometimes we follow the course of established troubleshooting or debugging methods without questioning them or not considering possible exceptions. For example, the usual advice to heap corruption signs in process memory dumps is to ask to enable full page heap. However page heap helps to catch buffer overwrites but not underwrites and heap can also be damaged by other means like double free, passing an invalid address or direct corruption of control structures via a dangling pointer. Therefore in some cases when we enable full page heap we get the same stack trace:
Normal:
0:030> kL 100

ChildEBP RetAddr

175af77c 7d620ec5 ntdll_7d600000!RtlpCoalesceFreeBlocks+0×231

175af864 7c34218a ntdll_7d600000!RtlFreeHeap+0×38e

175af8ac 67d6153d msvcr71!free+0xc3

175af950 67781d69 Component!OnData+0×504

175af96c 7da4d03d Component!DispatchRequest+0×99

175afc28 7da4d177 rpcrt4!DispatchToStubInCNoAvrf+0×38

175afc7c 7da4d812 rpcrt4!RPC_INTERFACE::DispatchToStubWorker+0×11f

175afca0 7da59a1c rpcrt4!RPC_INTERFACE::DispatchToStub+0xa3

175afcfc 7da4da21 rpcrt4!LRPC_SCALL::DealWithRequestMessage+0×421

175afd20 7da3db14 rpcrt4!LRPC_ADDRESS::DealWithLRPCRequest+0×127

175aff84 7da45eac rpcrt4!LRPC_ADDRESS::ReceiveLotsaCalls+0×430

175aff8c 7da45dd0 rpcrt4!RecvLotsaCallsWrapper+0xd

175affac 7da45e94 rpcrt4!BaseCachedThreadRoutine+0×9d

175affb8 7d4dfe37 rpcrt4!ThreadStartRoutine+0×1b

175affec 00000000 kernel32!BaseThreadStart+0×34
With full page heap enabled:
0:030> kL

ChildEBP RetAddr

6092f568 7d6822fa ntdll!RtlpDphIsNormalHeapBlock+0×1f

6092f598 7d68256c ntdll!RtlpDphNormalHeapFree+0×21

6092f5f0 7d685443 ntdll!RtlpDebugPageHeapFree+0×146

6092f658 7d65714a ntdll!RtlDebugFreeHeap+0×2c

6092f730 7d62c5c0 ntdll!RtlFreeHeapSlowly+0×37

6092f814 7c34218a ntdll!RtlFreeHeap+0×11a

6092f85c 67d6153d msvcr71!free+0xc3

6092f900 67781d69 Component!OnData+0×504

6092f91c 7da4d03d Component!DispatchRequest+0×99

6092fc10 7da7ec5e rpcrt4!DispatchToStubInCNoAvrf+0×38

6092fc28 7da4d177 rpcrt4!DispatchToStubInCAvrf+0×14

6092fc7c 7da4d812 rpcrt4!RPC_INTERFACE::DispatchToStubWorker+0×11f

6092fca0 7da59a1c rpcrt4!RPC_INTERFACE::DispatchToStub+0xa3

6092fcfc 7da4da21 rpcrt4!LRPC_SCALL::DealWithRequestMessage+0×421

6092fd20 7da3db14 rpcrt4!LRPC_ADDRESS::DealWithLRPCRequest+0×127

6092ff84 7da45eac rpcrt4!LRPC_ADDRESS::ReceiveLotsaCalls+0×430

6092ff8c 7da45dd0 rpcrt4!RecvLotsaCallsWrapper+0xd

6092ffac 7da45e94 rpcrt4!BaseCachedThreadRoutine+0×9d

6092ffb8 7d4dfe37 rpcrt4!ThreadStartRoutine+0×1b

6092ffec 00000000 kernel32!BaseThreadStart+0×34
We see that we get the same Component stack trace before calling free (shown in blue above) so we better search in a database of stack trace signatures before sending Habitual Reply to enable page heap. If there is a match in database then the course of future actions can be completely different: an immediate available hotfix or we find a similar problem that is already under investigation. The sooner we provide a relief to our customer the better.
- Dmitry Vostokov @ DumpAnalysis.org -
Posted in AntiPatterns, Crash Dump Analysis, Crash Dump Patterns | 5 Comments »
Tuesday, December 16th, 2008
Sometimes a memory dump is not useful because of missing memory space, hence the name of this anti-pattern: Missing Space. This usually happens for non-bugcheck type issues like CPU spikes, application or session hangs where user space analysis is needed. Here is an example of Spiking Thread pattern in a kernel memory dump where analysis cannot be done because threads were spiking mostly in user space not included in kernel memory dumps:
Loading Dump File [MEMORY.DMP]

Kernel Summary Dump File: Only kernel address space is available
1: kd> !running
System Processors 3 (affinity mask)

  Idle Processors 0
     Prcb      Current   Next

  0  ffdff120  88d14b40            ................

  1  f7737120  891dddb0            ................
1: kd> !thread 88d14b40

THREAD 88d14b40  Cid 02b0.5298  Teb: 7ff7b000 Win32Thread: 00000000 RUNNING on processor 0

IRP List:

    87e3ad50: (0006,0094) Flags: 00000900  Mdl: 00000000

    8a8485f8: (0006,0094) Flags: 00000900  Mdl: 00000000

Not impersonating

DeviceMap                 e1001878

Owning Process            8a9831a8       Image:         ApplicationA.exe

Wait Start TickCount      1282379        Ticks: 0

Context Switch Count      2950

UserTime                  00:00:15.109

KernelTime                00:00:00.125

Win32 Start Address 0×77c7b0f5

Start Address 0×77e617ec

Stack Init ae302000 Current ae301c38 Base ae302000 Limit ae2ff000 Call 0

Priority 11 BasePriority 10 PriorityDecrement 0

ChildEBP RetAddr  Args to Child

0269fd6c 00000000 00000000 00000000 00000000 0×77e61684
1: kd> !thread 891dddb0

THREAD 891dddb0  Cid 2de4.3f58  Teb: 7ffd8000 Win32Thread: bc487c18 RUNNING on processor 1

Not impersonating

DeviceMap                 e6aba8b0

Owning Process            88b50d88       Image:         ApplicationB.exe

Wait Start TickCount      1282379        Ticks: 0

Context Switch Count      46241                 LargeStack

UserTime                  00:00:35.296

KernelTime                00:00:06.656

Win32 Start Address 0×0b80e53c

Start Address 0×77e617ec

Stack Init b234c000 Current b234bd00 Base b234c000 Limit b2346000 Call 0

Priority 10 BasePriority 10 PriorityDecrement 0

ChildEBP RetAddr  Args to Child

b234bcc8 f65c0532 000000e2 00000000 00000000 nt!KeBugCheckEx+0×1b

b234bcf8 f65bfd2c 00866d40 bbf000c6 00000000 i8042prt!I8xProcessCrashDump+0×256

b234bd40 808395a5 8a107c28 8a866c88 0101000a i8042prt!I8042KeyboardInterruptService+0×225

b234bd40 432de484 8a107c28 8a866c88 0101000a nt!KiInterruptDispatch+0×49

WARNING: Frame IP not in any known module. Following frames may be wrong.

01bbf150 00000000 00000000 00000000 00000000 0×432de484
The solution here is to request either a complete memory dump or user dumps of identified processes. The former was requested already but the crash dump type in Control Panel was not checked before forcing the dump of the system via standard keyboard method. Therefore this is also an instance of Wrong Dump anti-pattern.
- Dmitry Vostokov @ DumpAnalysis.org -
Posted in AntiPatterns, Crash Dump Analysis, Crash Dump Patterns, Debugging | 1 Comment »
Thursday, October 16th, 2008
This one is called No Question and is summarized by the following dialog that I observed many times:
As an engineer proceeds with analysis of a problem a phone rings and an irritated customer (internal or external) asks “What is the answer?”, an engineer glancing over the problem description replies, “What is the question?”.
This immediately came to my mind when I found this famous dialog:
“As the poet Gertrude Stein lay on her deathbed, her partner, Alice B. Toklas, leaned over and whispered, ‘What is the answer, Gertrude?’. Replied Stein, ‘What’s the question?’”
- Dmitry Vostokov @ DumpAnalysis.org -
Posted in AntiPatterns, Crash Dump Analysis, Crash Dump Patterns, Debugging, Software Technical Support, Troubleshooting Methodology | No Comments »
Wednesday, July 9th, 2008
Often engineers spend 10 minutes pursuing a certain investigation path and then prematurely closing it and switching to another. This is what I call Myopic Troubleshooting and Debugging.
This anti-pattern name was inspired by Daniel Dennett’s discussion of insufficiently patient scientists doing computer simulations:
“mistaking a failure of imagination for an insight into necessity” (Darwin’s Dangerous Idea, page 175).
Paraphrasing we can say that engineers think of impossibility where their imagination fails.
- Dmitry Vostokov @ DumpAnalysis.org -
Posted in AntiPatterns, Crash Dump Analysis, Crash Dump Patterns, Debugging, Software Technical Support, Troubleshooting Methodology | No Comments »
Thursday, March 27th, 2008
Symbolless Analysis is another anti-pattern when an engineer either in a hurry or due to laziness doesn’t apply proper symbols and relies only on timestamps and module/offsets or trusts what WinDbg says and ignores symbol warnings. I usually apply symbols even in obvious cases and in hard ones strive to apply them until all possibilities are exhausted including search using PDBFinder.
Another weak variant is called Imageless Analysis when an engineer doesn’t specify proper Executable Image Search Path when it is necessary perhaps due to ignorance or just plain laziness again. Please see Minidump Analysis example for proper minidump analysis.
- Dmitry Vostokov @ DumpAnalysis.org -
Posted in AntiPatterns, Crash Dump Analysis, Crash Dump Patterns, Minidump Analysis, Software Technical Support | No Comments »
Thursday, January 10th, 2008
This is sometime very funny one. It is called Fooled by Abbreviation. When someone is so presupposed or engaged in identifying Alien Components due to limited time and complexity of issues. For example, “Ctx” abbreviation in function names will most likely mean “Context” in general but can also be a function and data structure prefix used by a company with a similar sounding name. Opposite cases happen too when general is presupposed instead of particular, for example, ”Mms” prefix is read as “Memory Management Subsystem” but belongs to a multimedia system vendor.
- Dmitry Vostokov @ DumpAnalysis.org -
Posted in AntiPatterns, Crash Dump Patterns, Software Technical Support | No Comments »
Monday, December 3rd, 2007
Be language - excessive use of “is”. This anti-pattern was inspired by Alfred Korzybski notion of how “is” affects our understanding of the world. In the context of technical support the use of certain verbs sometimes leads to wrong troubleshooting and debugging paths. For example, the following phrase:
It is our pool tag. It is effected by driver A, driver B and driver C.
Surely driver A, driver B and driver C were not developed by the same company that introduced the problem pool tag (smells Alien Component here). Unless supported by solid evidence the better phrase shall be:
It is our pool tag. It might have been effected by driver A, driver B or driver C.
I’m not advocating to completely eradicate “be” verbs as was done in E-Prime language but to be conscious in their use. Thanks to Simple*ology in pointing me to the right direction.
- Dmitry Vostokov @ DumpAnalysis.org -
Posted in AntiPatterns, Crash Dump Analysis, Crash Dump Patterns, Software Technical Support | No Comments »
Thursday, November 22nd, 2007
Need the crash dump. Period. This might be the first thought when an engineer gets a stack trace fragment without symbolic information. It is usually based on the following presupposition:
We need an actual dump file to suggest further troubleshooting steps.
This is not actually true unless it is the first time you have the problem and get stack trace for it. Consider the following fragment from bugcheck kernel dump when no symbols were applied because the customer didn’t have them:
b90529f8 8085eced nt!KeBugCheckEx+0x1b

b9052a70 8088c798 nt!MmAccessFault+0xb25

b9052a70 bfabd940 nt!_KiTrap0E+0xdc

WARNING: Stack unwind information not available. Following frames may be wrong.

b9052b14 bfabe452 MyDriver+0x27940
We can convert module+offset information into module!function+offset2 using MAP files or using DIA SDK (Debug Interface Access SDK) to query PDB files if we know module timestamp. This might be seen as a tedious exercise but we don’t need to do it if we keep raw stack trace signatures in some database when doing crash dump analysis. If we use our own symbol servers we might want to remove references to them and reload symbols. Then redo previous stack trace commands.
In my case it happened that I already analyzed similar previous bugcheck crash dumps months ago and saved stack trace prior to applying symbols. This helped me to point to solution without requesting the crash dump corresponding to that stack trace.
- Dmitry Vostokov @ DumpAnalysis.org -
Posted in AntiPatterns, Crash Dump Analysis, Crash Dump Patterns, Software Technical Support | No Comments »
