Icons for Memory Dump Analysis Patterns (Part 30)
Friday, April 30th, 2010Today we introduce an icon for Module Variety pattern:
B/W
![]()
Color
![]()
- Dmitry Vostokov @ DumpAnalysis.org + TraceAnalysis.org -
Today we introduce an icon for Module Variety pattern:
B/W
![]()
Color
![]()
- Dmitry Vostokov @ DumpAnalysis.org + TraceAnalysis.org -
Memory Dump Analysis Anthology lacks full color inserts. This is rather a current limitation of POD technology that OpenTask publisher uses at the present time. The solution previously announced a year ago is to print a separate full color title with selected articles and illustrations. Finally, it is about to be published next month. The book front and back covers are collages from covers of individual memory dump analysis volumes:
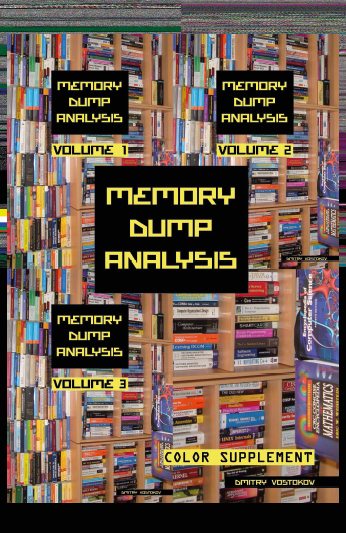
TOC will be available soon. Here is the book data:
OpenTask also plans a separate color supplement for volumes 4 and 5 once they are published.
- Dmitry Vostokov @ DumpAnalysis.org + TraceAnalysis.org -
Yesterday I discovered the blog j00ru//vx where I was pleased to see another memory visualization approach which I classify as synthetic:
x86 Kernel Memory Space Visualization (KernelMAP v0.0.1)
So far now I put a bit more extended (but in no way complete) classification with links (based on my previous blog post where every category is presented in chronological order of my encounter with links):
1. Synthetic
2. Natural
a. Static
b. Semi-dynamic
c. Dynamic
Please let me know any other approaches or links you know.
PS. I’m currently a big fan of artificial evolution and recommend this fantastic full-color book that has good ideas about expression-based visualization:
The Art of Artificial Evolution: A Handbook on Evolutionary Art and Music (Natural Computing Series)

- Dmitry Vostokov @ DumpAnalysis.org + TraceAnalysis.org -
Today we introduce an icon for Spiking Thread pattern:
B/W
![]()
Color
![]()
- Dmitry Vostokov @ DumpAnalysis.org + TraceAnalysis.org -
A print spooler service process was hanging and blocking print-related requests from other coupled processes. Default analysis of its dump doesn’t show any problem (it shows normal service main thread):
0:000> !analyze -v
EXCEPTION_RECORD:  ffffffff -- (.exr 0xffffffffffffffff)

ExceptionAddress: 00000000

   ExceptionCode: 80000003 (Break instruction exception)

  ExceptionFlags: 00000000

NumberParameters: 0
BUGCHECK_STR: APPLICATION_FAULT_STATUS_BREAKPOINT
STACK_TEXT:

0006fbcc 7c82776b 77e418b2 00000064 00000000 ntdll!KiFastSystemCallRet

0006fbd0 77e418b2 00000064 00000000 00000000 ntdll!NtReadFile+0xc

0006fc38 77f65edb 00000064 0006fd04 0000021a kernel32!ReadFile+0x16c

0006fc64 77f65f82 00000064 0006fd04 0000021a advapi32!ScGetPipeInput+0x2a

0006fcd8 77f51ed9 00000064 0006fd04 0000021a advapi32!ScDispatcherLoop+0x51

0006ff3c 01004019 0100d5bc 010047a2 00000001 advapi32!StartServiceCtrlDispatcherW+0xe3

0006ff44 010047a2 00000001 00263fa0 00262be0 spoolsv!main+0xb

0006ffc0 77e6f23b 00000000 00000000 7ffd7000 spoolsv!mainCRTStartup+0x12f

0006fff0 00000000 0100468c 00000000 78746341 kernel32!BaseProcessStart+0x23
0:000> !analyze -v -hang
EXCEPTION_RECORD:  ffffffff -- (.exr 0xffffffffffffffff)

ExceptionAddress: 00000000

   ExceptionCode: 80000003 (Break instruction exception)

  ExceptionFlags: 00000000

NumberParameters: 0
BUGCHECK_STR: HANG
STACK_TEXT:

0006fbcc 7c82776b 77e418b2 00000064 00000000 ntdll!KiFastSystemCallRet

0006fbd0 77e418b2 00000064 00000000 00000000 ntdll!NtReadFile+0xc

0006fc38 77f65edb 00000064 0006fd04 0000021a kernel32!ReadFile+0x16c

0006fc64 77f65f82 00000064 0006fd04 0000021a advapi32!ScGetPipeInput+0x2a

0006fcd8 77f51ed9 00000064 0006fd04 0000021a advapi32!ScDispatcherLoop+0x51

0006ff3c 01004019 0100d5bc 010047a2 00000001 advapi32!StartServiceCtrlDispatcherW+0xe3

0006ff44 010047a2 00000001 00263fa0 00262be0 spoolsv!main+0xb

0006ffc0 77e6f23b 00000000 00000000 7ffd7000 spoolsv!mainCRTStartup+0x12f

0006fff0 00000000 0100468c 00000000 78746341 kernel32!BaseProcessStart+0x23
Stack trace collection shows several threads waiting for a critical section when allocating heap blocks or calling loader functions, for example:
0:000> ~*k
[...]
  20  Id: 540.71d0 Suspend: 1 Teb: 7ffa2000 Unfrozen

ChildEBP RetAddr

0597fa20 7c827d0b ntdll!KiFastSystemCallRet

0597fa24 7c83d236 ntdll!NtWaitForSingleObject+0xc

0597fa60 7c83d281 ntdll!RtlpWaitOnCriticalSection+0×1a3

0597fa80 7c82a264 ntdll!RtlEnterCriticalSection+0xa8

0597fca8 77c7e5cf ntdll!RtlAllocateHeap+0×313

0597fcbc 77c7e5a6 rpcrt4!AllocWrapper+0×1e

0597fcc8 77c82069 rpcrt4!operator new+0xd

0597fdf4 77c812a5 rpcrt4!LRPC_SCALL::LrpcMessageToRpcMessage+0xd0

0597fe20 77c88678 rpcrt4!LRPC_ADDRESS::DealWithLRPCRequest+0×66

0597ff84 77c88792 rpcrt4!LRPC_ADDRESS::ReceiveLotsaCalls+0×430

0597ff8c 77c8872d rpcrt4!RecvLotsaCallsWrapper+0xd

0597ffac 77c7b110 rpcrt4!BaseCachedThreadRoutine+0×9d

0597ffb8 77e64829 rpcrt4!ThreadStartRoutine+0×1b

0597ffec 00000000 kernel32!BaseThreadStart+0×34
  21  Id: 540.5b3c Suspend: 1 Teb: 7ff9f000 Unfrozen

ChildEBP RetAddr

090dfea0 7c827d0b ntdll!KiFastSystemCallRet

090dfea4 7c83d236 ntdll!NtWaitForSingleObject+0xc

090dfee0 7c83d281 ntdll!RtlpWaitOnCriticalSection+0×1a3

090dff00 7c81909b ntdll!RtlEnterCriticalSection+0xa8

090dffa8 77e4f920 ntdll!LdrShutdownThread+0×33

090dffb8 77e6482e kernel32!ExitThread+0×2f

090dffec 00000000 kernel32!BaseThreadStart+0×39
[...]
!cs command shows wait chains and signs of critical section corruption. Here is the commented output:
0:000> !cs -l -o -s

-----------------------------------------

DebugInfo          = 0x7c8877c0

Critical section   = 0×7c8877a0 (ntdll!LdrpLoaderLock+0×0)

LOCKED

LockCount          = 0×5

WaiterWoken        = No

OwningThread       = 0×00005a20

RecursionCount     = 0×1

LockSemaphore      = 0×184

SpinCount          = 0×00000000

OwningThread DbgId = ~25s

OwningThread Stack =

 ChildEBP RetAddr  Args to Child

 0568f42c 7c827d0b 7c83d236 00000da0 00000000 ntdll!KiFastSystemCallRet

 0568f430 7c83d236 00000da0 00000000 00000000 ntdll!NtWaitForSingleObject+0xc

 0568f46c 7c83d281 00000da0 00000004 00080000 ntdll!RtlpWaitOnCriticalSection+0×1a3

 0568f48c 7c82a264 00080608 7c82e6b4 0000008e ntdll!RtlEnterCriticalSection+0xa8

 0568f6b4 77e6427d 00080000 00000000 00000594 ntdll!RtlAllocateHeap+0×313

 0568f718 77e643a2 77e643d0 00020abc 00000000 kernel32!BasepComputeProcessPath+0xc2

 0568f758 77e65348 00000000 00000000 00000000 kernel32!BaseComputeProcessDllPath+0xe3

 0568f79c 77e6528f 0568f7b8 00000000 4dc5822c kernel32!GetModuleHandleForUnicodeString+0×2b

 0568fc14 77e65155 00000001 00000002 0568fc38 kernel32!BasepGetModuleHandleExW+0×17f

 0568fc2c 4dc4d554 0568fc38 003a0043 0057005c kernel32!GetModuleHandleW+0×29

 0568fe4c 4dc49a0a 4dc32328 00000001 0568fe80 MSCTFIME!GetSystemModuleHandleW+0×40

 0568fe5c 4dc49bc3 4dc5822c 4dc32328 4dc32380 MSCTFIME!GetFn+0×2e

 0568fe74 4dc49039 00000003 0568fea0 4dc49fbb MSCTFIME!TF_DllDetachInOther+0×2a

 0568fe80 4dc49fbb 4dc30000 00000003 00000000 MSCTFIME!DllMain+0×1d

 0568fea0 7c81a352 4dc30000 00000003 00000000 MSCTFIME!_DllMainCRTStartup+0×52

 0568fec0 7c819178 4dc49f69 4dc30000 00000003 ntdll!LdrpCallInitRoutine+0×14

 0568ff74 77e4f920 3533e0ec 00000000 0568ff98 ntdll!LdrShutdownThread+0xd2

 0568ff84 77e52868 00000000 3533e0ec 77e5bf51 kernel32!ExitThread+0×2f

 0568ff98 3530cd31 35100000 00000000 00000000 kernel32!FreeLibraryAndExitThread+0×40

WARNING: Stack unwind information not available. Following frames may be wrong.

 0568ffb8 77e64829 00001430 00000000 00000000 PrintDriverA!DllGetClassObject+0×1dcdb1

ntdll!RtlpStackTraceDataBase is NULL. Probably the stack traces are not enabled.
The thread #25 is blocked waiting for the critical section 00080608 but it also owns another critical section LdrpLoaderLock and blocks 5 other threads. Stack trace features PrintDriverA module.
-----------------------------------------

DebugInfo          = 0x7c887be0

Critical section   = 0×7c887740 (ntdll!FastPebLock+0×0)

LOCKED

LockCount          = 0×0

WaiterWoken        = No

OwningThread       = 0×00005a20

RecursionCount     = 0×1

LockSemaphore      = 0×868

SpinCount          = 0×00000000

OwningThread DbgId = ~25s

OwningThread Stack =

 ChildEBP RetAddr  Args to Child

 0568f42c 7c827d0b 7c83d236 00000da0 00000000 ntdll!KiFastSystemCallRet

 0568f430 7c83d236 00000da0 00000000 00000000 ntdll!NtWaitForSingleObject+0xc

 0568f46c 7c83d281 00000da0 00000004 00080000 ntdll!RtlpWaitOnCriticalSection+0×1a3

 0568f48c 7c82a264 00080608 7c82e6b4 0000008e ntdll!RtlEnterCriticalSection+0xa8

 0568f6b4 77e6427d 00080000 00000000 00000594 ntdll!RtlAllocateHeap+0×313

 0568f718 77e643a2 77e643d0 00020abc 00000000 kernel32!BasepComputeProcessPath+0xc2

 0568f758 77e65348 00000000 00000000 00000000 kernel32!BaseComputeProcessDllPath+0xe3

 0568f79c 77e6528f 0568f7b8 00000000 4dc5822c kernel32!GetModuleHandleForUnicodeString+0×2b

 0568fc14 77e65155 00000001 00000002 0568fc38 kernel32!BasepGetModuleHandleExW+0×17f

 0568fc2c 4dc4d554 0568fc38 003a0043 0057005c kernel32!GetModuleHandleW+0×29

 0568fe4c 4dc49a0a 4dc32328 00000001 0568fe80 MSCTFIME!GetSystemModuleHandleW+0×40

 0568fe5c 4dc49bc3 4dc5822c 4dc32328 4dc32380 MSCTFIME!GetFn+0×2e

 0568fe74 4dc49039 00000003 0568fea0 4dc49fbb MSCTFIME!TF_DllDetachInOther+0×2a

 0568fe80 4dc49fbb 4dc30000 00000003 00000000 MSCTFIME!DllMain+0×1d

 0568fea0 7c81a352 4dc30000 00000003 00000000 MSCTFIME!_DllMainCRTStartup+0×52

 0568fec0 7c819178 4dc49f69 4dc30000 00000003 ntdll!LdrpCallInitRoutine+0×14

 0568ff74 77e4f920 3533e0ec 00000000 0568ff98 ntdll!LdrShutdownThread+0xd2

 0568ff84 77e52868 00000000 3533e0ec 77e5bf51 kernel32!ExitThread+0×2f

 0568ff98 3530cd31 35100000 00000000 00000000 kernel32!FreeLibraryAndExitThread+0×40

WARNING: Stack unwind information not available. Following frames may be wrong.

 0568ffb8 77e64829 00001430 00000000 00000000 PrintDriverA!DllGetClassObject+0×1dcdb1

ntdll!RtlpStackTraceDataBase is NULL. Probably the stack traces are not enabled.
This is the same thread #25 but it also owns another critical section FastPebLock but this doesn’t block additional threads.
-----------------------------------------

DebugInfo          = 0x7c887c80

Critical section   = 0×00080608 (+0×80608)

LOCKED

LockCount          = 0×4

WaiterWoken        = No

OwningThread       = 0×0000a8c4

RecursionCount     = 0×1

LockSemaphore      = 0xDA0

SpinCount          = 0×00000fa0

OwningThread DbgId = ~22s

OwningThread Stack =

 ChildEBP RetAddr  Args to Child

 03456830 7739bf53 7739610a 00000000 00000000 ntdll!KiFastSystemCallRet

 03456868 7738965e 186403ba 00000000 00000001 user32!NtUserWaitMessage+0xc

 03456890 7739f762 77380000 05bdc880 00000000 user32!InternalDialogBox+0xd0

 03456b50 7739f047 03456cac 00000000 ffffffff user32!SoftModalMessageBox+0×94b

 03456ca0 7739eec9 03456cac 00000028 00000000 user32!MessageBoxWorker+0×2ba

 03456cf8 773d7d0d 00000000 0ae7cc20 02639ea8 user32!MessageBoxTimeoutW+0×7a

 03456d80 773c42c8 00000000 03456e14 03456df4 user32!MessageBoxTimeoutA+0×9c

 03456da0 773c42a4 00000000 03456e14 03456df4 user32!MessageBoxExA+0×1b

 03456dbc 6dfcf8c2 00000000 03456e14 03456df4 user32!MessageBoxA+0×45

 034575f8 6dfd05cf 03456e5a 03457624 77bc6cd5 compstui!FilterException+0×174

 03458584 6dfcff1e 02638dc8 00000000 03458c58 compstui!CallpfnPSUI+0×110

 034587f0 6dfd00a2 02638b40 026393f8 00000000 compstui!InsertPSUIPage+0×201

 03458848 7307c9ae 43440001 00000005 02118690 compstui!CPSUICallBack+0xed

 03458870 6dfd059a 0345888c 03458c58 7307c8da winspool!DevicePropertySheets+0xd4

 034588d4 6dfcff1e 026393f8 00000000 03458c58 compstui!CallpfnPSUI+0xdb

 03458b40 6dfd00a2 02638b40 02638b40 00000000 compstui!InsertPSUIPage+0×201

 03458b98 6dfd06a3 43440000 00000005 7307c8da compstui!CPSUICallBack+0xed

 03458bcc 6dfd0799 00000000 7307c8da 03458c58 compstui!DoCommonPropertySheetUI+0×74

 03458be4 730801c5 00000000 7307c8da 03458c58 compstui!CommonPropertySheetUIW+0×17

ntdll!RtlpStackTraceDataBase is NULL. Probably the stack traces are not enabled.
The thread #22 is blocked waiting for the message box but it also owns the critical section 00080608 we have seen above and the thread blocks 4 other threads.
Cannot read structure field value at 0x04ddbb64, error 0

Cannot determine if the critical section is locked or not.

-----------------------------------------

Critical section   = 0x04ddbb60 (+0x4DDBB60)

DebugInfo          = 0x01e10858

ntdll!RtlpStackTraceDataBase is NULL. Probably the stack traces are not enabled.

-----------------------------------------

DebugInfo          = 0x05b24d38

Critical section   = 0x0589de08 (PrintDriverB+0×49DE8)

LOCKED

LockCount          = 0xC5D3FFF

WaiterWoken        = Yes

OwningThread       = 0×00008487

RecursionCount     = 0×8DD5FF50

LockSemaphore      = 0×50CE8B00

SpinCount          = 0×878dd5ff
WARNING: critical section DebugInfo = 0x0080878d doesn't point back

to the DebugInfo found in the active critical sections list = 0x05b24d38.

The critical section was probably reused without calling DeleteCriticalSection.
ntdll!RtlpStackTraceDataBase is NULL. Probably the stack traces are not enabled.

ntdll!RtlpStackTraceDataBase is NULL. Probably the stack traces are not enabled.

-----------------------------------------

DebugInfo          = 0x05b24c98

Critical section   = 0x0589ddd8 (PrintDriverB+0x49DB8)

LOCKED

LockCount          = 0x1D38F6EE

WaiterWoken        = Yes

OwningThread       = 0x1c2444db

RecursionCount     = 0xD3FF50CE

LockSemaphore      = 0x8D04EC83

SpinCount          = 0x1cd9744f
WARNING: critical section DebugInfo = 0x8dffff73 doesn't point back

to the DebugInfo found in the active critical sections list = 0x05b24c98.

The critical section was probably reused without calling DeleteCriticalSection.
Cannot read structure field value at 0x8dffff75, error 0

ntdll!RtlpStackTraceDataBase is NULL. Probably the stack traces are not enabled.

ntdll!RtlpStackTraceDataBase is NULL. Probably the stack traces are not enabled.

-----------------------------------------

DebugInfo          = 0x05b24f40

Critical section   = 0x0589de28 (PrintDriverB+0x49E08)

LOCKED

LockCount          = 0x1D38F6EE

WaiterWoken        = Yes

OwningThread       = 0x1c2444db

RecursionCount     = 0xD3FF50CE

LockSemaphore      = 0x8D04EC83

SpinCount          = 0x00008c8f
WARNING: critical section DebugInfo = 0x8d242454 doesn't point back

to the DebugInfo found in the active critical sections list = 0x05b24f40.

The critical section was probably reused without calling DeleteCriticalSection.
Cannot read structure field value at 0x8d242456, error 0

ntdll!RtlpStackTraceDataBase is NULL. Probably the stack traces are not enabled.

ntdll!RtlpStackTraceDataBase is NULL. Probably the stack traces are not enabled.

-----------------------------------------

DebugInfo          = 0x05b24d10

Critical section   = 0x0589de08 (PrintDriverB+0x49DE8)

LOCKED

LockCount          = 0xC5D3FFF

WaiterWoken        = Yes

OwningThread       = 0x00008487

RecursionCount     = 0x8DD5FF50

LockSemaphore      = 0x50CE8B00

SpinCount          = 0x878dd5ff
WARNING: critical section DebugInfo = 0x0080878d doesn't point back

to the DebugInfo found in the active critical sections list = 0x05b24d10.

The critical section was probably reused without calling DeleteCriticalSection.
ntdll!RtlpStackTraceDataBase is NULL. Probably the stack traces are not enabled.

ntdll!RtlpStackTraceDataBase is NULL. Probably the stack traces are not enabled.

-----------------------------------------

DebugInfo          = 0x05b24ec8

Critical section   = 0x0589de28 (PrintDriverB+0x49E08)

LOCKED

LockCount          = 0x1D38F6EE

WaiterWoken        = Yes

OwningThread       = 0x1c2444db

RecursionCount     = 0xD3FF50CE

LockSemaphore      = 0x8D04EC83

SpinCount          = 0x00008c8f
WARNING: critical section DebugInfo = 0x8d242454 doesn't point back

to the DebugInfo found in the active critical sections list = 0x05b24ec8.

The critical section was probably reused without calling DeleteCriticalSection.
Cannot read structure field value at 0x8d242456, error 0

ntdll!RtlpStackTraceDataBase is NULL. Probably the stack traces are not enabled.

ntdll!RtlpStackTraceDataBase is NULL. Probably the stack traces are not enabled.

-----------------------------------------

DebugInfo          = 0x05b24cc0

Critical section   = 0x0589ddd8 (PrintDriverB+0x49DB8)

LOCKED

LockCount          = 0x1D38F6EE

WaiterWoken        = Yes

OwningThread       = 0x1c2444db

RecursionCount     = 0xD3FF50CE

LockSemaphore      = 0x8D04EC83

SpinCount          = 0x1cd9744f
WARNING: critical section DebugInfo = 0x8dffff73 doesn't point back

to the DebugInfo found in the active critical sections list = 0x05b24cc0.

The critical section was probably reused without calling DeleteCriticalSection.
Cannot read structure field value at 0x8dffff75, error 0

ntdll!RtlpStackTraceDataBase is NULL. Probably the stack traces are not enabled.

ntdll!RtlpStackTraceDataBase is NULL. Probably the stack traces are not enabled.
Here we see the recurrence of PrintDriverB module in the output that looks like corruption. Because the thread #22 heads the wait chain we look at its full stack trace:
0:000> ~22s; kL 100

eax=00465758 ebx=00000000 ecx=00467514 edx=00000001 esi=00467500 edi=00000000

eip=7c8285ec esp=03456834 ebp=03456868 iopl=0         nv up ei pl zr na pe nc

cs=001b  ss=0023  ds=0023  es=0023  fs=003b  gs=0000             efl=00000246

ntdll!KiFastSystemCallRet:

7c8285ec c3              ret

ChildEBP RetAddr

03456830 7739bf53 ntdll!KiFastSystemCallRet

03456868 7738965e user32!NtUserWaitMessage+0xc

03456890 7739f762 user32!InternalDialogBox+0xd0

03456b50 7739f047 user32!SoftModalMessageBox+0x94b

03456ca0 7739eec9 user32!MessageBoxWorker+0x2ba

03456cf8 773d7d0d user32!MessageBoxTimeoutW+0x7a

03456d80 773c42c8 user32!MessageBoxTimeoutA+0x9c

03456da0 773c42a4 user32!MessageBoxExA+0x1b

03456dbc 6dfcf8c2 user32!MessageBoxA+0×45

034575f8 6dfd05cf compstui!FilterException+0×174

03458584 6dfcff1e compstui!CallpfnPSUI+0×110

034587f0 6dfd00a2 compstui!InsertPSUIPage+0×201

03458848 7307c9ae compstui!CPSUICallBack+0xed

03458870 6dfd059a winspool!DevicePropertySheets+0xd4

034588d4 6dfcff1e compstui!CallpfnPSUI+0xdb

03458b40 6dfd00a2 compstui!InsertPSUIPage+0×201

03458b98 6dfd06a3 compstui!CPSUICallBack+0xed

03458bcc 6dfd0799 compstui!DoCommonPropertySheetUI+0×74

03458be4 730801c5 compstui!CommonPropertySheetUIW+0×17

03458c2c 73080f5d winspool!CallCommonPropertySheetUI+0×43

03459074 35145947 winspool!PrinterPropertiesNative+0×10c

034590c4 3513a045 PrintDriverA!DllGetClassObject+0×159c7

0345e9ac 35131819 PrintDriverA!DllGetClassObject+0xa0c5

0345ebdc 32020661 PrintDriverA!DllGetClassObject+0×1899

0345ec04 3201b171 PS5UI!HComOEMPrinterEvent+0×33

0345ec48 02117a79 PS5UI!DrvPrinterEvent+0×239

0345eea4 7308218c PrintDriverA!DrvPrinterEvent+0xf9

0345eef0 761542cc winspool!SpoolerPrinterEventNative+0×57

0345ef0c 76155fd6 localspl!SplDriverEvent+0×21

0345ef30 76144799 localspl!PrinterDriverEvent+0×46

0345f3f8 76144ab2 localspl!SplAddPrinter+0×5f3

0345f424 74070193 localspl!LocalAddPrinterEx+0×2e

0345f874 7407025c spoolss!AddPrinterExW+0×151

0345f890 0100792d spoolss!AddPrinterW+0×17

0345f8ac 01006762 spoolsv!YAddPrinter+0×75

0345f8d0 77c80193 spoolsv!RpcAddPrinter+0×37

0345f8f8 77ce33e1 rpcrt4!Invoke+0×30

0345fcf8 77ce35c4 rpcrt4!NdrStubCall2+0×299

0345fd14 77c7ff7a rpcrt4!NdrServerCall2+0×19

0345fd48 77c8042d rpcrt4!DispatchToStubInCNoAvrf+0×38

0345fd9c 77c80353 rpcrt4!RPC_INTERFACE::DispatchToStubWorker+0×11f

0345fdc0 77c811dc rpcrt4!RPC_INTERFACE::DispatchToStub+0xa3

0345fdfc 77c812f0 rpcrt4!LRPC_SCALL::DealWithRequestMessage+0×42c

0345fe20 77c88678 rpcrt4!LRPC_ADDRESS::DealWithLRPCRequest+0×127

0345ff84 77c88792 rpcrt4!LRPC_ADDRESS::ReceiveLotsaCalls+0×430

0345ff8c 77c8872d rpcrt4!RecvLotsaCallsWrapper+0xd

0345ffac 77c7b110 rpcrt4!BaseCachedThreadRoutine+0×9d

0345ffb8 77e64829 rpcrt4!ThreadStartRoutine+0×1b

0345ffec 00000000 kernel32!BaseThreadStart+0×34
There is PrintDriverA module on the stack trace. Notice that we also have FilterException function on the stack trace. It raises the suspicion bar. We proceed to examining MessageBoxA parameters:
0:022> kv 100

ChildEBP RetAddr  Args to Child

03456830 7739bf53 7739610a 00000000 00000000 ntdll!KiFastSystemCallRet

03456868 7738965e 186403ba 00000000 00000001 user32!NtUserWaitMessage+0xc

03456890 7739f762 77380000 05bdc880 00000000 user32!InternalDialogBox+0xd0

03456b50 7739f047 03456cac 00000000 ffffffff user32!SoftModalMessageBox+0x94b

03456ca0 7739eec9 03456cac 00000028 00000000 user32!MessageBoxWorker+0x2ba

03456cf8 773d7d0d 00000000 0ae7cc20 02639ea8 user32!MessageBoxTimeoutW+0x7a

03456d80 773c42c8 00000000 03456e14 03456df4 user32!MessageBoxTimeoutA+0x9c

03456da0 773c42a4 00000000 03456e14 03456df4 user32!MessageBoxExA+0x1b

03456dbc 6dfcf8c2 00000000 03456e14 03456df4 user32!MessageBoxA+0×45

034575f8 6dfd05cf 03456e5a 03457624 77bc6cd5 compstui!FilterException+0×174

[…]
0:022> da /c 90 03456e14

03456e14  “Function address 0×7c8100ca caused a protection fault. (exception code 0xc0000005). Some or all property page(s) may not be displayed.”
There was an exception indeed diagnosed by FilterException call. The exception is probably hidden somewhere on the raw stack:
0:022> !teb

TEB at 7ffde000

    ExceptionList:        03456d40

    StackBase:            03460000

    StackLimit:           03450000

    SubSystemTib:         00000000

    FiberData:            00001e00

    ArbitraryUserPointer: 00000000

    Self:                 7ffde000

    EnvironmentPointer:   00000000

    ClientId:             00000540 . 0000a8c4

    RpcHandle:            00000000

    Tls Storage:          00000000

    PEB Address:          7ffd7000

    LastErrorValue:       0

    LastStatusValue:      c0000022

    Count Owned Locks:    0

    HardErrorMode:        0
0:022> dds 03450000 03460000

03450000  00000000

03450004  00000000

03450008  00000000

0345000c  00000000

[...]

03457674  03458574

03457678  7c8315c2 ntdll!RtlDispatchException+0×91

0345767c  03457710

03457680  03458574

03457684  0345772c

03457688  034576ec

0345768c  6dfd0a54 compstui!_except_handler3

03457690  00080000

03457694  03457710

03457698  0269b640

0345769c  026afc38

034576a0  00080000

034576a4  00080000

034576a8  026afc38

034576ac  026b2008

034576b0  034576cc

034576b4  7c82a771 ntdll!RtlpCoalesceFreeBlocks+0×383

034576b8  00000249

034576bc  026b2008

034576c0  00080000

034576c4  026afc38

034576c8  00080000

034576cc  00000000

034576d0  00080000

034576d4  034577b4

034576d8  7c82a90a ntdll!RtlFreeHeap+0×6b0

034576dc  00080608

034576e0  7c829f59 ntdll!RtlFreeHeap+0×70f

034576e4  03457870

034576e8  00000000

034576ec  00000001

034576f0  03460000

034576f4  006afc38

034576f8  03457c14

034576fc  7c82855e ntdll!KiUserExceptionDispatcher+0xe

03457700  03450000

03457704  0345772c

03457708  03457710

0345770c  0345772c

03457710  c0000005

03457714  00000000

03457718  00000000

0345771c  7c8100ca ntdll!RtlAllocateHeap+0×7b3

03457720  00000002

03457724  00000001

03457728  026c663c

0345772c  0001003f

03457730  00000000

03457734  00000000

03457738  00000000

0345773c  00000000

03457740  00000000

03457744  00000000

03457748  ffff027f

0345774c  ffff0000

[…]
It finally looks like a heap corruption:
0:022> .cxr 0345772c

eax=00000b28 ebx=00005e69 ecx=026c663c edx=0269b648 esi=0269b640 edi=00080000

eip=7c8100ca esp=034579f8 ebp=03457c14 iopl=0 nv up ei pl nz ac pe nc

cs=001b ss=0023 ds=0023 es=0023 fs=003b gs=0000 efl=00010216

ntdll!RtlAllocateHeap+0×7b3:

7c8100ca 8901  mov     dword ptr [ecx],eax  ds:0023:026c663c=????????
0:022> kL 100

ChildEBP RetAddr

03457c14 77c0b66f ntdll!RtlAllocateHeap+0×7b3

03457c44 77c1581a gdi32!EnumFontsInternalW+0×63

03457c68 32014246 gdi32!EnumFontFamiliesW+0×1c

03457ce4 32019ab4 PS5UI!BPackItemFontSubstTable+0×95

03457cf4 32014a0f PS5UI!BPackPrinterPropertyItems+0×19

03457d0c 32019e2b PS5UI!PPrepareDataForCommonUI+0×1af

0345813c 02118a57 PS5UI!DrvDevicePropertySheets+0×1dc

WARNING: Stack unwind information not available. Following frames may be wrong.

03458520 6dfd059a PrintDriverA!DrvDevicePropertySheets+0×3c7

03458584 6dfcff1e compstui!CallpfnPSUI+0xdb

034587f0 6dfd00a2 compstui!InsertPSUIPage+0×201

03458848 7307c9ae compstui!CPSUICallBack+0xed

03458870 6dfd059a winspool!DevicePropertySheets+0xd4

034588d4 6dfcff1e compstui!CallpfnPSUI+0xdb

03458b40 6dfd00a2 compstui!InsertPSUIPage+0×201

03458b98 6dfd06a3 compstui!CPSUICallBack+0xed

03458bcc 6dfd0799 compstui!DoCommonPropertySheetUI+0×74

03458be4 730801c5 compstui!CommonPropertySheetUIW+0×17

03458c2c 73080f5d winspool!CallCommonPropertySheetUI+0×43

03459074 35145947 winspool!PrinterPropertiesNative+0×10c

034590c4 3513a045 PrintDriverA!DllGetClassObject+0×159c7

0345e9ac 35131819 PrintDriverA!DllGetClassObject+0xa0c5

0345ebdc 32020661 PrintDriverA!DllGetClassObject+0×1899

0345ec04 3201b171 PS5UI!HComOEMPrinterEvent+0×33

0345ec48 02117a79 PS5UI!DrvPrinterEvent+0×239

0345eea4 7308218c PrintDriverA!DrvPrinterEvent+0xf9

0345eef0 761542cc winspool!SpoolerPrinterEventNative+0×57

0345ef0c 76155fd6 localspl!SplDriverEvent+0×21

0345ef30 76144799 localspl!PrinterDriverEvent+0×46

0345f3f8 76144ab2 localspl!SplAddPrinter+0×5f3

0345f424 74070193 localspl!LocalAddPrinterEx+0×2e

0345f874 7407025c spoolss!AddPrinterExW+0×151

0345f890 0100792d spoolss!AddPrinterW+0×17

0345f8ac 01006762 spoolsv!YAddPrinter+0×75

0345f8d0 77c80193 spoolsv!RpcAddPrinter+0×37

0345f8f8 77ce33e1 rpcrt4!Invoke+0×30

0345fcf8 77ce35c4 rpcrt4!NdrStubCall2+0×299

0345fd14 77c7ff7a rpcrt4!NdrServerCall2+0×19

0345fd48 77c8042d rpcrt4!DispatchToStubInCNoAvrf+0×38

0345fd9c 77c80353 rpcrt4!RPC_INTERFACE::DispatchToStubWorker+0×11f

0345fdc0 77c811dc rpcrt4!RPC_INTERFACE::DispatchToStub+0xa3

0345fdfc 77c812f0 rpcrt4!LRPC_SCALL::DealWithRequestMessage+0×42c

0345fe20 77c88678 rpcrt4!LRPC_ADDRESS::DealWithLRPCRequest+0×127

0345ff84 77c88792 rpcrt4!LRPC_ADDRESS::ReceiveLotsaCalls+0×430

0345ff8c 77c8872d rpcrt4!RecvLotsaCallsWrapper+0xd

0345ffac 77c7b110 rpcrt4!BaseCachedThreadRoutine+0×9d

0345ffb8 77e64829 rpcrt4!ThreadStartRoutine+0×1b

0345ffec 00000000 kernel32!BaseThreadStart+0×34
lmt command shows many loaded print drivers but we advise the fans of driver elimination to remove or upgrade PrintDriverB and PrintDriveA. We also advise to enable full page heap on the spooler service to find the direct offender.
- Dmitry Vostokov @ DumpAnalysis.org + TraceAnalysis.org -
One common question is to how determine a service name from kernel memory dump where PEB information is not available (!peb). For example, there are plenty of svchost.exe processes running and one has a handle leak. I’m looking for a good simple method and in the mean time I suggested to use the following empirical data:
1. Look at driver modules on stack traces (e.g. termdd)
2. Look at the relative position of svchost.exe in the list of processes that reflects service startup dependency (!process 0 0)
3. Execution residue and string pointers on thread raw stacks (WinDbg script)
4. Process handle table (usually available for the current process according to my experience)
5. The number of threads and distribution of modules on thread stack traces (might require reference stack traces)
6. IRP information (e.g. a driver, device and file objects), for example:
THREAD fffffa800c21fbb0  Cid 0264.4ba4  Teb: 000007fffff92000 Win32Thread: fffff900c2001d50 WAIT: (WrQueue) UserMode Alertable

    fffffa800673f330  QueueObject

IRP List:

fffffa800c388010: (0006,0478) Flags: 00060070  Mdl: 00000000

Not impersonating

DeviceMap                 fffff88000006160

Owning Process            fffffa8006796c10       Image:         svchost.exe

Attached Process          N/A            Image:         N/A

Wait Start TickCount      30553196       Ticks: 1359 (0:00:00:21.200)

Context Switch Count      175424                 LargeStack

UserTime                  00:00:05.834

KernelTime                00:00:32.541

Win32 Start Address 0x0000000077a77cb0

Stack Init fffffa60154c6db0 Current fffffa60154c6820

Base fffffa60154c7000 Limit fffffa60154bf000 Call 0

Priority 10 BasePriority 8 PriorityDecrement 0 IoPriority 2 PagePriority 5

Child-SP          RetAddr           Call Site

fffffa60`154c6860 fffff800`01ab20fa nt!KiSwapContext+0x7f

fffffa60`154c69a0 fffff800`01ab55a4 nt!KiSwapThread+0x13a

fffffa60`154c6a10 fffff800`01d17427 nt!KeRemoveQueueEx+0x4b4

fffffa60`154c6ac0 fffff800`01ae465b nt!IoRemoveIoCompletion+0x47

fffffa60`154c6b40 fffff800`01aaf933 nt!NtWaitForWorkViaWorkerFactory+0x1fe

fffffa60`154c6c20 00000000`77aa857a nt!KiSystemServiceCopyEnd+0x13 (TrapFrame @ fffffa60`154c6c20)

00000000`04e7fb58 00000000`00000000 0x77aa857a
3: kd> !irp fffffa800c388010

Irp is active with 6 stacks 6 is current (= 0xfffffa800c388248)

 No Mdl: System buffer=fffffa800871b210: Thread fffffa800c21fbb0:  Irp stack trace.

     cmd  flg cl Device   File     Completion-Context

 [  0, 0]   0  0 00000000 00000000 00000000-00000000
   Args: 00000000 00000000 00000000 00000000

 [  0, 0]   0  0 00000000 00000000 00000000-00000000
   Args: 00000000 00000000 00000000 00000000

 [  0, 0]   0  0 00000000 00000000 00000000-00000000
   Args: 00000000 00000000 00000000 00000000

 [  0, 0]   0  0 00000000 00000000 00000000-00000000
   Args: 00000000 00000000 00000000 00000000

 [  0, 0]   0  0 00000000 00000000 00000000-00000000
   Args: 00000000 00000000 00000000 00000000

>[  e, 0]   5  1 fffffa8006018060 fffffa8007bf0e60 00000000-00000000    pending

        \Driver\rdpdr

   Args: 00000100 00000000 00090004 00000000
3: kd> !fileobj fffffa8007bf0e60
\TSCLIENT\SCARD\14
Device Object: 0xfffffa8006018060   \Driver\rdpdr

Vpb is NULL

Access: Read Write SharedRead SharedWrite
Flags:  0x44000

 Cleanup Complete

 Handle Created
FsContext: 0xfffff8801807c010 FsContext2: 0xfffff8801807c370

CurrentByteOffset: 0

Cache Data:

  Section Object Pointers: fffffa800c50fdc8

  Shared Cache Map: 00000000
Any other ideas are appreciated. Please comment.
- Dmitry Vostokov @ DumpAnalysis.org + TraceAnalysis.org -
Source: Amazon DE (at the time of this writing)
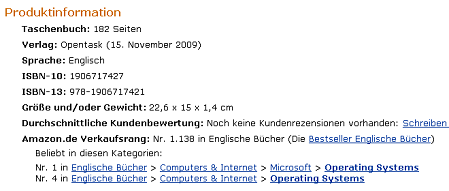
It is also the top best seller among OpenTask titles: http://www.opentask.com/top-bestseller-april-2010
- Dmitry Vostokov @ DumpAnalysis.org + TraceAnalysis.org -
I’ve decided to adapt archaeological classificatory framework (using my favourite method of inquiry: metaphorical bijectionism) to lay out foundations for yet another attempt to classify DA+TA patterns):
Attribute ↔ Pattern 2
Artefact ↔ Component Artefact1
Assemblage ↔ Component Assemblage
Culture ↔ Memory System Culture

1 Can be either a component-generated artefact or a component like a module or symbol file
2 Typical examples of memory system cultures are Windows, UNIX or even “Multiplatform”
I propose a word Memoarchaeological for such a framework and Memoarchaeology for a branch of Memoretics that studies saved computer memory artifacts from past computations (as opposed to live memory).
Note: In one of the forthcoming issues of Debugged! MZ/PE magazine there will be presented yet another classificatory scheme.
- Dmitry Vostokov @ DumpAnalysis.org + TraceAnalysis.org -
Today we introduce an icon for Insufficient Memory (control blocks) pattern:
B/W
![]()
Color
![]()
- Dmitry Vostokov @ DumpAnalysis.org + TraceAnalysis.org -
Forthcoming CARE and STARE online systems additionally aim to provide software behaviour pattern identification via debugger log and trace analysis and suggest possible software troubleshooting patterns. The purpose of these post series is to provide high level overview of possible patterns of software behavior and how they can be recognised and analyzed. This work started in October, 2006 with the identification of computer memory patterns and later continued with software trace patterns. Bringing all of them under a unified linked framework seems quite natural to me.
- Dmitry Vostokov @ DumpAnalysis.org + TraceAnalysis.org -
The Citrix Blog has published a short introduction:
Introducing the Citrix Support Twitter Team
- Dmitry Vostokov @ DumpAnalysis.org + TraceAnalysis.org -
Today we introduce an icon for Insufficient Memory (physical memory) pattern:
B/W
![]()
Color
![]()
- Dmitry Vostokov @ DumpAnalysis.org + TraceAnalysis.org -
The following tool published by Citrix follows DebugWare patterns in its overall architecture and design and was implemented by a team of engineers using RADII process:
SsOnExpert - Single Sign-On XenApp Plug-in Troubleshooting Tool
- Dmitry Vostokov @ DumpAnalysis.org + TraceAnalysis.org -
A spooler service process was hanging and its user memory dump shows many threads blocked waiting for critical sections including the main one:
0:000> kL

ChildEBP RetAddr

0007fa94 7c827d29 ntdll!KiFastSystemCallRet

0007fa98 7c83d266 ntdll!ZwWaitForSingleObject+0xc

0007fad4 7c83d2b1 ntdll!RtlpWaitOnCriticalSection+0×1a3

0007faf4 7c82dadf ntdll!RtlEnterCriticalSection+0xa8

0007fb94 7c82dad1 ntdll!LdrpGetProcedureAddress+0×128

0007fbb0 77e63db9 ntdll!LdrGetProcedureAddress+0×18

0007fbd8 01002ea1 kernel32!GetProcAddress+0×44

0007fc38 01002dbc spoolsv!__delayLoadHelper2+0×1d9

0007fc64 7d1e41fc spoolsv!_tailMerge_SPOOLSS+0xd

0007fcd8 7d1e1ed9 ADVAPI32!ScDispatcherLoop+0×287

0007ff3c 01004019 ADVAPI32!StartServiceCtrlDispatcherW+0xe3

0007ff44 010047a2 spoolsv!main+0xb

0007ffc0 77e6f23b spoolsv!mainCRTStartup+0×12f

0007fff0 00000000 kernel32!BaseProcessStart+0×23
0:000> !analyze -v -hang
DERIVED_WAIT_CHAIN:
Dl Eid Cid     WaitType

-- --- ------- --------------------------

   0   3990.3e80 Critical Section       –>

   18  3990.3f28 Critical Section
PRIMARY_PROBLEM_CLASS: APPLICATION_HANG_HeapCorruption
FOLLOWUP_IP:

msvcrt!calloc+118

77bbcdf3 8945e4          mov     dword ptr [ebp-1Ch],eax
0:018> kL 100

ChildEBP RetAddr

03b589b4 7c827d19 ntdll!KiFastSystemCallRet

03b589b8 77e76792 ntdll!NtWaitForMultipleObjects+0xc

03b58cec 7c8604ae kernel32!UnhandledExceptionFilter+0x7c0

03b58cf4 7c8282f1 ntdll!RtlpPossibleDeadlock+0xa5

03b58d1c 7c828772 ntdll!_except_handler3+0x61

03b58d40 7c828743 ntdll!ExecuteHandler2+0x26

03b58de8 7c82865c ntdll!ExecuteHandler+0x24

03b590c8 7c860491 ntdll!RtlRaiseException+0×3d

03b5914c 7c84cf0c ntdll!RtlpPossibleDeadlock+0×8d

03b59180 7c83d2b1 ntdll!RtlpWaitOnCriticalSection+0×226

03b591a0 7c82a284 ntdll!RtlEnterCriticalSection+0xa8

03b593c8 77bbcdf3 ntdll!RtlAllocateHeap+0×313

03b59408 77bbd45b msvcrt!calloc+0×118

03b59428 77bd3e55 msvcrt!_calloc_crt+0×19

03b59430 77bcfc38 msvcrt!_getbuf+0×12

03b59444 77bd1f26 msvcrt!_flsbuf+0×76

03b5946c 77bd40e6 msvcrt!_putwc_lk+0×99

03b5947c 77bd445b msvcrt!_ftbuf+0×4d

03b598f8 77bd253b msvcrt!_woutput+0×2ee

03b59940 7617785d msvcrt!fwprintf+0×33

03b59950 761778d3 localspl!InitiateErrorReport+0×28

03b59984 76176cfa localspl!CaptureAndLogException+0×24

03b5998c 3f01484b localspl!SplExceptionLoggingFilter+0×15

WARNING: Stack unwind information not available. Following frames may be wrong.

03b599ac 02938a47 PrinterDriverA+0xb72b

03b59c34 7c8604ae PrinterDriverB+0xf2a7

03b59c3c 7c8282f1 ntdll!RtlpPossibleDeadlock+0xa5

03b59c64 7c828772 ntdll!_except_handler3+0×61

03b59c88 7c828743 ntdll!ExecuteHandler2+0×26

03b59d30 7c82865c ntdll!ExecuteHandler+0×24

03b5a010 7c860491 ntdll!RtlRaiseException+0×3d

03b5a094 7c84cf0c ntdll!RtlpPossibleDeadlock+0×8d

03b5a0c8 7c83d2b1 ntdll!RtlpWaitOnCriticalSection+0×226

03b5a0e8 7c82a284 ntdll!RtlEnterCriticalSection+0xa8

03b5a310 77bbcdf3 ntdll!RtlAllocateHeap+0×313

03b5a350 77bbd45b msvcrt!calloc+0×118

03b5a370 77bd3e55 msvcrt!_calloc_crt+0×19

03b5a378 77bcfc38 msvcrt!_getbuf+0×12

03b5a38c 77bd1f26 msvcrt!_flsbuf+0×76

03b5a3b4 77bd40e6 msvcrt!_putwc_lk+0×99

03b5a3c4 77bd445b msvcrt!_ftbuf+0×4d

03b5a840 77bd253b msvcrt!_woutput+0×2ee

03b5a888 7617785d msvcrt!fwprintf+0×33

03b5a898 761778d3 localspl!InitiateErrorReport+0×28

03b5a8cc 76176cfa localspl!CaptureAndLogException+0×24

03b5a8d4 3f01484b localspl!SplExceptionLoggingFilter+0×15

03b5a8f4 02938a47 PrinterDriverA+0xb72b

03b5ab7c 7c8604ae PrinterDriverB+0xf2a7

03b5ab84 7c8282f1 ntdll!RtlpPossibleDeadlock+0xa5

03b5abac 7c828772 ntdll!_except_handler3+0×61

03b5abd0 7c828743 ntdll!ExecuteHandler2+0×26

03b5ac78 7c82865c ntdll!ExecuteHandler+0×24

03b5af58 7c860491 ntdll!RtlRaiseException+0×3d

03b5afdc 7c84cf0c ntdll!RtlpPossibleDeadlock+0×8d

03b5b010 7c83d2b1 ntdll!RtlpWaitOnCriticalSection+0×226

03b5b030 7c82a284 ntdll!RtlEnterCriticalSection+0xa8

03b5b258 77bbcdf3 ntdll!RtlAllocateHeap+0×313

03b5b298 77bbd45b msvcrt!calloc+0×118

03b5b2b8 77bd3e55 msvcrt!_calloc_crt+0×19

03b5b2c0 77bcfc38 msvcrt!_getbuf+0×12

03b5b2d4 77bd1f26 msvcrt!_flsbuf+0×76

03b5b2fc 77bd40e6 msvcrt!_putwc_lk+0×99

03b5b30c 77bd445b msvcrt!_ftbuf+0×4d

03b5b788 77bd253b msvcrt!_woutput+0×2ee

03b5b7d0 7617785d msvcrt!fwprintf+0×33

03b5b7e0 761778d3 localspl!InitiateErrorReport+0×28

03b5b814 76176cfa localspl!CaptureAndLogException+0×24

03b5b81c 3f01484b localspl!SplExceptionLoggingFilter+0×15

03b5b83c 02938a47 PrinterDriverA+0xb72b

03b5bac4 7c8604ae PrinterDriverB+0xf2a7

03b5bacc 7c8282f1 ntdll!RtlpPossibleDeadlock+0xa5

03b5baf4 7c828772 ntdll!_except_handler3+0×61

03b5bb18 7c828743 ntdll!ExecuteHandler2+0×26

03b5bbc0 7c82865c ntdll!ExecuteHandler+0×24

03b5bea0 7c860491 ntdll!RtlRaiseException+0×3d

03b5bf24 7c84cf0c ntdll!RtlpPossibleDeadlock+0×8d

03b5bf58 7c83d2b1 ntdll!RtlpWaitOnCriticalSection+0×226

03b5bf78 7c82a284 ntdll!RtlEnterCriticalSection+0xa8

03b5c1a0 77bbcdf3 ntdll!RtlAllocateHeap+0×313

03b5c1e0 77bbd45b msvcrt!calloc+0×118

03b5c200 77bd3e55 msvcrt!_calloc_crt+0×19

03b5c208 77bcfc38 msvcrt!_getbuf+0×12

03b5c21c 77bd1f26 msvcrt!_flsbuf+0×76

03b5c244 77bd40e6 msvcrt!_putwc_lk+0×99

03b5c254 77bd445b msvcrt!_ftbuf+0×4d

03b5c6d0 77bd253b msvcrt!_woutput+0×2ee

03b5c718 7617785d msvcrt!fwprintf+0×33

03b5c728 761778d3 localspl!InitiateErrorReport+0×28

03b5c75c 76176cfa localspl!CaptureAndLogException+0×24

03b5c764 3f01484b localspl!SplExceptionLoggingFilter+0×15

03b5c784 02938a47 PrinterDriverA+0xb72b

03b5ca0c 7c8604ae PrinterDriverB+0xf2a7

03b5ca14 7c8282f1 ntdll!RtlpPossibleDeadlock+0xa5

03b5ca3c 7c828772 ntdll!_except_handler3+0×61

03b5ca60 7c828743 ntdll!ExecuteHandler2+0×26

03b5cb08 7c82865c ntdll!ExecuteHandler+0×24

03b5cde8 7c860491 ntdll!RtlRaiseException+0×3d

03b5ce6c 7c84cf0c ntdll!RtlpPossibleDeadlock+0×8d

03b5cea0 7c83d2b1 ntdll!RtlpWaitOnCriticalSection+0×226

03b5cec0 7c82a284 ntdll!RtlEnterCriticalSection+0xa8

03b5d0e8 77bbcdf3 ntdll!RtlAllocateHeap+0×313

03b5d128 77bbd45b msvcrt!calloc+0×118

03b5d148 77bd3e55 msvcrt!_calloc_crt+0×19

03b5d150 77bcfc38 msvcrt!_getbuf+0×12

03b5d164 77bd1f26 msvcrt!_flsbuf+0×76

03b5d18c 77bd40e6 msvcrt!_putwc_lk+0×99

03b5d19c 77bd445b msvcrt!_ftbuf+0×4d

03b5d618 77bd253b msvcrt!_woutput+0×2ee

03b5d660 7617785d msvcrt!fwprintf+0×33

03b5d670 761778d3 localspl!InitiateErrorReport+0×28

03b5d6a4 76176cfa localspl!CaptureAndLogException+0×24

03b5d6ac 3f01484b localspl!SplExceptionLoggingFilter+0×15

03b5d6cc 02938a47 PrinterDriverA+0xb72b

03b5d954 7c8604ae PrinterDriverB+0xf2a7

03b5d95c 7c8282f1 ntdll!RtlpPossibleDeadlock+0xa5

03b5d984 7c828772 ntdll!_except_handler3+0×61

03b5d9a8 7c828743 ntdll!ExecuteHandler2+0×26

03b5da50 7c82865c ntdll!ExecuteHandler+0×24

03b5dd30 7c860491 ntdll!RtlRaiseException+0×3d

03b5ddb4 7c84cf0c ntdll!RtlpPossibleDeadlock+0×8d

03b5dde8 7c83d2b1 ntdll!RtlpWaitOnCriticalSection+0×226

03b5de08 7c82a284 ntdll!RtlEnterCriticalSection+0xa8

03b5e030 77bbcdf3 ntdll!RtlAllocateHeap+0×313

03b5e070 77bbd45b msvcrt!calloc+0×118

03b5e090 77bd3e55 msvcrt!_calloc_crt+0×19

03b5e098 77bcfc38 msvcrt!_getbuf+0×12

03b5e0ac 77bd1f26 msvcrt!_flsbuf+0×76

03b5e0d4 77bd40e6 msvcrt!_putwc_lk+0×99

03b5e0e4 77bd445b msvcrt!_ftbuf+0×4d

03b5e560 77bd253b msvcrt!_woutput+0×2ee

03b5e5a8 7617785d msvcrt!fwprintf+0×33

03b5e5b8 761778d3 localspl!InitiateErrorReport+0×28

03b5e5ec 76176cfa localspl!CaptureAndLogException+0×24

03b5e5f4 3f01484b localspl!SplExceptionLoggingFilter+0×15

03b5e614 02938a47 PrinterDriverA+0xb72b

03b5e89c 7c8604ae PrinterDriverB+0xf2a7

03b5e8a4 7c8282f1 ntdll!RtlpPossibleDeadlock+0xa5

03b5e8cc 7c828772 ntdll!_except_handler3+0×61

03b5e8f0 7c828743 ntdll!ExecuteHandler2+0×26

03b5e998 7c82865c ntdll!ExecuteHandler+0×24

03b5ec78 7c860491 ntdll!RtlRaiseException+0×3d

03b5ecfc 7c84cf0c ntdll!RtlpPossibleDeadlock+0×8d

03b5ed30 7c83d2b1 ntdll!RtlpWaitOnCriticalSection+0×226

03b5ed50 7c82a284 ntdll!RtlEnterCriticalSection+0xa8

03b5ef78 77bbd08c ntdll!RtlAllocateHeap+0×313

03b5ef98 74ef12ca msvcrt!malloc+0×6c

03b5efac 74ef1241 resutils!_malloc_crt+0xf

03b5efb8 74ef132b resutils!_CRT_INIT+0×37

03b5efd8 7c81a352 resutils!_DllMainCRTStartup+0×42

03b5eff8 7c83348d ntdll!LdrpCallInitRoutine+0×14

03b5f100 7c834339 ntdll!LdrpRunInitializeRoutines+0×367

03b5f394 7c83408d ntdll!LdrpLoadDll+0×3cd

03b5f610 77e41bf7 ntdll!LdrLoadDll+0×198

03b5f678 77e5c70b kernel32!LoadLibraryExW+0×1b2

03b5f68c 7406621a kernel32!LoadLibraryW+0×11

03b5f6a8 740663c4 SPOOLSS!TClusterAPI::TClusterAPI+0×2d

03b5f758 74072c6b SPOOLSS!GetClusterIPAddresses+0×26

03b5f7bc 74072d8e SPOOLSS!TNameResolutionCache::IsNameCluster+0xdf

03b5f7d0 7403cf4d SPOOLSS!CacheIsNameCluster+0×1c

03b5f7e8 7403514e win32spl!IsNameTheLocalMachineOrAClusterSpooler+0xa1

03b5f818 74067306 win32spl!CacheOpenPrinter+0×4d

03b5f864 74066cf5 SPOOLSS!RouterOpenPrinterW+0×1bb

03b5f884 01004cf4 SPOOLSS!OpenPrinterW+0×19

03b5f8ac 01004c9e spoolsv!YOpenPrinter+0×5a

03b5f8d0 77c80193 spoolsv!RpcOpenPrinter+0×37

03b5f8f8 77ce33e1 RPCRT4!Invoke+0×30

03b5fcf8 77ce35c4 RPCRT4!NdrStubCall2+0×299

03b5fd14 77c7ff7a RPCRT4!NdrServerCall2+0×19

03b5fd48 77c8042d RPCRT4!DispatchToStubInCNoAvrf+0×38

03b5fd9c 77c80353 RPCRT4!RPC_INTERFACE::DispatchToStubWorker+0×11f

03b5fdc0 77c811dc RPCRT4!RPC_INTERFACE::DispatchToStub+0xa3

03b5fdfc 77c812f0 RPCRT4!LRPC_SCALL::DealWithRequestMessage+0×42c

03b5fe20 77c88678 RPCRT4!LRPC_ADDRESS::DealWithLRPCRequest+0×127

03b5ff84 77c88792 RPCRT4!LRPC_ADDRESS::ReceiveLotsaCalls+0×430

03b5ff8c 77c8872d RPCRT4!RecvLotsaCallsWrapper+0xd

03b5ffac 77c7b110 RPCRT4!BaseCachedThreadRoutine+0×9d

03b5ffb8 77e6482f RPCRT4!ThreadStartRoutine+0×1b

03b5ffec 00000000 kernel32!BaseThreadStart+0×34
The default command also reports a heap corruption but the closer inspection reveals that it was a detected deadlock:
0:018> kv 100

ChildEBP RetAddr  Args to Child

03b589b4 7c827d19 77e76792 00000002 03b58b5c ntdll!KiFastSystemCallRet

03b589b8 77e76792 00000002 03b58b5c 00000001 ntdll!NtWaitForMultipleObjects+0xc

03b58cec 7c8604ae 03b58d14 7c8282f1 03b58d1c kernel32!UnhandledExceptionFilter+0×7c0

03b58cf4 7c8282f1 03b58d1c 00000000 03b58d1c ntdll!RtlpPossibleDeadlock+0xa5

03b58d1c 7c828772 03b590e0 03b5913c 03b58df8 ntdll!_except_handler3+0×61

03b58d40 7c828743 03b590e0 03b5913c 03b58df8 ntdll!ExecuteHandler2+0×26

03b58de8 7c82865c 03b58000 03b58df8 00010007 ntdll!ExecuteHandler+0×24

03b590c8 7c860491 03b590e0 7c88a9e8 00030608 ntdll!RtlRaiseException+0×3d

03b5914c 7c84cf0c 00030608 00000001 0003060c ntdll!RtlpPossibleDeadlock+0×8d

03b59180 7c83d2b1 00000c4c 00000004 00030000 ntdll!RtlpWaitOnCriticalSection+0×226

03b591a0 7c82a284 00030608 00000000 00001000 ntdll!RtlEnterCriticalSection+0xa8

03b593c8 77bbcdf3 00030000 00000008 00001000 ntdll!RtlAllocateHeap+0×313

[…]

03b5e89c 7c8604ae 03b5e8c4 7c8282f1 03b5e8cc PrinterDriverA+0xf2a7

03b5e8a4 7c8282f1 03b5e8cc 00000000 03b5e8cc ntdll!RtlpPossibleDeadlock+0xa5

03b5e8cc 7c828772 03b5ec90 03b5ecec 03b5e9a8 ntdll!_except_handler3+0×61

03b5e8f0 7c828743 03b5ec90 03b5ecec 03b5e9a8 ntdll!ExecuteHandler2+0×26

03b5e998 7c82865c 03b58000 03b5e9a8 00010007 ntdll!ExecuteHandler+0×24

03b5ec78 7c860491 03b5ec90 7c88a9e8 00030608 ntdll!RtlRaiseException+0×3d

03b5ecfc 7c84cf0c 00030608 00000001 0003060c ntdll!RtlpPossibleDeadlock+0×8d

03b5ed30 7c83d2b1 00000c4c 00000004 00030000 ntdll!RtlpWaitOnCriticalSection+0×226

03b5ed50 7c82a284 00030608 00000080 00000000 ntdll!RtlEnterCriticalSection+0xa8

03b5ef78 77bbd08c 00030000 00000000 00000080 ntdll!RtlAllocateHeap+0×313

03b5ef98 74ef12ca 00000080 00000000 00000000 msvcrt!malloc+0×6c

03b5efac 74ef1241 00000001 03b5efd8 74ef132b resutils!_malloc_crt+0xf

03b5efb8 74ef132b 74ef0000 00000001 00000000 resutils!_CRT_INIT+0×37

03b5efd8 7c81a352 74ef0000 00000001 00000000 resutils!_DllMainCRTStartup+0×42

03b5eff8 7c83348d 74ef12f4 74ef0000 00000001 ntdll!LdrpCallInitRoutine+0×14

03b5f100 7c834339 00000000 00000000 00000004 ntdll!LdrpRunInitializeRoutines+0×367

03b5f394 7c83408d 00000000 02785a60 03b5f65c ntdll!LdrpLoadDll+0×3cd

03b5f610 77e41bf7 02785a60 03b5f65c 03b5f63c ntdll!LdrLoadDll+0×198

03b5f678 77e5c70b 740654d4 00000000 00000000 kernel32!LoadLibraryExW+0×1b2

03b5f68c 7406621a 740654d4 000348b8 03b5f784 kernel32!LoadLibraryW+0×11

03b5f6a8 740663c4 000348b8 00000000 534c4354 SPOOLSS!TClusterAPI::TClusterAPI+0×2d

03b5f758 74072c6b 03b5f784 000e5874 00000610 SPOOLSS!GetClusterIPAddresses+0×26

03b5f7bc 74072d8e 00032920 000e5874 00000000 SPOOLSS!TNameResolutionCache::IsNameCluster+0xdf

03b5f7d0 7403cf4d 000e5874 000e5870 00000000 SPOOLSS!CacheIsNameCluster+0×1c

03b5f7e8 7403514e 000e5870 74075040 00c538f0 win32spl!IsNameTheLocalMachineOrAClusterSpooler+0xa1

03b5f818 74067306 000e5870 03b5f858 03b5f8a0 win32spl!CacheOpenPrinter+0×4d

03b5f864 74066cf5 000e5870 0273e500 03b5f8a0 SPOOLSS!RouterOpenPrinterW+0×1bb

03b5f884 01004cf4 000e5870 0273e500 03b5f8a0 SPOOLSS!OpenPrinterW+0×19

03b5f8ac 01004c9e 000e5870 0273e500 00000000 spoolsv!YOpenPrinter+0×5a

03b5f8d0 77c80193 000e5870 0273e500 00000000 spoolsv!RpcOpenPrinter+0×37

03b5f8f8 77ce33e1 01004c65 03b5fae0 00000005 RPCRT4!Invoke+0×30

03b5fcf8 77ce35c4 00000000 00000000 000f73d4 RPCRT4!NdrStubCall2+0×299

03b5fd14 77c7ff7a 000f73d4 000e4d30 000f73d4 RPCRT4!NdrServerCall2+0×19

03b5fd48 77c8042d 01002c47 000f73d4 03b5fdec RPCRT4!DispatchToStubInCNoAvrf+0×38

03b5fd9c 77c80353 00000001 00000000 0100d228 RPCRT4!RPC_INTERFACE::DispatchToStubWorker+0×11f

03b5fdc0 77c811dc 000f73d4 00000000 0100d228 RPCRT4!RPC_INTERFACE::DispatchToStub+0xa3

03b5fdfc 77c812f0 000f21d8 000e7028 000e5828 RPCRT4!LRPC_SCALL::DealWithRequestMessage+0×42c

03b5fe20 77c88678 000e7060 03b5fe38 000f21d8 RPCRT4!LRPC_ADDRESS::DealWithLRPCRequest+0×127

03b5ff84 77c88792 03b5ffac 77c8872d 000e7028 RPCRT4!LRPC_ADDRESS::ReceiveLotsaCalls+0×430

03b5ff8c 77c8872d 000e7028 00000000 00000000 RPCRT4!RecvLotsaCallsWrapper+0xd

03b5ffac 77c7b110 000995b8 03b5ffec 77e6482f RPCRT4!BaseCachedThreadRoutine+0×9d

03b5ffb8 77e6482f 02753798 00000000 00000000 RPCRT4!ThreadStartRoutine+0×1b

03b5ffec 00000000 77c7b0f5 02753798 00000000 kernel32!BaseThreadStart+0×34
0:018> .exptr 03b58d14
----- Exception record at 03b590e0:

ExceptionAddress: 7c860491 (ntdll!RtlpPossibleDeadlock+0x0000008d)

   ExceptionCode: c0000194

  ExceptionFlags: 00000000

NumberParameters: 1

   Parameter[0]: 00030608

Critical section at 00030608 is owned by thread 00000000,

causing this thread to raise an exception
----- Context record at 03b58df8:

eax=00000000 ebx=00000003 ecx=00030608 edx=03b590e0 esi=01000002 edi=7c88a9e8

eip=7c860491 esp=03b590d4 ebp=03b5914c iopl=0         nv up ei pl zr na pe nc

cs=001b  ss=0023  ds=0023  es=0023  fs=003b  gs=0000             efl=00000246

ntdll!RtlpPossibleDeadlock+0x8d:

7c860491 eb24            jmp     ntdll!RtlpPossibleDeadlock+0xa9 (7c8604b7)
0:018> .exr 03b5ec90

ExceptionAddress: 7c860491 (ntdll!RtlpPossibleDeadlock+0×0000008d)

   ExceptionCode: c0000194

  ExceptionFlags: 00000000

NumberParameters: 1

   Parameter[0]: 00030608

Critical section at 00030608 is owned by thread 00000000,

causing this thread to raise an exception
Notice that the problem section doesn’t have an owner. In order to find it we do search in memory:
0:018> s -d 0 L4000000 00030608

00030578  00030608 00000000 00030688 01010000

0162fa04  00030608 00000002 0162fad0 0162fb1c

03b58b6c  00030608 00000704 00000082 03b589d4

03b58ea4  00030608 00000000 03b5914c 7c860491

03b5907c  00030608 00000003 000000e8 010000e8

03b590d8  00030608 00000003 c0000194 00000000

03b590f4  00030608 00000704 0000e7c8 03b58e84

03b59154  00030608 00000001 0003060c 00000000

03b591a8  00030608 00000000 00001000 00000000

03b59dec  00030608 00000000 03b5a094 7c860491

03b59fc4  00030608 00000003 000000e8 010000e8

03b5a020  00030608 00000003 c0000194 00000000

03b5a03c  00030608 00000704 0000e7c8 03b59dcc

03b5a09c  00030608 00000001 0003060c 00000000

03b5a0f0  00030608 00000000 00001000 00000000

03b5ad34  00030608 00000000 03b5afdc 7c860491

03b5af0c  00030608 00000003 000000e8 010000e8

03b5af68  00030608 00000003 c0000194 00000000

03b5af84  00030608 00000704 0000e7c8 03b5ad14

03b5afe4  00030608 00000001 0003060c 00000000

03b5b038  00030608 00000000 00001000 00000000

03b5bc7c  00030608 00000000 03b5bf24 7c860491

03b5be54  00030608 00000003 000000e8 010000e8

03b5beb0  00030608 00000003 c0000194 00000000

03b5becc  00030608 00000704 0000e7c8 03b5bc5c

03b5bf2c  00030608 00000001 0003060c 00000000

03b5bf80  00030608 00000000 00001000 00000000

03b5cbc4  00030608 00000000 03b5ce6c 7c860491

03b5cd9c  00030608 00000003 000000e8 010000e8

03b5cdf8  00030608 00000003 c0000194 00000000

03b5ce14  00030608 00000704 0000e7c8 03b5cba4

03b5ce74  00030608 00000001 0003060c 00000000

03b5cec8  00030608 00000000 00001000 00000000

03b5db0c  00030608 00000000 03b5ddb4 7c860491

03b5dce4  00030608 00000003 000000e8 010000e8

03b5dd40  00030608 00000003 c0000194 00000000

03b5dd5c  00030608 00000704 0000e7c8 03b5daec

03b5ddbc  00030608 00000001 0003060c 00000000

03b5de10  00030608 00000000 00001000 00000000

03b5ea54  00030608 00000000 03b5ecfc 7c860491

03b5ec2c  00030608 00000003 000000e8 010000e8

03b5ec88  00030608 00000003 c0000194 00000000

03b5eca4  00030608 7c82a11c 0000e7c8 03b5ea34

03b5ed04  00030608 00000001 0003060c 00000000

03b5ed58  00030608 00000080 00000000 7c829ff6
Addresses that start with 03b5 belong to the thread #18 we have seen already, 00030578 looks like belonging to the critical section list and the address 0162fa04 belongs to the thread #8 (we find it by looking at all thread stacks and search for 0162 in ChildEBP fields):
0:018> ~*k
[...]
   8  Id: 3990.3d60 Suspend: 1 Teb: 7ffae000 Unfrozen

ChildEBP RetAddr

0162ff18 7c827d29 ntdll!KiFastSystemCallRet

0162ff1c 77e61d1e ntdll!ZwWaitForSingleObject+0xc

0162ff8c 77e61c8d kernel32!WaitForSingleObjectEx+0xac

0162ffa0 72461375 kernel32!WaitForSingleObject+0×12

0162ffb8 77e6482f tcpmon!CDeviceStatus::StatusThread+0×2a

0162ffec 00000000 kernel32!BaseThreadStart+0×34
[...]
Nothing interesting until we look at raw stack and execution residue:
0:008> ~8s; !teb

eax=00000001 ebx=7246b050 ecx=0162fa78 edx=00000010 esi=0000041c edi=00000000

eip=7c82860c esp=0162ff1c ebp=0162ff8c iopl=0         nv up ei ng nz ac pe cy

cs=001b  ss=0023  ds=0023  es=0023  fs=003b  gs=0000             efl=00000297

ntdll!KiFastSystemCallRet:

7c82860c c3              ret

TEB at 7ffae000

    ExceptionList:        0162ff7c

    StackBase:            01630000

    StackLimit:           01628000

    SubSystemTib:         00000000

    FiberData:            00001e00

    ArbitraryUserPointer: 00000000

    Self:                 7ffae000

    EnvironmentPointer:   00000000

    ClientId:             00003990 . 00003d60

    RpcHandle:            00000000

    Tls Storage:          00000000

    PEB Address:          7ffde000

    LastErrorValue:       0

    LastStatusValue:      c000000d

    Count Owned Locks:    0

    HardErrorMode:        0
0:008> dds 01628000 01630000

01628000  00000000

01628004  00000000

01628008  00000000

0162800c  00000000

01628010  00000000

01628014  00000000

01628018  00000000

[…]

0162f984  313231a0

0162f988  0000e7c8

0162f98c  0162f9c8

0162f990  7c80b429 ntdll!_vsnprintf+0×2f

0162f994  0162f9a8

0162f998  7c84cf68 ntdll!RtlpNotOwnerCriticalSection+0×118

0162f99c  0000e7c8

0162f9a0  0162f9dc

0162f9a4  7c80b429 ntdll!_vsnprintf+0×2f

0162f9a8  0162f9bc

0162f9ac  7c84cfb8 ntdll!RtlpNotOwnerCriticalSection+0×168

0162f9b0  0162fcc0

0162f9b4  00000000

0162f9b8  00000200

0162f9bc  7c808080 ntdll!DbgSetDebugFilterState+0xc

0162f9c0  00000000

0162f9c4  00000000

0162f9c8  7c808080 ntdll!DbgSetDebugFilterState+0xc

0162f9cc  00000001

0162f9d0  0162f9ec

0162f9d4  7c8081d9 ntdll!DebugPrint+0×1c

0162f9d8  00000001

0162f9dc  0162fa78

0162f9e0  00000010

0162f9e4  ffffffff

0162f9e8  00000000

0162f9ec  0162fc94

0162f9f0  7c808194 ntdll!vDbgPrintExWithPrefixInternal+0×177

0162f9f4  0162fa60

0162f9f8  ffffffff

0162f9fc  7c812f85 ntdll!vDbgPrintExWithPrefixInternal+0×1d5

0162fa00  7c88a9e8 ntdll!RtlpTimeout

0162fa04  00030608

0162fa08  00000002

0162fa0c  0162fad0

0162fa10  0162fb1c

0162fa14  7c828290 ntdll!_except_handler3

0162fa18  7c82d9b8 ntdll!`string’+0xc

0162fa1c  ffffffff

0162fa20  7c82d9b5 ntdll!LdrpGetProcedureAddress+0xb3

0162fa24  7c82eaa3 ntdll!LdrpSnapThunk+0×31c

0162fa28  7c800000 ntdll!RtlDosPathSeperatorsString <PERF> (ntdll+0×0)

0162fa2c  0162fa64

[…]
Here we find DebugPrint call in close proximity to our critical section address and we dump its possible local data:
0:008> dc 0162fa78

0162fa78  3a4c5452 2d655220 74696157 0a676e69  RTL: Re-Waiting.

0162fa88  43203400 69746972 206c6163 74636553  .4 Critical Sect

0162fa98  206e6f69 33303030 38303630 43202d20  ion 00030608 - C

0162faa8  65746e6f 6f69746e 756f436e 3d20746e  ontentionCount =

0162fab8  0a38203d 00007000 000923a8 0162fad0  = 8..p…#….b.

0162fac8  7c82b0ae 00000000 65440000 65646f63  …|……Decode

0162fad8  6e696f50 00726574 0162fba4 00007078  Pointer…b.xp..

0162fae8  000923a8 0162faf8 7c82b0ae 00000000  .#….b….|….
Nothing still points to that critical section owner and we try to find similar self-diagnostic messages in our original thread #18. We find one DebugPrint call in close proximity to deadlock detection and exception raising calls (after similar ~18s; !teb and dds commands):
03b58de0  03b60000

03b58de4  00000000

03b58de8  03b590c8

03b58dec  7c82865c ntdll!RtlRaiseException+0x3d

03b58df0  03b58000

03b58df4  03b58df8

03b58df8  00010007

03b58dfc  00000000

03b58e00  00000000

03b58e04  00000000

03b58e08  00000000

03b58e0c  00000000

03b58e10  33303030

03b58e14  38303630

03b58e18  00000000

03b58e1c  32323100

03b58e20  0000e7c8

03b58e24  03b58e60

03b58e28  7c80b429 ntdll!_vsnprintf+0x2f

03b58e2c  03b58e40

03b58e30  7c84cf68 ntdll!RtlpNotOwnerCriticalSection+0x118

03b58e34  03b59144

03b58e38  00000000

03b58e3c  00000200

03b58e40  7c808080 ntdll!DbgSetDebugFilterState+0xc

03b58e44  00000000

03b58e48  00000000

03b58e4c  7c808080 ntdll!DbgSetDebugFilterState+0xc

03b58e50  00000001

03b58e54  03b58e70

03b58e58  7c8081d9 ntdll!DebugPrint+0×1c

03b58e5c  00000001

03b58e60  03b58efc

03b58e64  00000058

03b58e68  ffffffff

03b58e6c  00000000

03b58e70  03b59118

03b58e74  7c808194 ntdll!vDbgPrintExWithPrefixInternal+0×177

03b58e78  03b58ee4

03b58e7c  ffffffff

03b58e80  7c812f85 ntdll!vDbgPrintExWithPrefixInternal+0×1d5

03b58e84  7c880000 ntdll!_raise_exc_ex+0xc5

03b58e88  0003003b

03b58e8c  00000023

03b58e90  00030023

03b58e94  7c88a9e8 ntdll!RtlpTimeout

03b58e98  01000002 spoolsv!_imp__SetServiceStatus <PERF> (spoolsv+0×2)

03b58e9c  00000003

03b58ea0  03b590e0

03b58ea4  00030608

03b58ea8  00000000

03b58eac  03b5914c

03b58eb0  7c860491 ntdll!RtlpPossibleDeadlock+0×8d

03b58eb4  0000001b

03b58eb8  00000246

03b58ebc  03b590d4

03b58ec0  00000023

03b58ec4  00000000
0:018> dc 03b58efc

03b58efc  3a4c5452 64695020 6469542e 39393320  RTL: Pid.Tid 399

03b58f0c  66332e30 202c3832 656e776f 69742072  0.3f28, owner ti

03b58f1c  62332064 43203439 69746972 206c6163  d 3b94 Critical

03b58f2c  74636553 206e6f69 33303030 38303630  Section 00030608

03b58f3c  43202d20 65746e6f 6f69746e 756f436e   - ContentionCou

03b58f4c  3d20746e 0a38203d 00165200 0277f0b0  nt == 8..R….w.

03b58f5c  000afa08 00020007 004cbe42 ffff0000  ……..B.L…..

03b58f6c  004cbe41 00165230 00000072 0000000a  A.L.0R..r…….
Now we see the owner TID 3b94! We immediately check its stack trace:
0:018> ~~[3b94]s

eax=036a82e0 ebx=00000000 ecx=00000003 edx=00000070 esi=7c8897a0 edi=7c88a9e8

eip=7c82860c esp=036a7930 ebp=036a796c iopl=0         nv up ei pl zr na pe nc

cs=001b  ss=0023  ds=0023  es=0023  fs=003b  gs=0000             efl=00000246

ntdll!KiFastSystemCallRet:

7c82860c c3              ret
0:020> kL 100

ChildEBP RetAddr

036a792c 7c827d29 ntdll!KiFastSystemCallRet

036a7930 7c83d266 ntdll!ZwWaitForSingleObject+0xc

036a796c 7c83d2b1 ntdll!RtlpWaitOnCriticalSection+0×1a3

036a798c 7c82d263 ntdll!RtlEnterCriticalSection+0xa8

036a79c0 77e63cd8 ntdll!LdrLockLoaderLock+0xe4

036a7a20 0292703f kernel32!GetModuleFileNameW+0×77

WARNING: Stack unwind information not available. Following frames may be wrong.

036a809c 02926f2c PrinterDriverA+0×1c1f

036a84e8 6dfd059a PrinterDriverA+0×1b0c

036a854c 6dfce91c COMPSTUI!CallpfnPSUI+0xdb

036a8564 6dfce5fc COMPSTUI!DeleteCPSUIPageProc+0×52

036a8580 6dfcff97 COMPSTUI!EnumCPSUIPages+0×40

036a87f0 6dfd00a2 COMPSTUI!InsertPSUIPage+0×27a

036a8848 7307c9ae COMPSTUI!CPSUICallBack+0xed

036a8870 6dfd059a WINSPOOL!DevicePropertySheets+0xd4

036a88d4 6dfcff1e COMPSTUI!CallpfnPSUI+0xdb

036a8b40 6dfd00a2 COMPSTUI!InsertPSUIPage+0×201

036a8b98 6dfd06a3 COMPSTUI!CPSUICallBack+0xed

036a8bcc 6dfd0799 COMPSTUI!DoCommonPropertySheetUI+0×74

036a8be4 730801c5 COMPSTUI!CommonPropertySheetUIW+0×17

036a8c2c 73080f5d WINSPOOL!CallCommonPropertySheetUI+0×43

036a9074 35145947 WINSPOOL!PrinterPropertiesNative+0×10c

036a90c4 3513a045 PrinterDriverA+0×159c7

036ae9ac 35131819 PrinterDriverA+0xa0c5

036aebdc 7111460e PrinterDriverA+0×1899

036aec04 7110faa3 UNIDRVUI!HComOEMPrinterEvent+0×33

036aec48 02927a79 UNIDRVUI!DrvPrinterEvent+0×27a

036aeea4 7308218c PrinterDriverA+0×20f9

036aeef0 761543c8 WINSPOOL!SpoolerPrinterEventNative+0×57

036aef0c 761560d2 localspl!SplDriverEvent+0×21

036aef30 761447f9 localspl!PrinterDriverEvent+0×46

036af3f8 76144b12 localspl!SplAddPrinter+0×5f3

036af424 74070193 localspl!LocalAddPrinterEx+0×2e

036af874 7407025c SPOOLSS!AddPrinterExW+0×151

036af890 0100792d SPOOLSS!AddPrinterW+0×17

036af8ac 01006762 spoolsv!YAddPrinter+0×75

036af8d0 77c80193 spoolsv!RpcAddPrinter+0×37

036af8f8 77ce33e1 RPCRT4!Invoke+0×30

036afcf8 77ce35c4 RPCRT4!NdrStubCall2+0×299

036afd14 77c7ff7a RPCRT4!NdrServerCall2+0×19

036afd48 77c8042d RPCRT4!DispatchToStubInCNoAvrf+0×38

036afd9c 77c80353 RPCRT4!RPC_INTERFACE::DispatchToStubWorker+0×11f

036afdc0 77c811dc RPCRT4!RPC_INTERFACE::DispatchToStub+0xa3

036afdfc 77c812f0 RPCRT4!LRPC_SCALL::DealWithRequestMessage+0×42c

036afe20 77c88678 RPCRT4!LRPC_ADDRESS::DealWithLRPCRequest+0×127

036aff84 77c88792 RPCRT4!LRPC_ADDRESS::ReceiveLotsaCalls+0×430

036aff8c 77c8872d RPCRT4!RecvLotsaCallsWrapper+0xd

036affac 77c7b110 RPCRT4!BaseCachedThreadRoutine+0×9d

036affb8 77e6482f RPCRT4!ThreadStartRoutine+0×1b

036affec 00000000 kernel32!BaseThreadStart+0×34
We see that it also has PrinterDriverA module on the stack trace and is waiting for a critical section that is owned by the thread #18 we have already seen:
0:020> kv

ChildEBP RetAddr  Args to Child

036a792c 7c827d29 7c83d266 000001b4 00000000 ntdll!KiFastSystemCallRet (FPO: [0,0,0])

036a7930 7c83d266 000001b4 00000000 7c88a9e8 ntdll!ZwWaitForSingleObject+0xc (FPO: [3,0,0])

036a796c 7c83d2b1 000001b4 00000004 00000001 ntdll!RtlpWaitOnCriticalSection+0x1a3 (FPO: [2,7,4])

036a798c 7c82d263 7c8897a0 01000000 7c8897ec ntdll!RtlEnterCriticalSection+0xa8 (FPO: [1,1,0])

036a79c0 77e63cd8 00000001 00000000 036a79fc ntdll!LdrLockLoaderLock+0xe4 (FPO: [SEH])

036a7a20 0292703f 00000000 036a7a68 00000208 kernel32!GetModuleFileNameW+0×77 (FPO: [SEH])

[…]
0:020> !cs -o 7c8897a0

—————————————–

Critical section   = 0×7c8897a0 (ntdll!LdrpLoaderLock+0×0)

DebugInfo          = 0×7c8897c0

LOCKED

LockCount          = 0xB

WaiterWoken        = No

OwningThread       = 0×00003f28

RecursionCount     = 0×2

LockSemaphore      = 0×1B4

SpinCount          = 0×00000000

OwningThread DbgId = ~18s

OwningThread Stack =

[…]
If we look again at the thread #18 we would see PrinterDriverA there too. So check its timestamp using lmv command and find out that its version is older than expected.
Note: !cs -l -o -s command is not helpful here and in fact it doesn’t list #20 thread as blocking thread so our inference about PrinterDriverA is speculative.
- Dmitry Vostokov @ DumpAnalysis.org + TraceAnalysis.org -
Twitter page for DumpAnalysis now has the background picture of a memory dump generated by Dump2Picture:
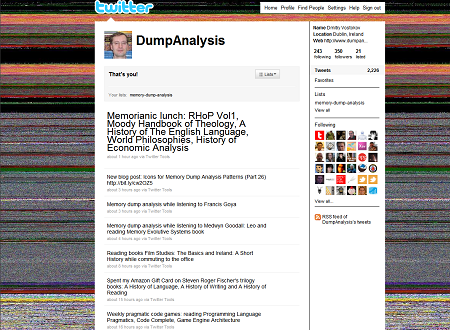
Hope you enjoy the new design ![]()
- Dmitry Vostokov @ DumpAnalysis.org + TraceAnalysis.org -
Today we introduce an icon for Insufficient Memory (virtual memory) pattern:
B/W
![]()
Color
![]()
Note: it features fragments from B/W and color images generated by Dump2Picture.
- Dmitry Vostokov @ DumpAnalysis.org + TraceAnalysis.org -
OpenTask to offer first 3 volumes of Memory Dump Analysis Anthology in one set:


The set is available exclusively from OpenTask e-Commerce web site starting from June. Individual volumes are also available from Amazon, Barnes & Noble and other bookstores worldwide.
Product information:
Information about individual volumes:
- Dmitry Vostokov @ DumpAnalysis.org + TraceAnalysis.org -
- Dmitry Vostokov @ DumpAnalysis.org + TraceAnalysis.org -
After checking that Vista still has old MS-DOS real mode 16-bit debug.exe with commands similar to WinDbg ones I tried to debug notepad.exe:
C:\Users\user>debug

-?

assemble     A [address]

compare      C range address

dump         D [range]

enter        E address [list]

fill         F range list

go           G [=address] [addresses]

hex          H value1 value2

input        I port

load         L [address] [drive] [firstsector] [number]

move         M range address

name         N [pathname] [arglist]

output       O port byte

proceed      P [=address] [number]

quit         Q

register     R [register]

search       S range list

trace        T [=address] [value]

unassemble   U [range]

write        W [address] [drive] [firstsector] [number]

allocate expanded memory        XA [#pages]

deallocate expanded memory      XD [handle]

map expanded memory pages       XM [Lpage] [Ppage] [handle]

display expanded memory status  XS
As expected it debugs the MSDOS (MZ) portion of notepad.exe:
C:\Users\user>debug c:\windows\system32\notepad.exe

-u

17DB:0000 0E            PUSH    CS

17DB:0001 1F            POP     DS

17DB:0002 BA0E00        MOV     DX,000E

17DB:0005 B409          MOV     AH,09

17DB:0007 CD21          INT     21

17DB:0009 B8014C        MOV     AX,4C01

17DB:000C CD21          INT     21

17DB:000E 54            PUSH    SP

17DB:000F 68            DB      68

17DB:0010 69            DB      69

17DB:0011 7320          JNB     0033

17DB:0013 7072          JO      0087

17DB:0015 6F            DB      6F

17DB:0016 67            DB      67

17DB:0017 7261          JB      007A

17DB:0019 6D            DB      6D

17DB:001A 206361        AND     [BP+DI+61],AH

17DB:001D 6E            DB      6E

17DB:001E 6E            DB      6E

17DB:001F 6F            DB      6F

-t
AX=0000  BX=FFFF  CX=FE00  DX=0000  SP=00B6  BP=0000  SI=0000  DI=0000

DS=17CB  ES=17CB  SS=17DB  CS=17DB  IP=0001   NV UP EI PL NZ NA PO NC

17DB:0001 1F            POP     DS

-t
AX=0000  BX=FFFF  CX=FE00  DX=0000  SP=00B8  BP=0000  SI=0000  DI=0000

DS=17DB  ES=17CB  SS=17DB  CS=17DB  IP=0002   NV UP EI PL NZ NA PO NC

17DB:0002 BA0E00        MOV     DX,000E

-t
AX=0000  BX=FFFF  CX=FE00  DX=000E  SP=00B8  BP=0000  SI=0000  DI=0000

DS=17DB  ES=17CB  SS=17DB  CS=17DB  IP=0005   NV UP EI PL NZ NA PO NC

17DB:0005 B409          MOV     AH,09

-g

This program cannot be run in DOS mode.
Program terminated normally

-
So I was looking for a real MSDOS program to debug and thought that debug.exe would be a natural choice. Unfortunately there was an illegal instruction during double debugging:
C:\Users\user>debug c:\windows\system32\debug.exe

-g

-g
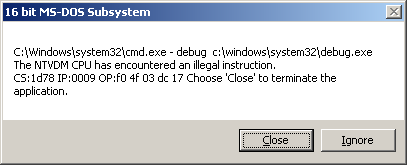
So it looks like WinDbg double debugging is much more robust despite the bigger file size (debug.exe is only 21KB).
- Dmitry Vostokov @ DumpAnalysis.org + TraceAnalysis.org -
Today we introduce an icon for Insufficient Memory (PTE) pattern:
B/W
![]()
Color
![]()
- Dmitry Vostokov @ DumpAnalysis.org + TraceAnalysis.org -