Archive for the ‘Performance Monitoring’ Category
Thursday, January 13th, 2022
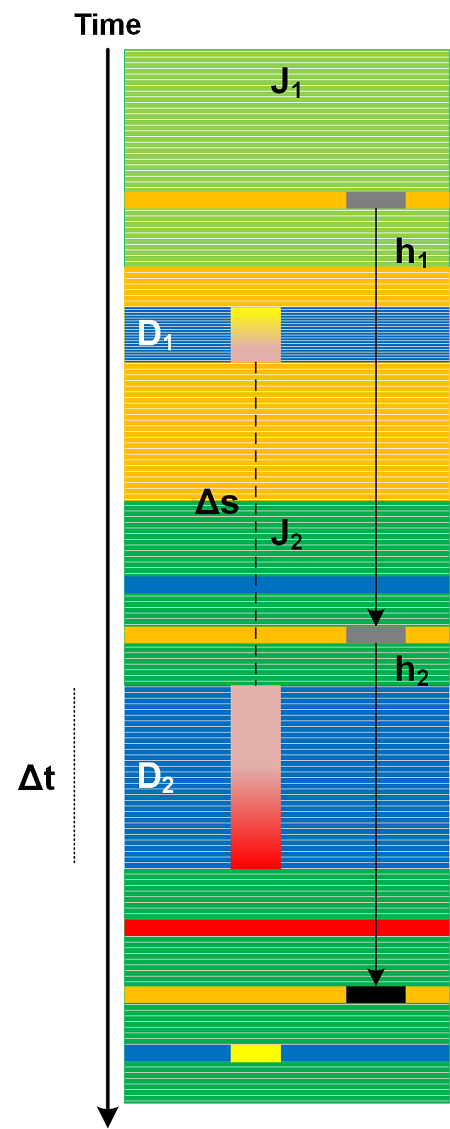
Various types of Measurements are important in software diagnostics. We consider traces and logs, and general software narratives (and even hardware narratives) as a medium for all types of possible measurements. Even a small display in a handheld device showing a number is an example of Singleton Trace.
Typical trace and log measurement analysis patterns include Time Delta, Statement Density and Current, and Trace Acceleration. Numeric analysis patterns include Counter Value, Trace Field, Signal in general, and the forthcoming Trace Distance that uses various metrics, for example, the number of messages, Activity Regions, or just hops.
- Dmitry Vostokov @ DumpAnalysis.org + TraceAnalysis.org -
Posted in Log Analysis, Metrics, Monitoring, Performance Analysis, Performance Monitoring, Prometheus, Software Narratology, Software Trace Analysis, Telemetry, Trace Analysis Patterns | Comments Off
Sunday, January 10th, 2021
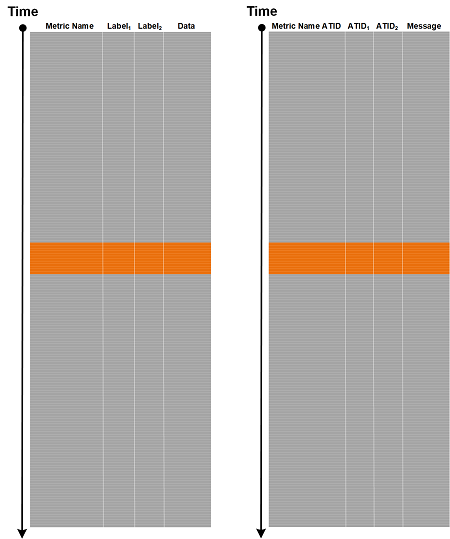
Various metrics are covered by Counter Value trace and log analysis pattern. However, metric labels or metric metadata as implemented by monitoring tools such as Prometheus can be mapped directly to Adjoint Threads of Activity in our trace and log analysis pattern catalog:
<Metric Name>{<Label Name>=<Label Value>, ...}=<Metric Value> (from Prometheus data model)
{<Metric Name ATID>=<ATID Value>, <ATID Name>=<ATID Value>, ..., <Message (Metric Value)>}
This allows the application of many trace and log analysis patterns related to threading and adjoint threading (multibraiding).
We call this analysis pattern Message Metadata. It is illustrated for time series in the following diagram where we have the same Labels for all metric names (in general labels may be different):
- Dmitry Vostokov @ DumpAnalysis.org + TraceAnalysis.org -
Posted in Log Analysis, Metrics, Monitoring, Performance Monitoring, Prometheus, Software Trace Analysis, Trace Analysis Patterns | Comments Off
Monday, April 3rd, 2017
For completeness, we add Aggregated Frames analysis pattern implemented as “aggregated stack trace” in various software performance profiling tools. Such tools periodically record CPU Stack Trace Collection. Other tools profile memory allocations and their stack traces. By aggregation we mean summing up occurrences of modules and functions from all collected stack traces similar to this table:
ModuleA         88%
   +0x234          42%
   +0x123           8%
   !foo            38%
      +0xd            30%
      +0x56            2%
   !bar             6%
      +0x18            6%
ModuleB         12%
   !export         12%
      +0x2380          1%
      +0x1224          6%
      +0x3812          5%
Related to memory dump analysis we can either use Stack Trace Collection to detect Ubiquitous Component in user and kernel spaces, or database Stack Traces, for example, used in detection of process heap, handle, and reference Memory Leaks.
We do not include “stack” in the name of this pattern because frames are not sorted by the execution direction compared to Unified Stack Trace analysis pattern where we have some notion of aggregation depicted as multiplicities.
We can also name it as Frame Usage Signature similar to Stack Trace Signature.
- Dmitry Vostokov @ DumpAnalysis.org + TraceAnalysis.org -
Posted in Crash Dump Analysis, Crash Dump Patterns, Performance Monitoring, Software Trace Analysis | No Comments »
Tuesday, March 3rd, 2015
When we do tracing and logging much of computational activity is not visible. For live tracing and debugging this can be alleviated by adding Watch Threads. These are selected memory locations that may or may not be formatted according to specific data structures and are inspected at each main trace message occurrence or after specific intervals or events:
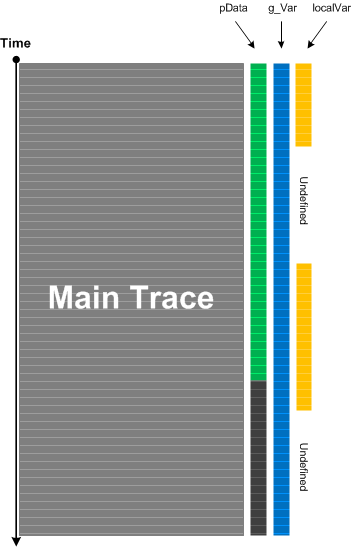
This analysis pattern is different from State Dump which is about intrinsic tracing where the developer of logging statements already incorporated variable watch in source code. Watch Threads are completely independent from original tracing and may be added independently. Counter Value is the simplest example of Watch Thread if done externally because the former usually doesn’t require source code and often means some OS or module variable independent of product internals. Watch Thread is also similar to Data Flow pattern where specific data we are interested in is a part of every trace message.
- Dmitry Vostokov @ DumpAnalysis.org + TraceAnalysis.org -
Posted in Debugging, Log Analysis, Performance Monitoring, Software Narratology, Software Trace Analysis, Trace Analysis Patterns | No Comments »
Wednesday, September 26th, 2012
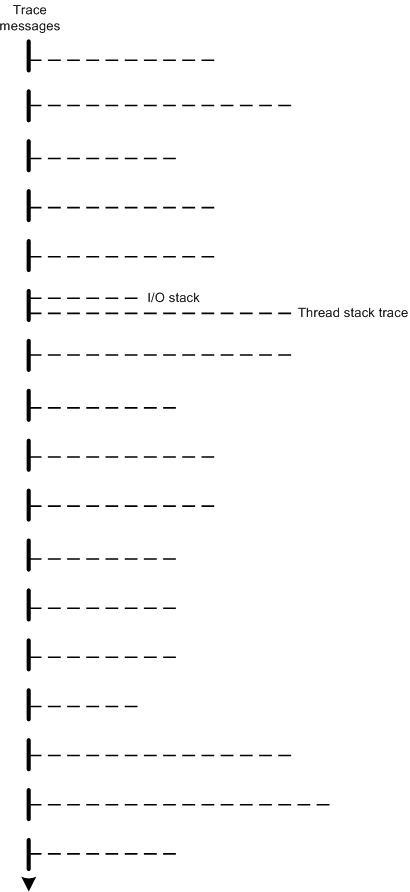
The modern software trace recording, visualization and analysis tools such as Process Monitor, Xperf, WPR and WPA provide stack traces associated with trace messages. Consider stack traces as software traces we have, in a more general case, traces (fibers) bundled together on (attached to) a base software trace. For example, a trace message, that mentions an IRP can have its I/O stack attached together with thread stack trace with function calls leading to a function that emitted the trace message. Another example is association of different types of traces with trace messages such as managed and unmanaged ones. This general trace analysis pattern needs a name so we opted for Fiber Bundle as analogy with a fiber bundle from mathematics. Here’s a graphical representation of stack traces recorded for each trace message where one message also has an associated I/O stack trace:
- Dmitry Vostokov @ DumpAnalysis.org + TraceAnalysis.org -
Posted in Debugging, Event Tracing for Windows (ETW), Performance Monitoring, Software Diagnostics, Software Narratology, Software Trace Analysis, Software Trace Reading, Software Trace Visualization, Trace Analysis Patterns | 1 Comment »
Sunday, September 23rd, 2012
Learn from this Webinar about phenomenological, hermeneutical and analytical approaches to software diagnostics and its knowledge, foundations, norms, theories, logic, methodology, language, ontology, nature and truth. This seminar is hosted by Software Diagnostics Services.

Title: Introduction to Philosophy of Software Diagnostics
Date: 17th of December, 2012
Time: 19:00 GMT
Duration: 60 minutes
Space is limited.
Reserve your Webinar seat now at:
https://www3.gotomeeting.com/register/872846486
- Dmitry Vostokov @ DumpAnalysis.org + TraceAnalysis.org -
Posted in Announcements, Computer Science, Core Dump Analysis, Crash Dump Analysis, Crash Dump Patterns, Debugging, Debugging Methodology, Education and Research, Escalation Engineering, First Fault Software Diagnostics, Hermeneutics of Memory Dumps and Traces, Logic, Memiotics (Memory Semiotics), Memoretics, Memory Dump Analysis Methodology, Performance Monitoring, Phenomenology of Software Diagnostics, Philosophy, Philosophy of Software Diagnostics, Root Cause Analysis, Science of Memory Dump Analysis, Science of Software Tracing, Semiotics, Software Behavior Patterns, Software Diagnostics, Software Diagnostics Institute, Software Diagnostics Pattern Language, Software Diagnostics Patterns, Software Diagnostics Services, Software and Philosophy, Systems Theory, Systems Thinking, Testing, The Way of Philip Marlowe, Trace Analysis Patterns, Unified Software Diagnostics, Webinars | No Comments »
Friday, July 13th, 2012
For some time I was struggling with finding a good name for memory dump and software trace analysis activities. The name Memoretics I use for the science of memory dump analysis (that also incorporates software traces) seems not so good to describe the whole practical activity that should be transparent to everyone in IT. Fortunately, I timely understood that all these activities constitute the essence of software diagnostics that previously lacked any solid foundation. Thus, Software Diagnostics Institute was reborn from the previous Crash Dump Analysis Portal. This institute does pure and applied research and scientific activities and in recent years was funded mainly from OpenTask publisher and recently from Memory Dump Analysis Services. The latter company also recognized that the broadening of its commercial activities requires a new name. So, Software Diagnostics Services was reborn:
The First Comprehensive Software Diagnostics Service
- Dmitry Vostokov @ DumpAnalysis.org + TraceAnalysis.org -
Posted in Announcements, Cloud Memory Dump Analysis, Complete Memory Dump Analysis, Core Dump Analysis, Crash Analysis Report Environment (CARE), Crash Dump Analysis, Debugging, Debugging Bureau, Debugging Industry, Debugging Methodology, Debugging Today, Debugging Trends, Education, Education and Research, Escalation Engineering, Event Tracing for Windows (ETW), First Fault Software Diagnostics, Generative Debugging, JIT Crash Analysis, JIT Memory Space Analysis, Java Debugging, Kernel Development, Kernel Memory Dump Analysis, Linux Crash Corner, MFC Debugging, Mac Crash Corner, Mac OS X, Malware Analysis, Memoretics, Memory Analysis Forensics and Intelligence, Memory Analysis Report System, Memory Dump Analysis Methodology, Memory Dump Analysis Services, Minidump Analysis, New Debugging School, Pattern-Driven Debugging, Pattern-Driven Software Support, Performance Monitoring, Root Cause Analysis, SQL Debugging, Security, Software Debugging Services, Software Diagnostics, Software Diagnostics Institute, Software Diagnostics Services, Software Engineering, Software Problem Solving, Software Technical Support, Software Trace Analysis, Software Trace Analysis Report Environment (STARE), Tools, Training and Seminars, Troubleshooting Methodology, Unified Software Diagnostics, Windows 7, Windows 8, Windows Azure, Windows Mobile, Windows Server 2008, Windows System Administration, x64 Mac OS X, x64 Windows | No Comments »
Saturday, June 23rd, 2012
Counter Value pattern covers performance monitoring and its logs. A counter value is some variable in memory, for example, a module variable, that is updated periodically to reflect some aspect of state or it can be calculated from different such variables and presented in trace messages. Such messages can also be organized in a similar format as ETW based traces we usually consider as examples for our trace patterns:
Source  PID TID   Function         Value

=================================================

[…]

System    0   0   Committed Memory 12,002,234,654

Process 844   0   Private Bytes    345,206,456

System    0   0   Committed Memory 12,002,236,654

Process 844   0   Working Set      122,160,068

[…]
Therefore, all other trace patterns such as adjoint thread (can be visualized via different colors on a graph), focus of tracing, characteristic message block (for graphs), activity region, significant event, and others can be applicable here. There are also some specific patterns such as global monotonicity and constant value that we discuss with examples in subsequent parts.
- Dmitry Vostokov @ DumpAnalysis.org + TraceAnalysis.org -
Posted in Performance Monitoring, Software Diagnostics, Software Trace Analysis, Software Trace Reading, Software Trace Visualization, Trace Analysis Patterns | No Comments »