Archive for the ‘Software Narrative Fiction’ Category
Tuesday, March 17th, 2015
Trace Mask is a superposition of two (or many) different traces. This is different from Inter-Correlation pattern where we may only search for certain messages without the synthesis of a new log. The most useful Trace Mask is when we have different time scales (or significantly different Trace Currents). Then we impose an additional structure on the one of the traces:
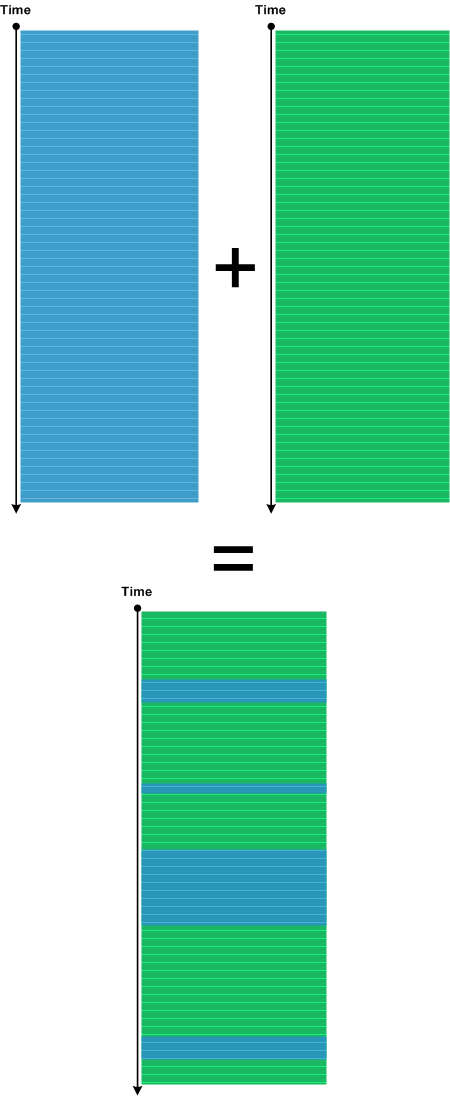
We got the idea from Narrative Masks discussed in Miroslav Drozda’s book “Narativní masky ruské prózy” (”Narrative Masks in Russian Prose”).
The very simple example of Trace Mask is shown in Debugging TV Episode 0×15.
- Dmitry Vostokov @ DumpAnalysis.org + TraceAnalysis.org -
Posted in Software Narrative Fiction, Software Narratology, Software Trace Analysis, Software Trace Reading, Trace Analysis Patterns | 1 Comment »
Sunday, April 15th, 2012
In a week this short full color book should appear in online bookstores:
- Title: Software Narratology: An Introduction to the Applied Science of Software Stories
- Authors: Dmitry Vostokov, Memory Dump Analysis Services
- Description: This is a transcript of Memory Dump Analysis Services Webinar about Software Narratology: an exciting new discipline and a field of research founded by DumpAnalysis.org. When software executes it gives us its stories in the form of UI events, software traces and logs. Such stories can be analyzed for their structure and patterns for troubleshooting, debugging and problem resolution purposes. Topics also include software narremes and their types, anticipatory software construction and software diagnostics.
- Publisher: OpenTask (April 2012)
- Language: English
- Product Dimensions: 28.0 x 21.6
- Paperback: 26 pages
- ISBN-13: 978-1908043078

- Dmitry Vostokov @ DumpAnalysis.org + TraceAnalysis.org -
Posted in Announcements, Books, CDF Analysis Tips and Tricks, Code Reading, Computer Science, Debugging, Debugging Methodology, Debugging Trends, Education and Research, Escalation Engineering, Event Tracing for Windows (ETW), Hermeneutics of Memory Dumps and Traces, Ideas, Narralog Programming Language, New Debugging School, Pattern-Driven Debugging, Pattern-Driven Software Support, Presentations, Publishing, Root Cause Analysis, SPDL, Science of Software Tracing, Software Behavior DNA, Software Behavior Patterns, Software Behavioral Genome, Software Diagnostics, Software Engineering, Software Narrative Fiction, Software Narrative Science, Software Narratology, Software Narremes, Software Problem Description Patterns, Software Problem Solving, Software Technical Support, Software Trace Analysis, Software Trace Analysis and History, Software Trace Deconstruction, Software Trace Linguistics, Software Trace Modeling, Software Trace Reading, Software Trace Visualization, Software Tracing Implementation Patterns, Software Troubleshooting Patterns, Structural Trace Patterns, Systems Thinking, Testing, Tools, Trace Analysis Patterns, Training and Seminars, Troubleshooting Methodology, UI Problem Analysis Patterns, Unified Debugging Patterns, Unified Software Diagnostics, Webinars | No Comments »
Sunday, February 19th, 2012
Memory Dump Analysis Services (DumpAnalysis.com) organizes a free Webinar about software narratology: an application of ideas from narratology to software narrative stories.

Learn about this exciting new discipline and a field of research. When software executes it gives us its stories in the form of UI events, software traces and logs. Such stories can be analyzed for their structure and patterns for troubleshooting, debugging and problem resolution purposes.
Prerequisites: basic software troubleshooting and ability to read software generated logs.
Audience: anyone can benefit from this new perspective: from software users to software engineers and managers.
Space is limited.
Reserve your Webinar seat now at:
https://www3.gotomeeting.com/register/603136294
- Dmitry Vostokov @ DumpAnalysis.org + TraceAnalysis.org -
Posted in Announcements, Computer Science, Debugging, Escalation Engineering, Intelligence Analysis Patterns, Memory Dump Analysis Services, SPDL, Science of Software Tracing, Security, Software Behavior DNA, Software Behavior Patterns, Software Behavioral Genome, Software Engineering, Software Narrative Fiction, Software Narratology, Software Problem Description Patterns, Software Problem Solving, Software Technical Support, Software Trace Analysis, Software Trace Deconstruction, Software Trace Linguistics, Software Trace Modeling, Software Trace Reading, Software Trace Visualization, Software Tracing Implementation Patterns, Software Tracing for Dummies, Software Troubleshooting Patterns, Software Victimology, Structural Trace Patterns, Testing, Tools, Trace Analysis Patterns, Troubleshooting Methodology, UI Problem Analysis Patterns, Unified Debugging Patterns, Unit Testing, Victimware, Webinars, Windows System Administration | No Comments »
Friday, February 17th, 2012
In narratology anti-narrative denotes a narrative having sequences of events impossible in reality. In software traces such sequences usually depict abnormal software behaviour. Here are some parallels with corresponding trace analysis patterns:
Fiction                             | Software Trace

================================================

Repeated unrepeatable       | Periodic Error (?)

Denarration (erasure)            | No Activity / Incomplete History

Chronological contradiction | Impossible Trace
Question mark means that possibly another pattern is needed there.
- Dmitry Vostokov @ DumpAnalysis.org + TraceAnalysis.org -
Posted in Crash Dump Analysis, Crash Dump Patterns, Debugging, Software Behavior Patterns, Software Narrative Fiction, Software Narratology, Software Trace Analysis, Trace Analysis Patterns | No Comments »
Monday, February 13th, 2012
Any DA+TA source (dump artifact + trace artifact) can be used to generate and validate narrative fiction where memory dump components provide fiction structure and software trace components provide behaviour (plot and story):
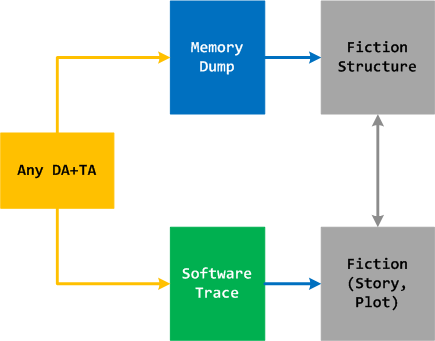
I already use such help in writing fiction books http://www.opentask.com/fiction-titles (”computational” novels) and use trace analysis patterns in validating historical narratives http://www.opentask.com/history-titles (with Excel and software trace viewers as tools). Here fiction is in no way different from software fictions outlined in the article about software stories. Please also note 2 other fields along with software narratology (SN was defined in mid 2009 where the first pattern appeared earlier in 2009) that are under development: software chorology and chorography. Adjoint threads and trace analysis patterns are the major contributions from SN.
Final note: Because we consider memory dumps in a general sense (e.g. philosophy of memoidealism where any data is a memory dump) and software trace narremes as small memory dumps (mid 2009) any data stream potentially can be represented as some fictional or real story. And vice versa, any story can be transformed into corresponding computer memory dumps and software traces (for example, the narralog language is being designed to model software stories).
- Dmitry Vostokov @ DumpAnalysis.org + TraceAnalysis.org -
Posted in Announcements, Fiction, General Memory Analysis, Memory Dump Fiction, Software Narrative Fiction, Software Narratology, Writing | No Comments »
Thursday, February 2nd, 2012
Forthcoming Accelerated Software Trace Analysis training requires extensive real life like software logs with multiple software behaviour patterns. The similar accelerated memory dump analysis trainings (unmanaged / native Windows and .NET) also required good memory dumps but this problem was solved by modeling patterns of abnormal software behaviour in an appropriate implementation language such as C++ and C#. Modeling software traces with hundreds of software components, processes and threads would require enormous programming efforts. Therefore, the natural approach is to describe a desired software trace in some declarative language (or minimally imperative) and get a million line software log that models a specific combination of trace analysis patterns. So, welcome to such a language called Narralog: Software Narrative Log or Narrative Logic. Please note that this language is different from Riemann programming language which is a language to describe software problems and generate software problem solving tools. Language details and whether a kind of a Metadefect Template Library will be used to implement Narralog or simple macroprogramming is suffice will be decided and announced when we further develop our training.
- Dmitry Vostokov @ DumpAnalysis.org + TraceAnalysis.org -
Posted in Metadefect Template Library, Narralog Programming Language, Riemann Programming Language, SPDL, Software Behavior DNA, Software Behavior Patterns, Software Behavioral Genome, Software Defect Construction, Software Engineering, Software Narrative Fiction, Software Narratology, Software Problem Solving, Software Trace Analysis, Software Trace Modeling, Software and Modeling, Trace Analysis Patterns | No Comments »
Wednesday, May 11th, 2011
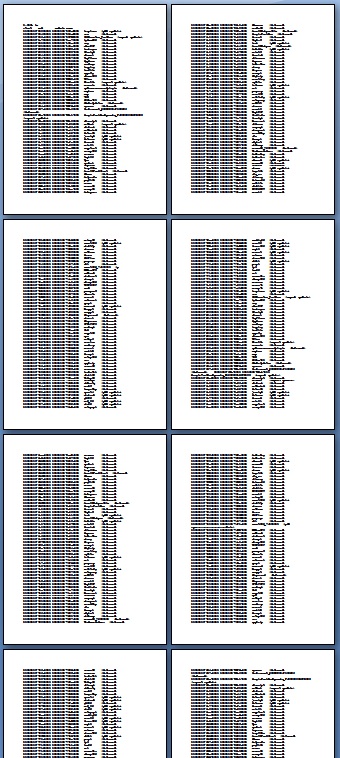
In this series we start with our analysis of monsters in the realm of computer memory, software defects, malware, corrupt software structures and their various behaviour. Some of monsters are based on exaggerated crash dump and software trace patterns, some are based on the accumulated debugging and technical support wisdom. The first monster we present today is called Chimera and it lives in DLL Hell. It is based on a exaggerated pattern called Module Variety. When opening a 64-bit memory dump it shows several pages of modules (lm WinDbg command):
As the monster’s creator explained to me they used an experimental way to represent every class object as a loaded component. And it was a word processor where every paragraph, every sentence, every word and every letter was an object implemented in a separate module! The goal was to have any letter literally dance on a screen if necessary.
- Dmitry Vostokov @ DumpAnalysis.org + TraceAnalysis.org -
Posted in Computer Memory Monsters, Fun with Crash Dumps, Fun with Debugging, Fun with Malware, Horrors of Computation, Memory Dump Fiction, Software Narrative Fiction | No Comments »
Friday, December 17th, 2010
As the new decade is approaching (2011-2020) we would like to make a few previews and predictions:
- Increased complexity of software will bring more methods from biological, social sciences and humanities in addition to existing methods of automated debugging and computer science techniques
- Focus on first fault software problem solving (when aspect)
- Focus on pattern-driven software problem solving (how aspect)
- Fusion of debugging and malware analysis into a unified structural and behavioral pattern framework
- Visual debugging, memory and software trace visualization techniques
- Software maintenance certification
- Focus on domain-driven troubleshooting and debugging tools as a service (debugware TaaS)
- Focus on security issues related to memory dumps and software traces
- New scripting languages and programming language extensions for debugging
- The maturation of the science of memory snapshots and software traces (memoretics)
Imagining is not not limited to the above and more to come and explain in the forthcoming parts.
- Dmitry Vostokov @ DumpAnalysis.org + TraceAnalysis.org -
Posted in Announcements, Anthropology, Archaeology of Computer Memory, Biology, Certification, Computer Science, Countefactual Debugging, Crash Analysis Report Environment (CARE), Crash Dump Analysis, Crash Dump Patterns, DebugWare Patterns, Debugging, Debugging Industry, Debugging Methodology, Debugging Trends, Dublin School of Security, EasyDbg, Economics, Escalation Engineering, Evolution, First Fault Problem Solving, Futuristic Memory Dump Analysis, General Memory Analysis, General Science, Geography, Hardware, Hermeneutics of Memory Dumps and Traces, History, Humanities, Language, Laws of Troubleshooting and Debugging, Logic, Malware Analysis, Malware Patterns, Mathematics of Debugging, Memiotics (Memory Semiotics), Memoretics, Memory Analysis Forensics and Intelligence, Memory Analysis Report System, Memory Dump Analysis and History, Memory Systems Language, Memory Visualization, Paleo-debugging, Pattern Models, Pattern Prediction, Physics, Psychology, Publishing, Science of Memory Dump Analysis, Science of Software Tracing, Security, Social Media, Social Sciences, Software Architecture, Software Behavior Patterns, Software Chorography, Software Chorology, Software Defect Construction, Software Engineering, Software Generalist, Software Maintenance Institute, Software Narrative Fiction, Software Narratology, Software Technical Support, Software Trace Analysis, Software Trace Analysis and History, Software Trace Deconstruction, Software Trace Linguistics, Software Trace Visualization, Software Troubleshooting Patterns, Software Victimology, Statistics, Structural Memory Analysis and Social Sciences, Structural Memory Patterns, Structural Trace Patterns, Systems Thinking, Testing, Tools, Trace Analysis Patterns, Troubleshooting Methodology, Unified Debugging Patterns, Uses of UML, Victimware, Virtualization, Visual Dump Analysis, Windows System Administration, Workaround Patterns | No Comments »
Monday, November 15th, 2010
This is a synthesized case study with the simplified ETW trace output based on real events (consider it as an exercise in a software narrative fiction). In a client-server environment a server session was always active regardless of whether a client was active or not. There was a workaround to enable a registry key to force checking for user activity via CheckActivity registry key. Unfortunately this didn’t help and a software trace was recorded for the offline analysis. First, we checked for Basic Facts and found the correspondence that confirmed the registry key setting:
#      PID  TID  Message

[...]

3200   1428 5476 CheckActivity = 1

[...]
There was also Periodic Errors throughout the whole trace fabric:
#       PID  TID  Message

[...]

119097  2468 476  Security check failed

[...]
Although such errors happened in a number of support incidents we see a message text we have never seen and couldn’t even find in our database of incidents (Defamiliarizing Effect):
#      PID  TID  Message

[...]

119090 2468 476  Calling the third party security information provider

119091 2468 476  Get security information: failed

[...]
Therefore we advised to test with the 3rd party security provider disabled. The software story continues…
- Dmitry Vostokov @ DumpAnalysis.org + TraceAnalysis.org -
Posted in CDF Analysis Tips and Tricks, Debugging, Software Narrative Fiction, Software Trace Analysis, Trace Analysis Patterns | No Comments »