Who calls the postmortem debugger?
Monday, April 30th, 2007I was trying to understand who calls dwwin.exe, the part of Windows Error Reporting on my Windows XP system when the crash happens. To find an answer I launched TestDefaultDebugger application and after pushing its crash button the following familiar WER dialog box appeared:
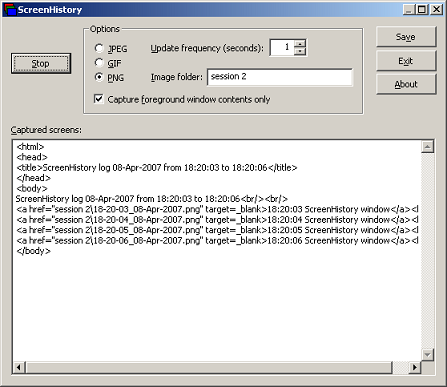
I repeated the same when running ProcessHistory in the background and looking at its log I found that the parent process for dwwin.exe and postmortem debugger (if we click on Debug button) was TestDefaultDebugger.exe. In my case the default postmortem debugger was drwtsn32.exe. To look inside I attached WinDbg to TestDefaultDebugger process when WER dialog box above was displayed and got the following stack trace:
0:000> k

ChildEBP RetAddr

0012d318 7c90e9ab ntdll!KiFastSystemCallRet

0012d31c 7c8094e2 ntdll!ZwWaitForMultipleObjects+0xc

0012d3b8 7c80a075 kernel32!WaitForMultipleObjectsEx+0x12c

0012d3d4 6945763c kernel32!WaitForMultipleObjects+0x18

0012dd68 694582b1 faultrep!StartDWException+0×5df

0012eddc 7c8633e9 faultrep!ReportFault+0×533

0012f47c 00411eaa kernel32!UnhandledExceptionFilter+0×587

0012f49c 0040e879 TestDefaultDebugger+0×11eaa

0012ffc0 7c816fd7 TestDefaultDebugger+0xe879

0012fff0 00000000 kernel32!BaseProcessStart+0×23
The combination of StartDWException and WaitForMultipleObjects suggests that dwwin.exe process is started there. Indeed, when I disassembled StartDWException function I saw CreateProcess call just before the wait call:
0:000> uf faultrep!StartDWException

...

...

...

69457585 8d8568f7ffff    lea     eax,[ebp-898h]

6945758b 50              push    eax

6945758c 8d8524f7ffff    lea     eax,[ebp-8DCh]

69457592 50              push    eax

69457593 8d85d4fbffff    lea     eax,[ebp-42Ch]

69457599 50              push    eax

6945759a 33c0            xor     eax,eax

6945759c 50              push    eax

6945759d 6820000004      push    4000020h

694575a2 6a01            push    1

694575a4 50              push    eax

694575a5 50              push    eax

694575a6 ffb5a4f7ffff    push    dword ptr [ebp-85Ch]

694575ac 50              push    eax

694575ad ff1558114569    call    dword ptr [faultrep!_imp__CreateProcessW (69451158)]

…

…

…
The second parameter of CreateProcess, [ebp-85Ch], is the address of the process command line and we know EBP value from the call stack above, 0012dd68. Just to remind that parameters for Win32 API functions are pushed from right to left. So we get the command line straight away:
0:000> dpu 0012dd68-85Ch l1

0012d50c  0012d3ec "C:\WINDOWS\system32\dwwin.exe -x -s 208"
If we dismiss WER dialog by clicking on Debug button then the postmortem debugger starts. Also it starts without WER dialog displayed if we rename faultrep.dll beforehand. So it looks like the obvious place to look for postmortem debugger launch is UnhandledExceptionFilter. Indeed, we see it there:
0:000> uf kernel32!UnhandledExceptionFilter

...

...

...

7c8636a8 8d850cfaffff    lea     eax,[ebp-5F4h]

7c8636ae 50              push    eax

7c8636af 8d857cf9ffff    lea     eax,[ebp-684h]

7c8636b5 50              push    eax

7c8636b6 33c0            xor     eax,eax

7c8636b8 50              push    eax

7c8636b9 50              push    eax

7c8636ba 50              push    eax

7c8636bb 6a01            push    1

7c8636bd 50              push    eax

7c8636be 50              push    eax

7c8636bf 53              push    ebx

7c8636c0 50              push    eax

7c8636c1 e86cecf9ff      call    kernel32!CreateProcessW (7c802332)

…

…

…
Because this is the code that yet to be executed we need to put a breakpoint at 7c8636c1, continue execution, and when the breakpoint is hit dump the second parameter to CreateProcess that is the memory EBX points to:
0:000> bp 7c8636c1

0:000> g

Breakpoint 0 hit

eax=00000000 ebx=0012ed78 ecx=0012ec70 edx=7c90eb94 esi=0000003a edi=00000000

eip=7c8636c1 esp=0012ed50 ebp=0012f47c iopl=0 nv up ei pl zr na pe nc

cs=001b  ss=0023  ds=0023  es=0023  fs=003b  gs=0000 efl=00000246

kernel32!UnhandledExceptionFilter+0x84b:

7c8636c1 e86cecf9ff      call    kernel32!CreateProcessW (7c802332)

0:000> du @ebx

0012ed78  “c:\drwatson\drwtsn32 -p 656 -e 1″

0012edb8  “72 -g”
You see that UnhandledExceptionFilter is about to launch my custom Dr. Watson postmortem debugger.
If you look further at UnhandledExceptionFilter disassembled code you would see that after creating postmortem debugger process and waiting for it to finish saving the process dump the function calls NtTerminateProcess.
Therefore all error reporting, calling the postmortem debugger and final process termination are done in the same process that had the exception. The latter two parts are also described in Matt Pietrek’s article as I found afterwards.
One addition to that article written in 1997: starting from Windows XP UnhandledExceptionFilter locates and loads faultrep.dll which launches dwwin.exe to report an error:
kernel32!UnhandledExceptionFilter+0x4f7:

7c863359 8d85acfaffff    lea     eax,[ebp-554h]

7c86335f 50              push    eax

7c863360 8d8570faffff    lea     eax,[ebp-590h]

7c863366 50              push    eax

7c863367 56              push    esi

7c863368 56              push    esi

7c863369 e8fbacfaff      call    kernel32!LdrLoadDll (7c80e069)

0:000> dt _UNICODE_STRING 0012f47c-590

 "C:\WINDOWS\system32\faultrep.dll"

   +0x000 Length           : 0x40

   +0x002 MaximumLength    : 0x100

   +0x004 Buffer           : 0x0012f360  "C:\WINDOWS\system32\faultrep.dll"
You can also see that all processing is done using the same thread stack. So if something is wrong with that stack then you have silent process termination and no error is reported. In Vista there are some improvements that I’m going to cover in detail in a separate post.
- Dmitry Vostokov -
