Trace Analysis Patterns (Part 266)
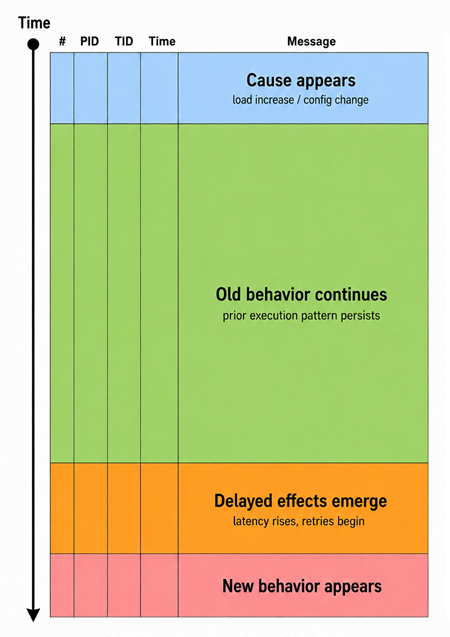
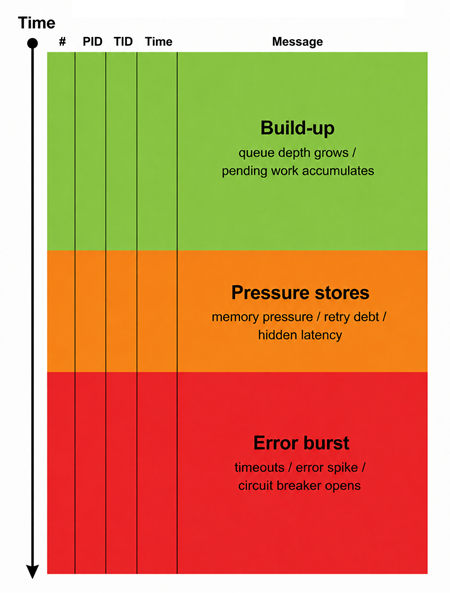
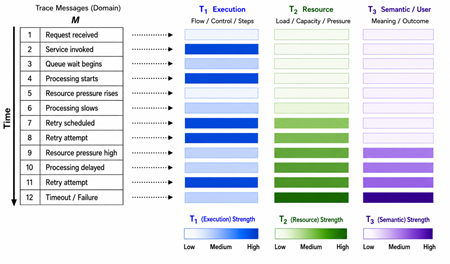
Monday, July 13th, 2026The Trace Multiphysics analysis pattern applies several Trace Fields to the same sequence of trace messages and studies both their individual strengths and their interactions. A Trace Field associates every message in a trace domain M with a value in some analytical range T. Although the field is defined over M, its values need not be extracted solely from that trace. A value may be derived from the message itself, inferred from its surrounding context, or assigned using correlated evidence from other traces, logs, metrics, memory dumps, snapshots, models, or external knowledge sources. The value does not need to be numerical, although numerical or ordered values are useful when field strength must be visualized. For example, one field may represent execution significance, another resource pressure, and a third semantic or user-visible importance:
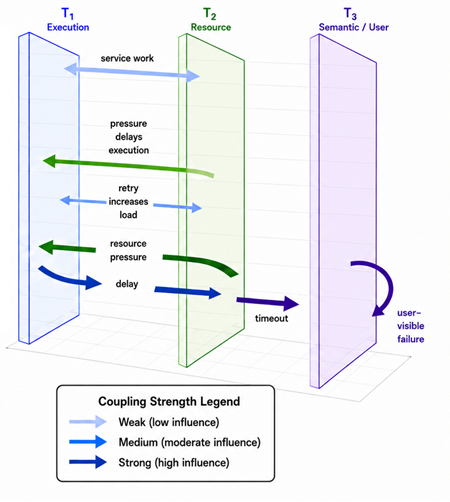
However, Trace Multiphysics is not merely the display of several independent Trace Fields: its essential feature is their coupling. A change in one field may affect another field. For example, increased resource pressure may slow execution. Slower execution may trigger retries. Repeated retries may further increase resource pressure. Eventually, the combined effect may change the semantic or user-visible outcome. The coupling diagram represents these relationships, and arrow thickness indicates coupling strength:
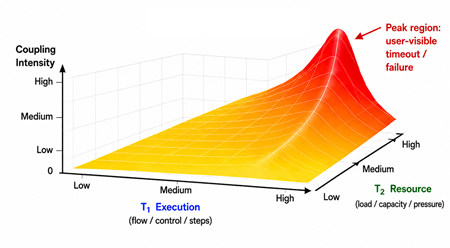
A simple conceptual form is: Cij(m)=g(fi(m), fj(m), Rij(m)), where fi: M → Ti and fj: M → Tj, fi(m) and fj(m) are the strengths or values of fields i and j at message m, Cij(m) is the coupling between fields i and j at message m, and Rij(m) represents evidence of an interaction between the two fields, obtained from the trace itself or from correlated diagnostic sources. This formula defines coupling at message m. More generally, a coupling may relate field values at different messages when the influence is delayed or propagated through the trace: Cij(ma, mb)=g(fi(ma), fj(mb), Rij(ma, mb)), where ma ⪯ mb. Here, Rij(ma, mb) represents evidence relating the value fi(ma) of field i to the value fj(mb) of field j, whether that evidence is contained in the primary trace or supplied through correlated artifacts. High values in two fields do not automatically establish strong coupling. The available diagnostic evidence must also support the conclusion that one field influences, constrains, amplifies, transforms, or explains the other. Such evidence may occur in the primary trace or in correlated traces, logs, metrics, snapshots, models, or other diagnostic artifacts:
The mapping fi is defined over the trace domain M, but its construction may depend on evidence outside M. A more explicit form is: fi(m) = hi(m, Ei(m)), where Ei(m) is the evidence associated with message m. This evidence may come from the message itself, nearby messages, other traces or logs, metrics, snapshots, memory dumps, learned models, or other correlated diagnostic sources. Correlation may be established through timestamps, identifiers, causal links, shared entities, execution context, or other relations.
When no ordinary field value can be assigned, Ti may include special values representing unknown, unavailable, or not applicable, preserving the definition of the field over the complete trace domain.
In computational modeling, multiphysics simulation studies several aspects of a physical system and their interactions simultaneously. A model may combine thermal, structural, fluid, electromagnetic, or other processes, together with the coupling and boundary conditions between them. Trace Multiphysics transfers this structural principle to software diagnostics. The analogy does not imply that all software behavior should be described by physical equations. Instead, it provides a disciplined way to analyze several interacting dimensions without reducing the incident to one isolated perspective.
The connection is especially appropriate in software diagnostics because software can be its own model. Software execution states and execution artifacts can be copied, preserved, replayed, or analyzed independently. Traces, logs, metrics, memory dumps, and snapshots are symbolic and digital artifacts produced by the software system itself. In this diagnostic sense, software performs a form of self-simulation: its execution generates artifacts that model selected aspects of its own structure and behavior. A trace is not a complete reproduction of the running system. It is a selective, instrumented self-model. Different Trace Fields map messages in that self-model to values in different analytical ranges, each representing a distinct analytical dimension. Some values may be extracted directly from the trace, while others may be inferred, enriched, or projected from correlated traces, logs, metrics, memory dumps, snapshots, models, or external knowledge. Trace Multiphysics studies those fields together and examines how they interact. Thus, multiphysics simulation models several interacting physical processes, whereas Trace Multiphysics analyzes several interacting fields defined over a software-generated model of software behavior and potentially enriched from other diagnostic sources.
Trace Field provides the foundational assignment or mapping from trace messages to values in one analytical range. The field is defined over a selected trace domain, but the evidence used to assign its values may originate inside or outside that domain. Trace Multiphysics extends this principle by applying several Trace Fields to the same trace domain and analyzing their simultaneous values, changing strengths, overlap at individual messages, dependencies, feedback loops, coupling strengths, and combined explanatory effects. The relationship can be summarized as follows: Trace Field maps trace messages to values in one analytical range, while Trace Multiphysics studies several coupled Trace Fields defined over the same trace domain, with their values potentially derived from or enriched by evidence from multiple diagnostic sources.
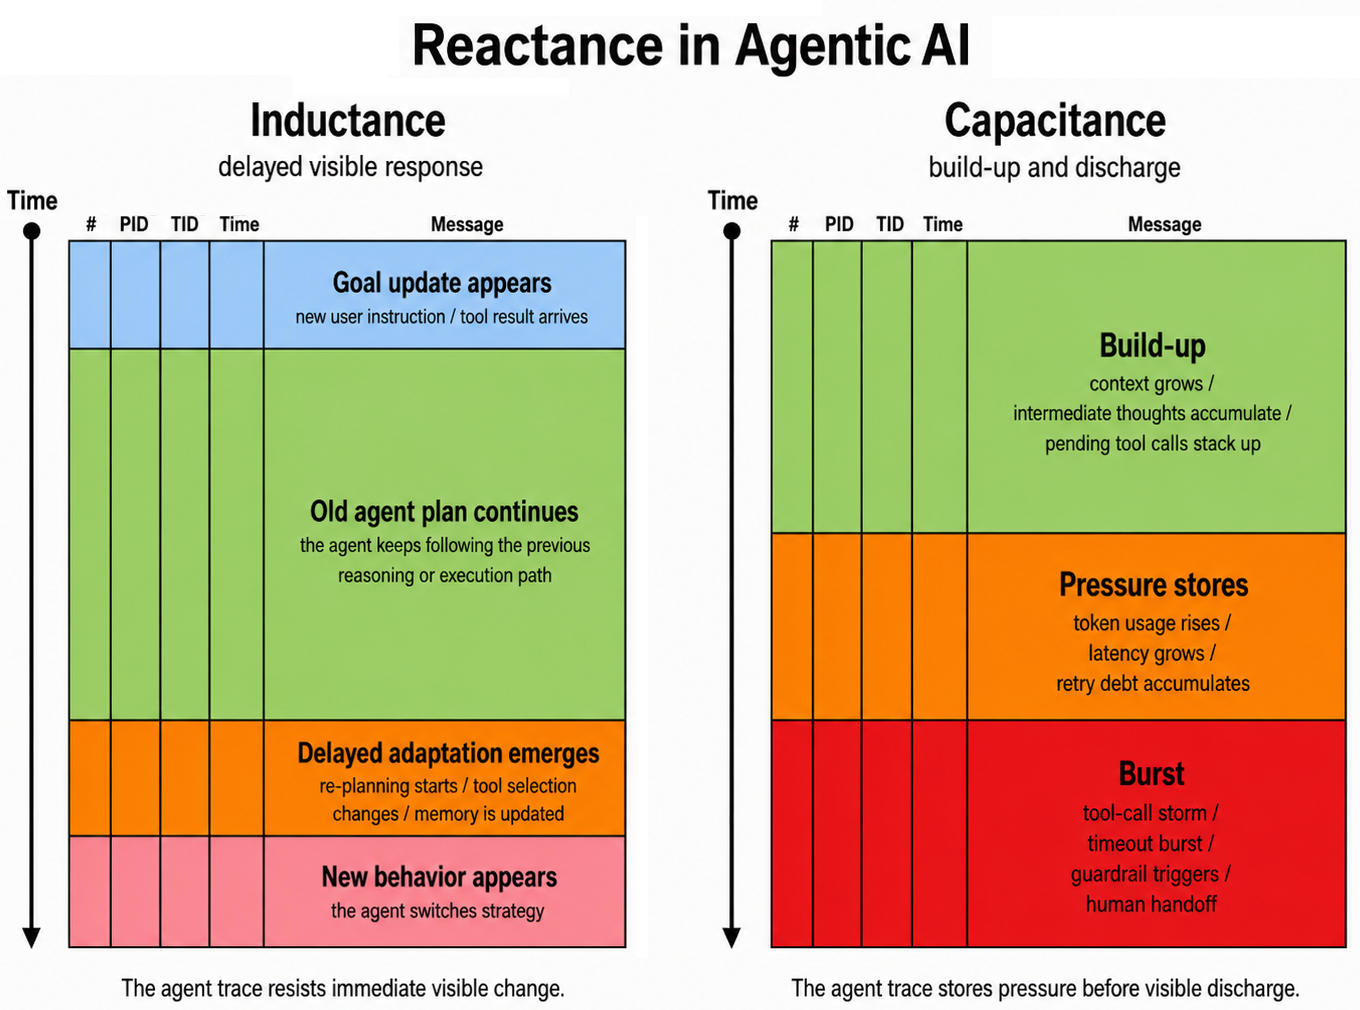
Trace Multiphysics also connects to several recent analysis patterns. In Trace Reactance, inductive and capacitive effects can be understood as specific forms of inter-field coupling and temporal distortion produced by interacting state fields. Karnaugh Map is also multidimensional but primarily Boolean and combinatorial, whereas Trace Multiphysics accommodates continuous or graded fields, propagation, and feedback loops. Trace World may provide a broader shared diagnostic context in which coupled Trace Fields are interpreted. Bethe Ansatz is a constrained form of Trace Multiphysics in which global behavior is reconstructed from composable pairwise interaction motives.
The pattern is particularly relevant to AI/ML and agentic AI systems. Multiphysics approaches in machine learning usually apply ML to coupled physical processes or incorporate multiple physical priors into learning. Multiphysics-Inspired AI/ML Observability and Diagnostics, by contrast, treats the AI/ML system itself as a collection of interacting analytical fields, including data, optimization, information, computation, uncertainty, control, and semantic outcome fields, defined over a common trace domain constructed from correlated training, inference, and operational events. Its observability aspect concerns the instrumentation, correlation, and enrichment required to construct these fields from training logs, model evaluations, infrastructure metrics, distributed traces, tool-call records, user interactions, safety assessments, and other evidence sources. Its diagnostic aspect concerns how fields interact through their values and couplings, how disturbances propagate across fields, how feedback loops emerge among them, and how their combined effects produce system-level behavior.
In an agentic AI system, for example, increased tool latency may cause retries. Retries may enlarge the accumulated context and increase computational pressure. Context growth may change the relative prominence of relevant information and increase uncertainty, affecting planning, tool selection, and the final semantic outcome. A degraded outcome may provoke further retries, creating a reinforcing feedback loop. Observability provides the correlated evidence needed to construct, expose, and track these fields, while diagnostics analyzes their values and couplings to explain the resulting agent behavior. The behavior cannot be explained adequately by any one field in isolation.
In summary, Trace Multiphysics is a trace and log analysis pattern that examines several Trace Fields defined over the same trace domain, whether their values are derived from that trace alone or assigned using correlated evidence from other diagnostic sources. It studies the immediate, delayed, reinforcing, constraining, transforming, and explanatory couplings through which their combined behavior emerges. Multiphysics-Inspired AI/ML Observability and Diagnostics extends this principle to AI/ML and agentic systems: observability constructs and exposes the relevant fields from distributed evidence, while diagnostics analyzes their interactions and explains the emergent system behavior.
- Dmitry Vostokov @ DumpAnalysis.org + TraceAnalysis.org -