Archive for the ‘Virtualization’ Category
Monday, May 27th, 2019
The advent of virtualization simplified the debugging of complex issues by allowing to save the snapshot of the execution environment and then resume it from the save point of execution. This allows continuing tracing using a different set of environmental conditions and input data. New tracing continuations constitute a network that we call Polytrace:
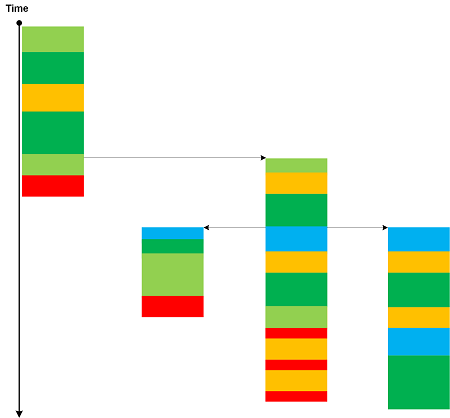
Bifurcation Point for two identical trace beginnings may be considered as an example of a simple Polytrace.
- Dmitry Vostokov @ DumpAnalysis.org + TraceAnalysis.org -
Posted in Log Analysis, Software Trace Analysis, Trace Analysis Patterns, Virtualization | 1 Comment »
Friday, November 11th, 2011
This is a name for a virtual country where I’m a virtual citizen. This coined word is the latest addition to Citrixware and Citrixofication together with I Love Citrix social media logo.
- Dmitry Vostokov @ DumpAnalysis.org + TraceAnalysis.org -
Posted in Citrix, Cloud Computing, History, New Words, Social Media, Virtualization | No Comments »
Wednesday, September 21st, 2011
Memoretics as a science of memory snapshots borrows many ideas from the following disciplines (the list is not exhaustive):
- Troubleshooting and Debugging
- Intelligence Analysis
- Critical Thinking
- Forensics
- Linguistics
- Archaeology
- Psychoanalysis
- History
- Mathematics: Sets and Categories
- Literary Criticism and Narratology
It also contributes many ideas back. The following diagram depicts such an interaction:

- Dmitry Vostokov @ DumpAnalysis.org + TraceAnalysis.org -
Posted in Archaeology of Computer Memory, Categorical Debugging, Computer Forensics, Computer Science, Countefactual Debugging, Crash Dump Analysis, Crash Dump De-analysis, Crash Dump Patterns, Debugging, Debugging Methodology, Dublin School of Security, Education and Research, Escalation Engineering, General Memory Analysis, Generative Debugging, Hermeneutics of Memory Dumps and Traces, History, Intelligence Analysis Patterns, M->analysis, Malware Analysis, Malware Patterns, Mathematics of Debugging, Memiotics (Memory Semiotics), Memoretics, Memory Analysis Forensics and Intelligence, Memory Dump Analysis and History, Memory Systems Language, Memory Visualization, Metadefect Template Library, Metamalware, New Debugging School, Paleo-debugging, Pattern Models, Pattern Prediction, Psychoanalysis of Software Maintenance and Support, Psychology, Reverse Engineering, Root Cause Analysis, Science of Memory Dump Analysis, Science of Software Tracing, Security, Software Architecture, Software Behavior DNA, Software Behavior Patterns, Software Behavioral Genome, Software Chorography, Software Chorology, Software Defect Construction, Software Engineering, Software Narratology, Software Technical Support, Software Trace Analysis, Software Trace Analysis and History, Software Trace Deconstruction, Software Trace Linguistics, Software Trace Reading, Software Trace Visualization, Software Tracing Implementation Patterns, Software Troubleshooting Patterns, Software Victimology, Software and History, Structural Memory Analysis and Social Sciences, Structural Memory Patterns, Structural Trace Patterns, Systems Thinking, Testing, Tools, Trace Analysis Patterns, Troubleshooting Methodology, UI Problem Analysis Patterns, Unified Debugging Patterns, Victimware, Virtualization, Visual Dump Analysis, Workaround Patterns | No Comments »
Friday, December 17th, 2010
As the new decade is approaching (2011-2020) we would like to make a few previews and predictions:
- Increased complexity of software will bring more methods from biological, social sciences and humanities in addition to existing methods of automated debugging and computer science techniques
- Focus on first fault software problem solving (when aspect)
- Focus on pattern-driven software problem solving (how aspect)
- Fusion of debugging and malware analysis into a unified structural and behavioral pattern framework
- Visual debugging, memory and software trace visualization techniques
- Software maintenance certification
- Focus on domain-driven troubleshooting and debugging tools as a service (debugware TaaS)
- Focus on security issues related to memory dumps and software traces
- New scripting languages and programming language extensions for debugging
- The maturation of the science of memory snapshots and software traces (memoretics)
Imagining is not not limited to the above and more to come and explain in the forthcoming parts.
- Dmitry Vostokov @ DumpAnalysis.org + TraceAnalysis.org -
Posted in Announcements, Anthropology, Archaeology of Computer Memory, Biology, Certification, Computer Science, Countefactual Debugging, Crash Analysis Report Environment (CARE), Crash Dump Analysis, Crash Dump Patterns, DebugWare Patterns, Debugging, Debugging Industry, Debugging Methodology, Debugging Trends, Dublin School of Security, EasyDbg, Economics, Escalation Engineering, Evolution, First Fault Problem Solving, Futuristic Memory Dump Analysis, General Memory Analysis, General Science, Geography, Hardware, Hermeneutics of Memory Dumps and Traces, History, Humanities, Language, Laws of Troubleshooting and Debugging, Logic, Malware Analysis, Malware Patterns, Mathematics of Debugging, Memiotics (Memory Semiotics), Memoretics, Memory Analysis Forensics and Intelligence, Memory Analysis Report System, Memory Dump Analysis and History, Memory Systems Language, Memory Visualization, Paleo-debugging, Pattern Models, Pattern Prediction, Physics, Psychology, Publishing, Science of Memory Dump Analysis, Science of Software Tracing, Security, Social Media, Social Sciences, Software Architecture, Software Behavior Patterns, Software Chorography, Software Chorology, Software Defect Construction, Software Engineering, Software Generalist, Software Maintenance Institute, Software Narrative Fiction, Software Narratology, Software Technical Support, Software Trace Analysis, Software Trace Analysis and History, Software Trace Deconstruction, Software Trace Linguistics, Software Trace Visualization, Software Troubleshooting Patterns, Software Victimology, Statistics, Structural Memory Analysis and Social Sciences, Structural Memory Patterns, Structural Trace Patterns, Systems Thinking, Testing, Tools, Trace Analysis Patterns, Troubleshooting Methodology, Unified Debugging Patterns, Uses of UML, Victimware, Virtualization, Visual Dump Analysis, Windows System Administration, Workaround Patterns | No Comments »
Friday, November 12th, 2010
Five volumes of cross-disciplinary Anthology (dubbed by the author “The Summa Memorianica”) lay the foundation of the scientific discipline of Memoretics (study of computer memory snapshots and their evolution in time) that is also called Memory Dump and Software Trace Analysis.ca
The 5th volume contains revised, edited, cross-referenced, and thematically organized selected DumpAnalysis.org blog posts about crash dump, software trace analysis and debugging written in February 2010 - October 2010 for software engineers developing and maintaining products on Windows platforms, quality assurance engineers testing software on Windows platforms, technical support and escalation engineers dealing with complex software issues, and security researchers, malware analysts and reverse engineers. The fifth volume features:
- 25 new crash dump analysis patterns
- 11 new pattern interaction case studies (including software tracing)
- 16 new trace analysis patterns
- 7 structural memory patterns
- 4 modeling case studies for memory dump analysis patterns
- Discussion of 3 common analysis mistakes
- Malware analysis case study
- Computer independent architecture of crash analysis report service
- Expanded coverage of software narratology
- Metaphysical and theological implications of memory dump worldview
- More pictures of memory space and physicalist art
- Classification of memory visualization tools
- Memory visualization case studies
- Close reading of the stories of Sherlock Holmes: Dr. Watson’s observational patterns
- Fully cross-referenced with Volume 1, Volume 2, Volume 3, and Volume 4
Product information:
- Title: Memory Dump Analysis Anthology, Volume 5
- Author: Dmitry Vostokov
- Language: English
- Product Dimensions: 22.86 x 15.24
- Paperback: 400 pages
- Publisher: Opentask (10 December 2010)
- ISBN-13: 978-1-906717-96-4
- Hardcover: 400 pages
- Publisher: Opentask (10 December 2010)
- ISBN-13: 978-1-906717-97-1

Back cover features memory space art image Hot Computation: Memory on Fire.
- Dmitry Vostokov @ DumpAnalysis.org + TraceAnalysis.org -
Posted in Aesthetics of Memory Dumps, Announcements, Archaeology of Computer Memory, Art, Assembly Language, Books, C and C++, CDF Analysis Tips and Tricks, Categorical Debugging, Common Mistakes, Complete Memory Dump Analysis, Computer Science, Crash Analysis Report Environment (CARE), Crash Dump Analysis, Crash Dump De-analysis, Crash Dump Patterns, Debugging, Debugging Methodology, Debugging Slang, Deep Down C++, Dr. Watson, Dublin School of Security, Education and Research, Escalation Engineering, Fun with Crash Dumps, Fun with Debugging, Fun with Software Traces, General Memory Analysis, Hermeneutics of Memory Dumps and Traces, Images of Computer Memory, Kernel Development, Malware Analysis, Malware Patterns, Mathematics of Debugging, Memiotics (Memory Semiotics), Memoidealism, Memoretics, Memory Analysis Culture, Memory Analysis Forensics and Intelligence, Memory Analysis Report System, Memory Diagrams, Memory Dreams, Memory Dump Analysis Jobs, Memory Dump Analysis Services, Memory Dump Analysis and History, Memory Dumps in Movies, Memory Dumps in Myths, Memory Religion (Memorianity), Memory Space Art, Memory Systems Language, Memory Visualization, Memory and Glitches, Memuonics, Metaphysical Society of Ireland, Minidump Analysis, Movies and Debugging, Multithreading, Museum of Debugging, Music for Debugging, Music of Computation, New Acronyms, New Words, Paleo-debugging, Pattern Models, Pattern Prediction, Philosophy, Physicalist Art, Psychoanalysis of Software Maintenance and Support, Publishing, Science of Memory Dump Analysis, Science of Software Tracing, Security, Software Architecture, Software Behavior Patterns, Software Chorography, Software Chorology, Software Defect Construction, Software Engineering, Software Generalist, Software Maintenance Institute, Software Narratology, Software Technical Support, Software Trace Analysis, Software Trace Analysis and History, Software Trace Deconstruction, Software Trace Reading, Software Trace Visualization, Software Tracing for Dummies, Software Troubleshooting Patterns, Software Victimology, Stack Trace Collection, Structural Memory Analysis and Social Sciences, Structural Memory Patterns, Structural Trace Patterns, Systems Thinking, Testing, Theology, Tool Objects, Tools, Trace Analysis Patterns, Training and Seminars, Troubleshooting Methodology, Uses of UML, Victimware, Virtualization, Vista, Visual Dump Analysis, Webinars, WinDbg Scripts, WinDbg Tips and Tricks, WinDbg for GDB Users, Windows 7, Windows Server 2008, Windows System Administration, Workaround Patterns, x64 Windows | No Comments »
Saturday, November 6th, 2010
I’m pleased to announce that MDAA, Volume 4 is available in PDF format:
www.dumpanalysis.org/Memory+Dump+Analysis+Anthology+Volume+4
It features:
- 15 new crash dump analysis patterns
- 13 new pattern interaction case studies
- 10 new trace analysis patterns
- 6 new Debugware patterns and case study
- Workaround patterns
- Updated checklist
- Fully cross-referenced with Volume 1, Volume 2 and Volume 3
- Memory visualization tutorials
- Memory space art
Its table of contents is available here:
http://www.dumpanalysis.org/MDAA/MDA-Anthology-V4-TOC.pdf
Paperback and hardcover versions should be available in a week or two. I also started working on Volume 5 that should be available in December.
- Dmitry Vostokov @ DumpAnalysis.org + TraceAnalysis.org -
Posted in .NET Debugging, Aesthetics of Memory Dumps, Announcements, AntiPatterns, Art, Assembly Language, Books, C and C++, CDF Analysis Tips and Tricks, Categorical Debugging, Common Mistakes, Complete Memory Dump Analysis, Computer Science, Countefactual Debugging, Crash Dump Analysis, Crash Dump Patterns, DebugWare Patterns, Debugging, Debugging Slang, Deep Down C++, Education and Research, Escalation Engineering, Fun with Crash Dumps, Fun with Debugging, Images of Computer Memory, Kernel Development, Memiotics (Memory Semiotics), Memoidealism, Memoretics, Memory Space Art, Memory Visualization, Memuonics, Metaphysics of Memory Worldview, Multithreading, Opcodism, Philosophy, Physicalist Art, Publishing, Science Fiction, Science of Memory Dump Analysis, Science of Software Tracing, Security, Software Architecture, Software Behavior Patterns, Software Defect Construction, Software Engineering, Software Narratology, Software Technical Support, Software Trace Analysis, Software Trace Reading, Software Victimology, Stack Trace Collection, Testing, Tools, Trace Analysis Patterns, Troubleshooting Methodology, Uses of UML, Victimware, Virtualization, Vista, Visual Dump Analysis, WinDbg Scripts, WinDbg Tips and Tricks, Windows 7, Windows Server 2008, Windows System Administration, Workaround Patterns, x64 Windows | No Comments »
Sunday, July 18th, 2010

Memory Dump Analysis Services (DumpAnalysis.com) organizes a free webinar
Date: 18th of August 2010
Time: 21:00 (BST) 16:00 (Eastern) 13:00 (Pacific)
Duration: 90 minutes
Topics include:
- User vs. kernel vs. physical (complete) memory space
- Challenges of complete memory dump analysis
- Common WinDbg commands
- Patterns
- Common mistakes
- Fiber bundles
- Hands-on exercise: a complete memory dump analysis
- A guide to DumpAnalysis.org case studies
Prerequisites: working knowledge of basic user process and kernel memory dump analysis or live debugging using WinDbg
The webinar link will be posted before 18th of August on DumpAnalysis.com
- Dmitry Vostokov @ DumpAnalysis.org + TraceAnalysis.org -
Posted in Announcements, Common Mistakes, Common Questions, Complete Memory Dump Analysis, Crash Dump Analysis, Crash Dump Patterns, Debugging, Escalation Engineering, Memory Dump Analysis Services, Pattern Models, Security, Software Architecture, Software Behavior Patterns, Software Defect Construction, Software Engineering, Software Technical Support, Stack Trace Collection, Testing, Tools, Training and Seminars, Troubleshooting Methodology, Virtualization, Vista, Webinars, WinDbg Scripts, WinDbg Tips and Tricks, Windows 7, Windows Server 2008, Windows System Administration, x64 Windows | 1 Comment »
Sunday, April 18th, 2010
OpenTask to offer first 3 volumes of Memory Dump Analysis Anthology in one set:


The set is available exclusively from OpenTask e-Commerce web site starting from June. Individual volumes are also available from Amazon, Barnes & Noble and other bookstores worldwide.
Product information:
- Title: Modern Memory Dump and Software Trace Analysis: Volumes 1-3
- Author: Dmitry Vostokov
- Language: English
- Product Dimensions: 22.86 x 15.24
- Paperback: 1600 pages
- Publisher: Opentask (31 May 2010)
- ISBN-13: 978-1-906717-99-5
Information about individual volumes:
- Dmitry Vostokov @ DumpAnalysis.org + TraceAnalysis.org -
Posted in .NET Debugging, Aesthetics of Memory Dumps, Announcements, AntiPatterns, Art, Assembly Language, Books, Bugchecks Depicted, C and C++, CDA Pattern Classification, CDF Analysis Tips and Tricks, Categorical Debugging, Certification, Citrix, Code Reading, Common Mistakes, Computational Ghosts and Bug Hauntings, Computer Science, Countefactual Debugging, Crash Analysis Report Environment (CARE), Crash Dump Analysis, Crash Dump Patterns, Crash Dumps for Dummies, Data Recovery, DebugWare Patterns, Debugging, Debugging Methodology, Debugging Slang, Deep Down C++, Dictionary of Debugging, Dr. Watson, Education and Research, Escalation Engineering, Fun with Crash Dumps, Futuristic Memory Dump Analysis, GDB for WinDbg Users, Hardware, History, Horrors of Computation, Hyper-V, Intelligent Memory Movement, Kernel Development, Laws of Troubleshooting and Debugging, Mathematics of Debugging, Memiotics (Memory Semiotics), Memoidealism, Memoretics, Memory Analysis Culture, Memory Analysis Forensics and Intelligence, Memory Auralization, Memory Dump Analysis Jobs, Memory Religion (Memorianity), Memory Space Art, Memory Space Music, Memory Systems Language, Memory Visualization, Memuonics, Minidump Analysis, Multithreading, Music for Debugging, Music of Computation, New Acronyms, New Words, Occult Debugging, Philosophy, Psi-computation, Publishing, Science of Memory Dump Analysis, Science of Software Tracing, Security, Software Architecture, Software Defect Construction, Software Engineering, Software Generalist, Software Maintenance Institute, Software Narratology, Software Technical Support, Software Trace Analysis, Software Trace Visualization, Software Tracing for Dummies, Software Victimology, Stack Trace Collection, Testing, Tools, Trace Analysis Patterns, Training and Seminars, Troubleshooting Methodology, Victimware, Virtualization, Vista, Visual Dump Analysis, WinDbg Scripts, WinDbg Tips and Tricks, WinDbg for GDB Users, Windows 7, Windows Server 2008, Windows System Administration | No Comments »
Friday, April 9th, 2010
Plan to start providing training and seminars in my free time. If you are interested please answer these questions (you can either respond here in comments or use this form for private communication http://www.dumpanalysis.org/contact):
- Are you interested in on-site training, prefer traveling or attending webinars?
- Are you interested in software trace analysis as well?
- What specific topics are you interested in?
- What training level (beginner, intermediate, advanced) are you interested in? (please provide an example, if possible)
Additional topics of expertise that can be integrated into training include Source Code Reading and Analysis, Debugging, Windows Architecture, Device Drivers, Troubleshooting Tools Design and Implementation, Multithreading, Deep Down C and C++, x86 and x64 Assembly Language Reading.
Looking forward to your responses. Any suggestions are welcome.
- Dmitry Vostokov @ DumpAnalysis.org + TraceAnalysis.org -
Posted in .NET Debugging, Announcements, AntiPatterns, Assembly Language, Bugchecks Depicted, C and C++, CDA Pattern Classification, CDF Analysis Tips and Tricks, Certification, Code Reading, Common Mistakes, Crash Analysis Report Environment (CARE), Crash Dump Analysis, Crash Dump Patterns, Crash Dumps for Dummies, Data Recovery, DebugWare Patterns, Debugging, Debugging Methodology, Deep Down C++, Education and Research, Escalation Engineering, FreeBSD Crash Corner, GDB for WinDbg Users, Hardware, Hyper-V, Java Debugging, Kernel Development, Laws of Troubleshooting and Debugging, Linux Crash Corner, Mac Crash Corner, Memory Analysis Forensics and Intelligence, Memory Visualization, Minidump Analysis, Multithreading, Security, Software Architecture, Software Defect Construction, Software Engineering, Software Generalist, Software Maintenance Institute, Software Narratology, Software Technical Support, Software Trace Analysis, Software Trace Visualization, Software Tracing for Dummies, Software Victimology, Stack Trace Collection, Testing, Tools, Trace Analysis Patterns, Training and Seminars, Troubleshooting Methodology, Victimware, Virtualization, Vista, Visual Dump Analysis, WinDbg Scripts, WinDbg Tips and Tricks, WinDbg for GDB Users, Windows 7, Windows Server 2008, Windows System Administration, Workaround Patterns | No Comments »
Monday, April 5th, 2010
I’m very pleased to announce that the Korean edition is available:

The book can be found on:
- Dmitry Vostokov @ DumpAnalysis.org + TraceAnalysis.org -
Posted in Announcements, AntiPatterns, Assembly Language, Books, Books (Korean), C and C++, Computer Science, Crash Dump Analysis, Crash Dump Patterns, Crash Dumps for Dummies, Debugging, Dr. Watson, Escalation Engineering, Fun with Crash Dumps, GDB for WinDbg Users, Hardware, Kernel Development, Mathematics of Debugging, Memiotics (Memory Semiotics), Memoretics, Memory Space Music, Memory Visualization, Minidump Analysis, Multithreading, Publishing, Science of Memory Dump Analysis, Security, Software Architecture, Software Engineering, Software Technical Support, Testing, Tools, Troubleshooting Methodology, Virtualization, Vista, WinDbg Scripts, WinDbg Tips and Tricks, WinDbg for GDB Users, Windows Server 2008, Windows System Administration | No Comments »
Friday, March 12th, 2010
When the performance is a performative and the performative is a performance we think about performability:
A virtualization is virtualization.
Peter Brook, The Empty Space
- Dmitry Vostokov @ DumpAnalysis.org + TraceAnalysis.org -
Posted in Bugtations, Philosophy, Virtualization | No Comments »
Thursday, February 11th, 2010
This is a revised, edited, cross-referenced and thematically organized volume of selected DumpAnalysis.org blog posts about crash dump analysis and debugging written in July 2009 - January 2010 for software engineers developing and maintaining products on Windows platforms, quality assurance engineers testing software on Windows platforms and technical support and escalation engineers dealing with complex software issues. The fourth volume features:
- 13 new crash dump analysis patterns
- 13 new pattern interaction case studies
- 10 new trace analysis patterns
- 6 new Debugware patterns and case study
- Workaround patterns
- Updated checklist
- Fully cross-referenced with Volume 1, Volume 2 and Volume 3
- New appendixes
Product information:
- Title: Memory Dump Analysis Anthology, Volume 4
- Author: Dmitry Vostokov
- Language: English
- Product Dimensions: 22.86 x 15.24
- Paperback: 410 pages
- Publisher: Opentask (30 March 2010)
- ISBN-13: 978-1-906717-86-5
- Hardcover: 410 pages
- Publisher: Opentask (30 April 2010)
- ISBN-13: 978-1-906717-87-2

Back cover features memory space art image: Internal Process Combustion.
- Dmitry Vostokov @ DumpAnalysis.org + TraceAnalysis.org -
Posted in .NET Debugging, Aesthetics of Memory Dumps, Announcements, AntiPatterns, Art, Assembly Language, Books, C and C++, CDA Pattern Classification, CDF Analysis Tips and Tricks, Categorical Debugging, Certification, Citrix, Code Reading, Common Mistakes, Computer Science, Countefactual Debugging, Crash Analysis Report Environment (CARE), Crash Dump Analysis, Crash Dump Patterns, Crash Dumps for Dummies, DebugWare Patterns, Debugging, Debugging Slang, Education and Research, Escalation Engineering, Fun with Crash Dumps, Games for Debugging, Hardware, Horrors of Computation, Hyper-V, Kernel Development, Laws of Troubleshooting and Debugging, Mathematics of Debugging, Memiotics (Memory Semiotics), Memoidealism, Memoretics, Memory Analysis Culture, Memory Analysis Forensics and Intelligence, Memory Dreams, Memory Dump Analysis Jobs, Memory Dumps in Movies, Memory Space Art, Memory Visualization, Memuonics, Minidump Analysis, Multithreading, Music for Debugging, New Acronyms, New Words, Opcodism, Philosophy, Physicalist Art, Publishing, Science Fiction, Science of Memory Dump Analysis, Science of Software Tracing, Security, Software Architecture, Software Defect Construction, Software Engineering, Software Generalist, Software Maintenance Institute, Software Narratology, Software Technical Support, Software Trace Analysis, Software Trace Visualization, Software Tracing for Dummies, Software Victimology, Stack Trace Collection, Testing, Tools, Trace Analysis Patterns, Training and Seminars, Troubleshooting Methodology, Victimware, Virtualization, Vista, Visual Dump Analysis, WinDbg Scripts, WinDbg Tips and Tricks, WinDbg for GDB Users, Windows 7, Windows Server 2008, Windows System Administration, Workaround Patterns | No Comments »
Sunday, December 20th, 2009
“Memory dumps are facts.”
I’m very excited to announce that Volume 3 is available in paperback, hardcover and digital editions:
Memory Dump Analysis Anthology, Volume 3
Table of Contents
In two weeks paperback edition should also appear on Amazon and other bookstores. Amazon hardcover edition is planned to be available in January 2010.
The amount of information was so voluminous that I had to split the originally planned volume into two. Volume 4 should appear by the middle of February together with Color Supplement for Volumes 1-4.
- Dmitry Vostokov @ DumpAnalysis.org -
Posted in .NET Debugging, Aesthetics of Memory Dumps, Announcements, AntiPatterns, Art, Assembly Language, Books, Bugtations, C and C++, CDA Pattern Classification, CDF Analysis Tips and Tricks, Certification, Citrix, Code Reading, Common Mistakes, Computer Science, Crash Dump Analysis, Crash Dump Patterns, Crash Dumps for Dummies, DebugWare Patterns, Debugging, Debugging Slang, Deep Down C++, Education and Research, Escalation Engineering, Fun with Crash Dumps, Hardware, Horrors of Computation, Kernel Development, Mathematics of Debugging, Memiotics (Memory Semiotics), Memoidealism, Memoretics, Memory Analysis Culture, Memory Analysis Forensics and Intelligence, Memory Space Art, Memory Visualization, Minidump Analysis, Multithreading, Philosophy, Poetry, Publishing, Science of Memory Dump Analysis, Science of Software Tracing, Security, Software Architecture, Software Defect Construction, Software Engineering, Software Narratology, Software Technical Support, Software Trace Analysis, Software Trace Visualization, Software Tracing for Dummies, Software Victimology, Stack Trace Collection, Testing, Tools, Trace Analysis Patterns, Training and Seminars, Troubleshooting Methodology, Victimware, Virtualization, Vista, Visual Dump Analysis, WinDbg Scripts, WinDbg Tips and Tricks, WinDbg for GDB Users, Windows 7, Windows Server 2008, Windows System Administration | 1 Comment »
Monday, November 16th, 2009
This is a hardware counterpart of Not My Version pattern. Some problems manifest themselves on different hardware not used at the time of the product testing. In such cases we can look at kernel and complete memory dumps, extract hardware information using !sysinfo command and compare differences. This is similar to Virtualized System pattern and might provide troubleshooting hints. One example, I have seen in the past, involved a graphics intensive application that relied heavily upon hardware acceleration features. It was tested with certain processors and chipsets but after a few years failed to work on one computer despite the same OS image and drivers. !sysinfo command revealed significant hardware differences: the failing client computer was newer faster multiprocessor machine.
- Dmitry Vostokov @ DumpAnalysis.org -
Posted in Crash Dump Analysis, Crash Dump Patterns, Debugging, Hardware, Virtualization | No Comments »
Saturday, September 26th, 2009
This is a revised, edited, cross-referenced and thematically organized volume of selected DumpAnalysis.org blog posts about crash dump analysis and debugging written in October 2008 - June 2009 for software engineers developing and maintaining products on Windows platforms, quality assurance engineers testing software on Windows platforms and technical support and escalation engineers dealing with complex software issues. The third volume features:
- 15 new crash dump analysis patterns
- 29 new pattern interaction case studies
- Trace analysis patterns
- Updated checklist
- Fully cross-referenced with Volume 1 and Volume 2
- New appendixes
Product information:
- Title: Memory Dump Analysis Anthology, Volume 3
- Author: Dmitry Vostokov
- Language: English
- Product Dimensions: 22.86 x 15.24
- Paperback: 404 pages
- Publisher: Opentask (20 December 2009)
- ISBN-13: 978-1-906717-43-8
- Hardcover: 404 pages
- Publisher: Opentask (30 January 2010)
- ISBN-13: 978-1-906717-44-5

Back cover features 3D computer memory visualization image.
- Dmitry Vostokov @ DumpAnalysis.org -
Posted in Announcements, AntiPatterns, Art, Assembly Language, Books, C and C++, CDF Analysis Tips and Tricks, Certification, Citrix, Code Reading, Common Mistakes, Computational Ghosts and Bug Hauntings, Computer Science, Countefactual Debugging, Crash Dump Analysis, Crash Dump Patterns, Crash Dumps for Dummies, DebugWare Patterns, Debugging, Debugging Slang, Deep Down C++, Education and Research, Escalation Engineering, Fun with Crash Dumps, Futuristic Memory Dump Analysis, Games for Debugging, Hardware, Horrors of Computation, Hyper-V, Intelligent Memory Movement, Kernel Development, Mathematics of Debugging, Memiotics (Memory Semiotics), Memoidealism, Memoretics, Memory Analysis Culture, Memory Analysis Forensics and Intelligence, Memory Dreams, Memory Dump Analysis Jobs, Memory Space Music, Memory Visualization, Memuonics, Minidump Analysis, Multithreading, Music for Debugging, New Acronyms, New Words, Occult Debugging, Philosophy, Poetry, Psi-computation, Publishing, Science of Memory Dump Analysis, Science of Software Tracing, Security, Software Architecture, Software Defect Construction, Software Engineering, Software Generalist, Software Narratology, Software Technical Support, Software Trace Analysis, Software Tracing for Dummies, Testing, Tools, Trace Analysis Patterns, Training and Seminars, Troubleshooting Methodology, Virtualization, Vista, Visual Dump Analysis, WinDbg Scripts, WinDbg Tips and Tricks, WinDbg for GDB Users, Windows 7, Windows Server 2008, Windows System Administration | No Comments »
Saturday, September 26th, 2009
DumpAnalysis.org accepts hardware such as laptops for reviewing in relation to their suitability for extreme debugging, virtualization, trace analysis, computer forensics, memory dump analysis, visualization and auralization. If you work for a H/W company like HP, Apple, Dell, Acer, Sony or any other respectable manufacturer please don’t hesitate to forward this post to your management: it could be your company brand or laptop model that debugging and software technical support community chooses next time of upgrade or for T&D / R&D! H/W reviews will be posted on the main portal page which currently has an audience of more than 200,000 unique visitors per year from more than 30,000 network locations (*).
If your company is interested please don’t hesitate to use this contact form:
http://www.dumpanalysis.org/contact
(*) From Google Analytics report.
- Dmitry Vostokov @ DumpAnalysis.org -
Posted in Announcements, Crash Dump Analysis, Debugging, Hardware, Memory Analysis Forensics and Intelligence, Memory Auralization, Memory Visualization, Security, Software Engineering, Software Technical Support, Software Trace Analysis, Testing, Tools, Virtualization, Vista, Visual Dump Analysis, Windows 7, Windows Server 2008, Windows System Administration | No Comments »
Tuesday, July 28th, 2009
Here is another addition to identification of memory dumps coming from VMWare, VirtualPC and Xen Server virtualized Windows systems. Now I had a look at Windows Server 2008 Hyper-V host system running Windows Server 2008 as a guest and found that this information could serve as an identification if infrastructure components were installed:
kd> lm

[...]

fffffa60`00cc2000 fffffa60`00cd7000   winhv       (deferred)

fffff960`00810000 fffff960`0081b000   VMBusVideoD (deferred)

fffffa60`00c7e000 fffffa60`00cc2000   vmbus       (deferred)

fffffa60`00df6000 fffffa60`00dfbb00   VMBusHID    (deferred)

fffffa60`0201c000 fffffa60`02028000   VMBusVideoM (deferred)

[...]
winhv driver has lots of exported hypervisor related functions:
kd> x winhv!*

*** ERROR: Symbol file could not be found.  Defaulted to export symbols for winhv.sys -

fffffa60`00cc3100 winhv!WinHvGetCurrentVpIndex (<no parameter info>)

fffffa60`00cc3160 winhv!WinHvSetSintOnCurrentProcessor (<no parameter info>)

fffffa60`00cc3230 winhv!WinHvNtProcessorToVpIndex (<no parameter info>)

fffffa60`00cc3260 winhv!WinHvDisconnectPort (<no parameter info>)

fffffa60`00cc32e0 winhv!WinHvDeletePort (<no parameter info>)

fffffa60`00cc35c0 winhv!WinHvMapGpaPages (<no parameter info>)

fffffa60`00cc36e0 winhv!WinHvSetVpRegisters (<no parameter info>)

fffffa60`00cc3e20 winhv!WinHvGetVpRegisters (<no parameter info>)

fffffa60`00cc3ed0 winhv!WinHvLowMemoryPolicyAutoDeposit (<no parameter info>)

fffffa60`00cc4110 winhv!WinHvSetPartitionProperty (<no parameter info>)

fffffa60`00cc4250 winhv!WinHvGetPartitionProperty (<no parameter info>)

fffffa60`00cc4290 winhv!WinHvPostMessage (<no parameter info>)

fffffa60`00cc4320 winhv!WinHvCreatePort (<no parameter info>)

fffffa60`00cc4380 winhv!WinHvConnectPort (<no parameter info>)

fffffa60`00cc43e0 winhv!WinHvCreateVp (<no parameter info>)

fffffa60`00cc4430 winhv!WinHvMapEventLogBuffer (<no parameter info>)

fffffa60`00cc44d0 winhv!WinHvCreateEventLogBuffer (<no parameter info>)

fffffa60`00cc4580 winhv!WinHvGetPartitionId (<no parameter info>)

fffffa60`00cc45d0 winhv!WinHvWithdrawAllMemory (<no parameter info>)

fffffa60`00cc4600 winhv!WinHvReleaseEventLogBuffer (<no parameter info>)

fffffa60`00cc4630 winhv!WinHvCreatePartition (<no parameter info>)

fffffa60`00cc49d0 winhv!WinHvDeletePartition (<no parameter info>)

fffffa60`00cc4f50 winhv!WinHvUnmapGpaPages (<no parameter info>)

fffffa60`00cc5150 winhv!WinHvInstallIntercept (<no parameter info>)

fffffa60`00cc5240 winhv!WinHvInitializeEventLogBufferGroup (<no parameter info>)

fffffa60`00cc52c0 winhv!WinHvDeleteVp (<no parameter info>)

fffffa60`00cc5340 winhv!WinHvGetPortProperty (<no parameter info>)

fffffa60`00cc53a0 winhv!WinHvSetEventLogGroupSources (<no parameter info>)

fffffa60`00cc55a0 winhv!WinHvOnInterrupt (<no parameter info>)

fffffa60`00cc5870 winhv!WinHvCancelTimer (<no parameter info>)

fffffa60`00cc5a20 winhv!WinHvSetAbsoluteTimer (<no parameter info>)

fffffa60`00cc5b40 winhv!WinHvSetEventLogCompletedNotificationRoutine (<no parameter info>)

fffffa60`00cc5b50 winhv!WinHvQueryInterceptIrql (<no parameter info>)

fffffa60`00cc5b60 winhv!WinHvGetSintMessage (<no parameter info>)

fffffa60`00cc5b90 winhv!WinHvAllocatePartitionSintIndex (<no parameter info>)

fffffa60`00cc5d60 winhv!WinHvClearVirtualInterrupt (<no parameter info>)

fffffa60`00cc5db0 winhv!WinHvFlushEventLogBuffer (<no parameter info>)

fffffa60`00cc5e10 winhv!WinHvQueryReferenceCounter (<no parameter info>)

fffffa60`00cc5e50 winhv!WinHvSignalEvent (<no parameter info>)

fffffa60`00cc5ea0 winhv!WinHvWriteGpa (<no parameter info>)

fffffa60`00cc5fb0 winhv!WinHvReadGpa (<no parameter info>)

fffffa60`00cc60c0 winhv!WinHvTranslateVirtualAddress (<no parameter info>)

fffffa60`00cc61a0 winhv!WinHvAssertVirtualInterrupt (<no parameter info>)

fffffa60`00cc6240 winhv!WinHvGetSintEventFlags (<no parameter info>)

fffffa60`00cc6e90 winhv!WinHvIsCompatibleServicedHypervisorImplementation (<no parameter info>)

fffffa60`00cc6e90 winhv!WinHvIsCompatibleServicedDriverImplementation (<no parameter info>)

fffffa60`00cc6e90 winhv!WinHvIsCompatibleHypervisorImplementation (<no parameter info>)

fffffa60`00cc6e90 winhv!WinHvIsCompatibleDriverImplementation (<no parameter info>)

fffffa60`00cc6ea0 winhv!WinHvLookupPortId (<no parameter info>)

fffffa60`00cc6ee0 winhv!WinHvLowMemoryPolicyRaiseException (<no parameter info>)

fffffa60`00cc6f90 winhv!WinHvLowMemoryPolicyReturnStatus (<no parameter info>)

fffffa60`00cc7070 winhv!WinHvQueryFeaturesState (<no parameter info>)

fffffa60`00cc71f0 winhv!WinHvDeleteEventLogBuffer (<no parameter info>)

fffffa60`00cc7220 winhv!WinHvUnmapEventLogBuffer (<no parameter info>)

fffffa60`00cc7250 winhv!WinHvFinalizeEventLogBufferGroup (<no parameter info>)

fffffa60`00cc7310 winhv!WinHvSetEndOfMessage (<no parameter info>)

fffffa60`00cc7340 winhv!WinHvAllocateSingleSintIndex (<no parameter info>)

fffffa60`00cc7530 winhv!WinHvClearLogicalProcessorRunTimeGroup (<no parameter info>)

fffffa60`00cc7560 winhv!WinHvSetLogicalProcessorRunTimeGroup (<no parameter info>)

fffffa60`00cc7740 winhv!WinHvGetMemoryBalance (<no parameter info>)

fffffa60`00cc77a0 winhv!WinHvGetLogicalProcessorRunTime (<no parameter info>)

fffffa60`00cc7830 winhv!WinHvGetNextChildPartition (<no parameter info>)

fffffa60`00ccf0e0 winhv!WinHvReportPresentHypervisor (<no parameter info>)

fffffa60`00ccf400 winhv!WinHvSetSint (<no parameter info>)

fffffa60`00ccf5b0 winhv!WinHvMapStatsPage (<no parameter info>)

fffffa60`00ccfa90 winhv!WinHvWithdrawMemory (<no parameter info>)

fffffa60`00ccfc80 winhv!WinHvDepositMemory (<no parameter info>)

fffffa60`00ccfd80 winhv!WinHvAllocatePortId (<no parameter info>)

fffffa60`00ccfff0 winhv!WinHvUnmapStatsPage (<no parameter info>)

fffffa60`00cd02d0 winhv!WinHvDeleteTimer (<no parameter info>)

fffffa60`00cd02f0 winhv!WinHvCreateTimer (<no parameter info>)

fffffa60`00cd0360 winhv!WinHvFreePortId (<no parameter info>)

fffffa60`00cd03c0 winhv!WinHvSupplyInterruptVector (<no parameter info>)

fffffa60`00cd0a80 winhv!WinHvAdjustFeaturesState (<no parameter info>)

fffffa60`00cd0aa0 winhv!WinHvQueryFeatureInformation (<no parameter info>)

fffffa60`00cd0ab0 winhv!WinHvGetIdentifierString (<no parameter info>)

fffffa60`00cd0bd0 winhv!WinHvFreeSingleSintIndex (<no parameter info>)

fffffa60`00cd0c20 winhv!WinHvFreePartitionSintIndex (<no parameter info>)

fffffa60`00cd0dd0 winhv!DllUnload (<no parameter info>)

fffffa60`00cd0f30 winhv!WinHvReclaimInterruptVector (<no parameter info>)

fffffa60`00cd1030 winhv!WinHvRestorePartitionState (<no parameter info>)

fffffa60`00cd1170 winhv!WinHvSavePartitionState (<no parameter info>)

fffffa60`00cd3050 winhv!DllInitialize (<no parameter info>)

fffffa60`00cd3990 winhv!DriverEntry (<no parameter info>)
If we have a clean virtualized guest without any tools installed then we can rely on hardware information:
kd> !sysinfo machineid

Machine ID Information [From Smbios 2.3, DMIVersion 35, Size=3752]

BiosVendor = American Megatrends Inc.

BiosVersion = 080002

BiosReleaseDate = 05/05/2008

SystemManufacturer = Microsoft Corporation

SystemProductName = Virtual Machine

SystemVersion = 5.0

BaseBoardManufacturer = Microsoft Corporation

BaseBoardProduct = Virtual Machine

BaseBoardVersion = 5.0
- Dmitry Vostokov @ DumpAnalysis.org -
Posted in Crash Dump Analysis, Hyper-V, Virtualization, Windows Server 2008 | 1 Comment »
Sunday, July 12th, 2009
One 32-bit WOW64 process was crashing when accessing a direct NULL data pointer with the following stack trace:
0:000> r

rax=00000000750e9b40 rbx=000000000017f29c rcx=0000000000041710

rdx=0000000000041240 rsi=0000000000041710 rdi=0000000000041240

rip=00000000750e9b59 rsp=00000000000411f0 rbp=000000000017f2a8

 r8=0000000000000001  r9=00000000750ffd40 r10=0000000000000000

r11=000000000017f29c r12=000000007efdb000 r13=000000000007fd20

r14=000000000007ee70 r15=00000000751e3380

iopl=0 nv up ei pl nz na po nc

cs=0033 ss=002b ds=002b es=002b fs=0053 gs=002b efl=00010206

wow64!Wow64PrepareForException+0×19:

00000000`750e9b59 654c8b1c2530000000 mov   r11,qword ptr gs:[30h] gs:00000000`00000030=????????????????
0:000> kc

Call Site

wow64!Wow64PrepareForException

ntdll!KiUserExceptionDispatcher

wow64!Wow64PrepareForException

ntdll!KiUserExceptionDispatcher

wow64!Wow64PrepareForException

ntdll!KiUserExceptionDispatcher

wow64!Wow64PrepareForException

ntdll!KiUserExceptionDispatcher

wow64!Wow64PrepareForException

ntdll!KiUserExceptionDispatcher

wow64!Wow64PrepareForException

ntdll!KiUserExceptionDispatcher

wow64!Wow64PrepareForException

ntdll!KiUserExceptionDispatcher

wow64!Wow64PrepareForException

ntdll!KiUserExceptionDispatcher

wow64!Wow64PrepareForException

ntdll!KiUserExceptionDispatcher

wow64!Wow64PrepareForException

ntdll!KiUserExceptionDispatcher
It looks like a stack overflow. Usually it manifests via a PUSH instruction or a data access violation when ESP/RSP < TEB.StackLimit. However here RSP is still inside the stack range:
0:000> !teb

[...]

Wow64 TEB at 000000007efdb000

    ExceptionList:        000000007efdd000

    StackBase:            000000000007fd20

    StackLimit:           0000000000041000

    SubSystemTib:         0000000000000000

    FiberData:            0000000000001e00

    ArbitraryUserPointer: 0000000000000000

    Self:                 000000007efdb000

    EnvironmentPointer:   0000000000000000

    ClientId:             0000000000001684 . 000000000000168c

    RpcHandle:            0000000000000000

    Tls Storage:          0000000000000000

    PEB Address:          000000007efdf000

    LastErrorValue:       0

    LastStatusValue:      c0000034

    Count Owned Locks:    0

    HardErrorMode:        0
0:000> dq rsp-10 rsp+10

00000000`000411e0  00000000`00000000 00000000`00000000

00000000`000411f0  00000000`00000000 00000000`00000000

00000000`00041200  00000000`00000000
But still RSP is very close to the stack limit and the next function call surely would overflow because of the large frame delta:
0:000> kcf

  Memory  Call Site

          wow64!Wow64PrepareForException

       50 ntdll!KiUserExceptionDispatcher

      5a0 wow64!Wow64PrepareForException

       50 ntdll!KiUserExceptionDispatcher

      5a0 wow64!Wow64PrepareForException

       50 ntdll!KiUserExceptionDispatcher

      5a0 wow64!Wow64PrepareForException

       50 ntdll!KiUserExceptionDispatcher

      5a0 wow64!Wow64PrepareForException

       50 ntdll!KiUserExceptionDispatcher

      5a0 wow64!Wow64PrepareForException

       50 ntdll!KiUserExceptionDispatcher

      5a0 wow64!Wow64PrepareForException

       50 ntdll!KiUserExceptionDispatcher

      5a0 wow64!Wow64PrepareForException

       50 ntdll!KiUserExceptionDispatcher

      5a0 wow64!Wow64PrepareForException

       50 ntdll!KiUserExceptionDispatcher

      5a0 wow64!Wow64PrepareForException

       50 ntdll!KiUserExceptionDispatcher
So we consider this as the stack overflow indeed. We specify the larger number of frames to reach the stack base:
0:000> kc 1000

Call Site

wow64!Wow64PrepareForException

ntdll!KiUserExceptionDispatcher

wow64!Wow64PrepareForException

ntdll!KiUserExceptionDispatcher

wow64!Wow64PrepareForException

ntdll!KiUserExceptionDispatcher

[...]

ntdll!KiUserExceptionDispatcher

wow64!Wow64PrepareForException

ntdll!KiUserExceptionDispatcher

wow64!Wow64PrepareForException

ntdll!KiUserExceptionDispatcher

wow64!Wow64PrepareForException

ntdll!KiUserExceptionDispatcher

wow64!Wow64SystemServiceEx

wow64cpu!ServiceNoTurbo

wow64!RunCpuSimulation

wow64!Wow64LdrpInitialize

ntdll!LdrpInitializeProcess

ntdll! ?? ::FNODOBFM::`string’

ntdll!LdrInitializeThunk
We consider this as a nested unmanaged exception and try to see where it originated. First we double check that we don’t have any exceptions in 32-bit code. And indeed threads look clean:
0:000:x86> ~*kc
. 0 Id: 1684.168c Suspend: 0 Teb: 7efdb000 Unfrozen
user32!NtUserGetProp

user32!GetPropA

WARNING: Stack unwind information not available. Following frames may be wrong.

Application!foo

user32!InternalCallWinProc

user32!UserCallWinProcCheckWow

user32!SendMessageWorker

user32!SendMessageA

Application
1 Id: 1684.1688 Suspend: 1 Teb: 7efd8000 Unfrozen
ntdll_77320000!ZwRemoveIoCompletion

kernel32!GetQueuedCompletionStatus

rpcrt4!COMMON_ProcessCalls

rpcrt4!LOADABLE_TRANSPORT::ProcessIOEvents

rpcrt4!ProcessIOEventsWrapper

rpcrt4!BaseCachedThreadRoutine

rpcrt4!ThreadStartRoutine

kernel32!BaseThreadInitThunk

ntdll_77320000!__RtlUserThreadStart

ntdll_77320000!_RtlUserThreadStart
2 Id: 1684.1678 Suspend: 1 Teb: 7efd5000 Unfrozen
ntdll_77320000!NtDelayExecution

kernel32!SleepEx

kernel32!Sleep

ole32!CROIDTable::WorkerThreadLoop

ole32!CRpcThread::WorkerLoop

ole32!CRpcThreadCache::RpcWorkerThreadEntry

kernel32!BaseThreadInitThunk

ntdll_77320000!__RtlUserThreadStart

ntdll_77320000!_RtlUserThreadStart
3 Id: 1684.164c Suspend: 1 Teb: 7efad000 Unfrozen
ntdll_77320000!NtWaitForMultipleObjects

kernel32!WaitForMultipleObjectsEx

kernel32!WaitForMultipleObjects

msiltcfg!WorkerThread

kernel32!BaseThreadInitThunk

ntdll_77320000!__RtlUserThreadStart

ntdll_77320000!_RtlUserThreadStart
4 Id: 1684.166c Suspend: 1 Teb: 7efaa000 Unfrozen
ntdll_77320000!ZwWaitForSingleObject

kernel32!WaitForSingleObjectEx

kernel32!WaitForSingleObject

winspool!MonitorRPCServerProcess

kernel32!BaseThreadInitThunk

ntdll_77320000!__RtlUserThreadStart

ntdll_77320000!_RtlUserThreadStart
The first thread looks a bit suspicious, we have never seen NtUserGetProp on stack traces, there is a possibility of an exception in main GUI thread and also the stack trace itself looks incorrect, suddenly sending a Windows message without any kind of a message loop:
0:000:x86> k

ChildEBP RetAddr

0017f294 76e45be7 user32!NtUserGetProp+0×15

0017f2a8 025d4ba0 user32!GetPropA+0×3d

WARNING: Stack unwind information not available. Following frames may be wrong.

0017f2e0 76e38807 Application!foo+0×230

0017f30c 76e38962 user32!InternalCallWinProc+0×23

0017f384 76e3c4b6 user32!UserCallWinProcCheckWow+0×109

0017f3c8 76e3eae2 user32!SendMessageWorker+0×55b

0017f3ec 02a755c6 user32!SendMessageA+0×7f

00000000 00000000 Application+0×255c6
NtUserGetProp EIP address looks valid and points to the code after the return from a system call:
0:000:x86> u eip

user32!NtUserGetProp+0x15:

76e3b64f c20800          ret     8

76e3b652 90              nop

76e3b653 90              nop

76e3b654 90              nop

76e3b655 90              nop

76e3b656 90              nop

user32!GetPropW:

76e3b657 8bff            mov     edi,edi

76e3b659 55              push    ebp
0:000:x86> ub eip

user32!DefWindowProcW+0x96:

76e3b636 90              nop

76e3b637 90              nop

76e3b638 90              nop

76e3b639 90              nop

user32!NtUserGetProp:

76e3b63a b80e100000      mov     eax,100Eh

76e3b63f 8d542404        lea     edx,[esp+4]

76e3b643 b900000000      mov     ecx,0

76e3b648 64ff15c0000000  call    dword ptr fs:[0C0h]
Its 32-bit raw stack looks like normal main GUI thread of a VB6 application:
0:000:x86> !wow64exts.info

[...]

32 bit, StackBase   : 0×180000

        StackLimit  : 0×17c000

        Deallocation: 0×80000
64 bit, StackBase   : 0x7fd20

        StackLimit  : 0x41000

        Deallocation: 0x40000

[...]
0:000:x86> dds 0x17c000 0x180000

0017c000  00000000

0017c004  00000000

0017c008  00000000

0017c00c  00000000

0017c010  00000000

[...]

0017fdc8  00000000

0017fdcc  0017fe30

0017fdd0  76e38aad user32!DispatchMessageWorker+0×380

0017fdd4  00000000

0017fdd8  726ff5d1 msvbvm60!IID_IVbaHost+0×30ff1

0017fddc  0002088c

0017fde0  00000113

0017fde4  0002088c

0017fde8  00000000

0017fdec  00b319a8

0017fdf0  00000001

0017fdf4  9f7e168b

0017fdf8  76e395c0 user32!PeekMessageA

0017fdfc  02c0209c

0017fe00  00000000

0017fe04  76e395c0 user32!PeekMessageA

0017fe08  02c0216c

0017fe0c  0002088c

0017fe10  00000000

0017fe14  726aa76a msvbvm60!_vbaStrToAnsi+0×3ab

0017fe18  0017fdf4

0017fe1c  ffffffff

0017fe20  0017ff70

0017fe24  76e985e7 user32!_except_handler4

0017fe28  e98a626b

0017fe2c  fffffffe

0017fe30  0017fe40

0017fe34  76e39100 user32!DispatchMessageA+0xf

[…]

0017ff58  ffffffff

0017ff5c  ffffffff

0017ff60  ffffffff

0017ff64  00000000

0017ff68  0017ff10

0017ff6c  00000000

0017ff70  0017ffc4

0017ff74  7278bafd msvbvm60!CreateIExprSrvObj+0×9f2

0017ff78  726b97d0 msvbvm60!BASIC_CLASS_Release+0xadbd

0017ff7c  00000000

0017ff80  0017ff94

0017ff84  00401396

0017ff88  00401514

0017ff8c  768de3f3 kernel32!BaseThreadInitThunk+0xe

0017ff90  7efde000

0017ff94  0017ffd4

0017ff98  7739cfed ntdll_77320000!__RtlUserThreadStart+0×23

0017ff9c  7efde000

0017ffa0  63553bf6

0017ffa4  00000000

0017ffa8  00000000

0017ffac  7efde000

0017ffb0  00000000

0017ffb4  00000000

0017ffb8  00000000

0017ffbc  0017ffa0

0017ffc0  00000000

0017ffc4  0017ffe4

0017ffc8  773d2926 ntdll_77320000!_except_handler4

0017ffcc  14761e1a

0017ffd0  00000000

0017ffd4  0017ffec

0017ffd8  7739d1ff ntdll_77320000!_RtlUserThreadStart+0×1b

0017ffdc  0040138c

0017ffe0  7efde000

0017ffe4  ffffffff

0017ffe8  773bd377 ntdll_77320000!FinalExceptionHandler

0017ffec  00000000

0017fff0  00000000

0017fff4  0040138c

0017fff8  7efde000

0017fffc  00000000

00180000  78746341
There are no any signs of exception codes and processing residue there and we come back to out 64-bit layer:
0:000:x86> .effmach amd64

Effective machine: x64 (AMD64)
We dump 64-bit stack to see the moment when the first exception happened:
0:000> dqs 0x41000 0x7fd20

[...]

00000000`0007df30  00000000`00000000

00000000`0007df38  00000000`00000000

00000000`0007df40  00000000`00000000

00000000`0007df48  00000000`00000000

00000000`0007df50  00000000`00000000

00000000`0007df58  00000000`00000000

00000000`0007df60  00000000`00000000

00000000`0007df68  00000000`00000000

00000000`0007df70  00000000`00000000

00000000`0007df78  00000000`00000000

00000000`0007df80  00000000`750e9b59 wow64!Wow64PrepareForException+0x19

00000000`0007df88  00000000`00000000

00000000`0007df90  00000000`00000000

00000000`0007df98  00000000`0007dfb0

00000000`0007dfa0  00000000`00000001

00000000`0007dfa8  00000000`0007e510

00000000`0007dfb0  00000000`611b422e

00000000`0007dfb8  fffffa60`04eec978

00000000`0007dfc0  fffffa60`04ee6520

00000000`0007dfc8  fffffa60`04ee6520

00000000`0007dfd0  fffffa60`04eec978

00000000`0007dfd8  00000000`00000030

00000000`0007dfe0  00000000`0017f29c

00000000`0007dfe8  00000000`0000c04c

00000000`0007dff0  00000000`00000000

00000000`0007dff8  00000000`771c59e6 ntdll!KiUserExceptionDispatcher+0×1c

00000000`0007e000  01c9f89c`fe787c8d

00000000`0007e008  fffffa60`03732e4e

00000000`0007e010  fffffa80`0497c9a0

00000000`0007e018  00000000`00000000

00000000`0007e020  00000000`00000001

00000000`0007e028  01c9f89c`fe787c00

00000000`0007e030  00001fa0`0010001f

00000000`0007e038  0053002b`002b0033

00000000`0007e040  00010283`002b002b

00000000`0007e048  00000000`00000000

00000000`0007e050  00000000`00000000

00000000`0007e058  00000000`00000000

00000000`0007e060  00000000`00000000

00000000`0007e068  00000000`00000000

00000000`0007e070  00000000`00000000

00000000`0007e078  00000000`00000006

00000000`0007e080  00000000`0000100e

00000000`0007e088  00000000`0000000e

00000000`0007e090  00000000`0017f29c

00000000`0007e098  00000000`0007e5a0

00000000`0007e0a0  00000000`0017f2a8

00000000`0007e0a8  00000000`0000c04c

00000000`0007e0b0  00000000`00000000

00000000`0007e0b8  00000000`00000001

00000000`0007e0c0  00000000`750ffd40 wow64!ServiceTables

00000000`0007e0c8  00000000`00000000

00000000`0007e0d0  00000000`0017f29c

00000000`0007e0d8  00000000`7efdb000

00000000`0007e0e0  00000000`0007fd20

00000000`0007e0e8  00000000`0007ee70

00000000`0007e0f0  00000000`751e3380 wow64cpu!CpupSaveLegacyFloatingPointState+0×60

00000000`0007e0f8  00000000`750ca923 wow64!Wow64SystemServiceEx+0×57

00000000`0007e100  015c0000`4000137f

00000000`0007e108  00000023`02add97f

00000000`0007e110  0000002b`0017f408

00000000`0007e118  0000ffff`00001f80

00000000`0007e120  00000000`00000000

00000000`0007e128  00000000`00000000
All addresses we used to try for .exr and .cxr commands in hidden exception pattern are beyond user space and we therefore conclude that somehow such structures or pointers to them became corrupt and their access triggered the same exception processing code over and over again finally leading to the stack overflow. This was an x64 system and taking a complete memory dump was impractical so at the same time when a WER error message appeared a kernel memory dump was generated (a pair of dumps from fiber bundle) and it shows the final stages of exception processing that are in agreement with the user dump we analyzed.
Initially we thought that the system experienced a bugcheck after the application crash:
1: kd> !analyze -v

DRIVER_IRQL_NOT_LESS_OR_EQUAL (d1)

An attempt was made to access a pageable (or completely invalid) address at an interrupt request level (IRQL) that is too high.  This is usually caused by drivers using improper addresses. If kernel debugger is available get stack backtrace.

Arguments:

Arg1: fffff880058b1010, memory referenced

Arg2: 0000000000000002, IRQL

Arg3: 0000000000000000, value 0 = read operation, 1 = write operation

Arg4: fffffa60053da17a, address which referenced memory
But then we noticed that bugcheck was forced intentionally using NotMyFault sysinternals tool:
1: kd> kc

Call Site

nt!KeBugCheckEx

nt!KiBugCheckDispatch

nt!KiPageFault

myfault

myfault

nt!IopXxxControlFile

nt!NtDeviceIoControlFile

nt!KiSystemServiceCopyEnd

0×0
In the kernel dump we see our application and the next process is WER:
1: kd> !vm

[...]

PROCESS fffffa8001886710

    SessionId: 1  Cid: 13e4    Peb: 7efdf000  ParentCid: 0ab0

    DirBase: 329c8000  ObjectTable: fffff880059424d0  HandleCount: 190.

    Image: Application.exe
PROCESS fffffa800188a040

    SessionId: 1  Cid: 0b44    Peb: 7efdf000  ParentCid: 0934

    DirBase: 2b144000  ObjectTable: fffff88004c68a30  HandleCount: 166.

    Image: WerFault.exe
We see a page fault on a kernel stack trace of the main process thread:
1: kd> !thread fffffa8001cc7bb0 1f

THREAD fffffa8001cc7bb0  Cid 13e4.01dc  Teb: 000000007efdb000 Win32Thread: fffff900c210ed50 WAIT: (WrLpcReply) UserMode Non-Alertable

    fffffa8001cc7f40  Semaphore Limit 0x1

Waiting for reply to ALPC Message fffff880075c3970 : queued at port fffffa8001dae290 : owned by process fffffa8001d8e040

Not impersonating

DeviceMap                 fffff88004c30a00

Owning Process            fffffa8001886710       Image:         Application.exe

Attached Process          N/A            Image:         N/A

Wait Start TickCount      83669865       Ticks: 320 (0:00:00:04.992)

Context Switch Count      1829                 LargeStack

UserTime                  00:00:00.187

KernelTime                00:00:00.280

Win32 Start Address 0x000000000040138c

Stack Init fffffa6004cc3db0 Current fffffa6004cc2ae0

Base fffffa6004cc4000 Limit fffffa6004cb9000 Call 0

Priority 10 BasePriority 8 PriorityDecrement 2 IoPriority 2 PagePriority 5

Child-SP          RetAddr           Call Site

fffffa60`04cc2b20 fffff800`0165cf8a nt!KiSwapContext+0×7f

fffffa60`04cc2c60 fffff800`0165e38a nt!KiSwapThread+0×2fa

fffffa60`04cc2cd0 fffff800`0168ecab nt!KeWaitForSingleObject+0×2da

fffffa60`04cc2d60 fffff800`018e1f64 nt!AlpcpSignalAndWait+0×7b

fffffa60`04cc2da0 fffff800`018e7216 nt!AlpcpReceiveSynchronousReply+0×44

fffffa60`04cc2e00 fffff800`018dc27f nt!AlpcpProcessSynchronousRequest+0×24f

fffffa60`04cc2f20 fffff800`01656e33 nt!NtAlpcSendWaitReceivePort+0×19f

fffffa60`04cc2fd0 fffff800`01657340 nt!KiSystemServiceCopyEnd+0×13 (TrapFrame @ fffffa60`04cc3040)

fffffa60`04cc31d8 fffff800`019b6e30 nt!KiServiceLinkage

fffffa60`04cc31e0 fffff800`01898d6d nt!DbgkpSendErrorMessage+0×230

fffffa60`04cc3300 fffff800`016bf487 nt!DbgkForwardException+0×12d

fffffa60`04cc3440 fffff800`016571e9 nt! ?? ::FNODOBFM::`string’+0×29550

fffffa60`04cc3a40 fffff800`01655fe5 nt!KiExceptionDispatch+0xa9

fffffa60`04cc3c20 00000000`75319b59 nt!KiPageFault+0×1e5 (TrapFrame @ fffffa60`04cc3c20)

00000000`000411f0 00000000`00000000 0×75319b59
Analysis of the raw stack confirms the final access violation address:
1: kd> dqs fffffa6004cb9000 fffffa6004cc4000

[…]

fffffa60`04cc3a00  00000000`00000000

fffffa60`04cc3a08  00000000`00000000

fffffa60`04cc3a10  00000000`00000000

fffffa60`04cc3a18  00000000`00000000

fffffa60`04cc3a20  00000000`0007fd20

fffffa60`04cc3a28  00000000`7efdb000

fffffa60`04cc3a30  00000000`00041240

fffffa60`04cc3a38  fffff800`016571e9 nt!KiExceptionDispatch+0xa9

fffffa60`04cc3a40  fffffa60`04cc3b78

fffffa60`04cc3a48  00000000`0017f290

fffffa60`04cc3a50  fffffa60`04cc3c20

fffffa60`04cc3a58  00000000`00041710

fffffa60`04cc3a60  00000000`00000001

fffffa60`04cc3a68  00000000`80000001

fffffa60`04cc3a70  0000002d`0000002d

fffffa60`04cc3a78  0000002d`0000002d

fffffa60`04cc3a80  0000002d`0000002d

fffffa60`04cc3a88  0000002d`0000002d

fffffa60`04cc3a90  00000000`00000000

fffffa60`04cc3a98  00000000`00000000

fffffa60`04cc3aa0  00000000`00000000

fffffa60`04cc3aa8  00000000`00000000

fffffa60`04cc3ab0  00000000`00000000

fffffa60`04cc3ab8  00000000`00000000

fffffa60`04cc3ac0  00000000`00000000

fffffa60`04cc3ac8  00000000`00000000

[…]
1: kd> .exr fffffa60`04cc3b78

ExceptionAddress: 0000000075319b59

   ExceptionCode: c0000005 (Access violation)

  ExceptionFlags: 00000000

NumberParameters: 2

   Parameter[0]: 0000000000000000

   Parameter[1]: 0000000000000030

Attempt to read from address 0000000000000030
Looking at drivers shows that the system was virtualized under a VM:
1: kd> lm

[...]

fffffa60`037bc000 fffffa60`037e0000   3rdpartyVM   (deferred)

[...]
Therefore we suggested to test the application without VM to rule out vitrualization influence.
- Dmitry Vostokov @ DumpAnalysis.org -
Posted in Crash Dump Analysis, Crash Dump Patterns, Virtualization | 6 Comments »
Friday, July 10th, 2009
Sometimes we get rare or hardware-related bugchecks and these might have been influenced by hardware virtualization (that is also a software and could have its own defects). Therefore it is beneficial to recognize when a system is running under a VM (Virtualized System pattern):
Memory Dumps from Xen-virtualized Windows
Memory dumps from VMware images (Virtual PC diagnostics in post comments)
Memory Dumps from Hyper-Virtualized Windows
For example, we get the following bugcheck and stack trace for the first processor:
0: kd> !analyze -v

[...]

CLOCK_WATCHDOG_TIMEOUT (101)

An expected clock interrupt was not received on a secondary processor in an

MP system within the allocated interval. This indicates that the specified

processor is hung and not processing interrupts.

Arguments:

Arg1: 00000060, Clock interrupt time out interval in nominal clock ticks.

Arg2: 00000000, 0.

Arg3: 805d8120, The PRCB address of the hung processor.

Arg4: 00000001, 0.
CURRENT_IRQL: 1c
STACK_TEXT:

8d283694 816df8a5 nt!KeBugCheckEx+0x1e

8d2836c8 816e163d nt!KeUpdateRunTime+0xd5

8d2836c8 84617008 nt!KeUpdateSystemTime+0xed

WARNING: Frame IP not in any known module. Following frames may be wrong.

8d283748 816f46a1 0×84617008

8d283758 816fa6aa nt!HvlpInitiateHypercall+0×21

8d283784 8166aca5 nt!HvlNotifyLongSpinWait+0×2b

8d2837a0 816cce7e nt!KeFlushSingleTb+0xc4

8d283808 81681db4 nt!MmAccessFault+0xc1d

8d283808 816dd033 nt!KiTrap0E+0xdc

8d28389c 8168ed58 nt!memcpy+0×33

8d283954 816712bf nt!MmCopyToCachedPage+0×1193

8d2839ec 81663053 nt!CcMapAndCopy+0×210

8d283a74 8c688218 nt!CcFastCopyWrite+0×283

8d283b98 8c40badc Ntfs!NtfsCopyWriteA+0×23e

8d283bcc 8c40bcab fltmgr!FltpPerformFastIoCall+0×22e

8d283bf8 8c41dc30 fltmgr!FltpPassThroughFastIo+0×7d

8d283c3c 818471cd fltmgr!FltpFastIoWrite+0×146

8d283d38 8167ec7a nt!NtWriteFile+0×34c

8d283d38 77115e74 nt!KiFastCallEntry+0×12a

01cfee80 00000000 0×77115e74
The thread was servicing a page fault. Notice the gap between KeUpdateSystemTime and HvlpInitiateHypercall. This is normal and consistent code if we look closer:
0: kd> .asm no_code_bytes

Assembly options: no_code_bytes
0: kd> uf HvlpInitiateHypercall

nt!HvlpInitiateHypercall:

816f4680 push    edi

816f4681 push    esi

816f4682 push    ebx

816f4683 mov     eax,dword ptr [esp+10h]

816f4687 mov     edx,dword ptr [esp+14h]

816f468b mov     ecx,dword ptr [esp+18h]

816f468f mov     ebx,dword ptr [esp+1Ch]

816f4693 mov     esi,dword ptr [esp+20h]

816f4697 mov     edi,dword ptr [esp+24h]

816f469b call    dword ptr [nt!HvlpHypercallCodeVa (8176bb8c)]

816f46a1 pop     ebx

816f46a2 pop     esi

816f46a3 pop     edi

816f46a4 ret     18h
0: kd> dp 8176bb8c l1

8176bb8c  84617000
0: kd> uf 84617000

84617000 or      eax,80000000h

84617005 vmcall

84617008ret
We have the address of RET instruction (84617008) on the stack trace:
0: kd> kv

ChildEBP RetAddr  Args to Child

8d283694 816df8a5 00000101 00000060 00000000 nt!KeBugCheckEx+0x1e

8d2836c8 816e163d 84e1521b 000000d1 8d283784 nt!KeUpdateRunTime+0xd5

8d2836c8 8461700884e1521b 000000d1 8d283784 nt!KeUpdateSystemTime+0xed (FPO: [0,2] TrapFrame @ 8d2836d8)

WARNING: Frame IP not in any known module. Following frames may be wrong.

8d283748 816f46a1 84e6c900 22728000 8172e28c 0×84617008

8d283758 816fa6aa 00010008 00000000 22728000 nt!HvlpInitiateHypercall+0×21 (FPO: [6,3,0])

8d283784 8166aca5 22728000 00000000 00000000 nt!HvlNotifyLongSpinWait+0×2b

[…]
The second processor is busy too:
0: kd> !running
System Processors 3 (affinity mask)

  Idle Processors 0
Prcbs  Current   Next

  0    8172c920  84e6c900            ................

  1    805d8120  85138030  85a50d78  …………….
0: kd> !thread 85138030

THREAD 85138030  Cid 0564.11c8  Teb: 7ff9f000 Win32Thread: 00000000 RUNNING on processor 1

IRP List:

    85ab5d00: (0006,01fc) Flags: 00000884  Mdl: 00000000

    85445ab8: (0006,0094) Flags: 00060000  Mdl: 00000000

Not impersonating

DeviceMap                 98a7d558

Owning Process            84f0d938       Image:         Application.exe

Attached Process          N/A            Image:         N/A

Wait Start TickCount      695643         Ticks: 224 (0:00:00:03.500)

Context Switch Count      20

UserTime                  00:00:00.000

KernelTime                00:00:00.000

Win32 Start Address 0x705e2679

Stack Init a1d13000 Current a1d10a70 Base a1d13000 Limit a1d10000 Call 0

Priority 9 BasePriority 8 PriorityDecrement 0 IoPriority 2 PagePriority 5

ChildEBP RetAddr  Args to Child

00000000 00000000 00000000 00000000 00000000 0×0
Because we have (Limit, Current, Base) triple for our thread we check its execution residue on kernel raw stack. We find traces of a hypercall too:
0: kd> dds a1d10000 a1d13000

[...]

a1d1215c  816fa6da nt!HvlEndSystemInterrupt+0x20

a1d12160  40000070

a1d12164  00000000

a1d12168  81608838 hal!HalEndSystemInterrupt+0x7a

a1d1216c  805d8000

a1d12170  a1d12180

a1d12174  81618cc9 hal!HalpIpiHandler+0x189

a1d12178  84f4841b

a1d1217c  000000e1

a1d12180  a1d1222c

a1d12184  84617008

a1d12188  badb0d00

a1d1218c  00000000

a1d12190  81665699 nt!RtlWalkFrameChain+0x58

a1d12194  816659c4 nt!RtlWalkFrameChain+0x377

a1d12198  11c4649e

a1d1219c  00000002

a1d121a0  00000003

a1d121a4  85478444

a1d121a8  0000001f

a1d121ac  00000000

a1d121b0  00000000

a1d121b4  816f46a1 nt!HvlpInitiateHypercall+0×21

a1d121b8  8172c800 nt!KiInitialPCR

a1d121bc  85138030

a1d121c0  85a72ac0

a1d121c4  8171b437 nt!HvlSwitchVirtualAddressSpace+0×28

a1d121c8  00010001

a1d121cc  00000000

a1d121d0  85a72ac0

a1d121d4  85138030

a1d121d8  8172c802 nt!KiInitialPCR+0×2

a1d121dc  00000000

a1d121e0  85138030

a1d121e4  816fa6da nt!HvlEndSystemInterrupt+0×20

a1d121e8  40000070

a1d121ec  00000000

a1d121f0  81608838 hal!HalEndSystemInterrupt+0×7a

a1d121f4  816f46a1 nt!HvlpInitiateHypercall+0×21

a1d121f8  805d8000

a1d121fc  85138030

a1d12200  805dc1e0

a1d12204  8171b437 nt!HvlSwitchVirtualAddressSpace+0×28

a1d12208  00010001

a1d1220c  00000000

a1d12210  00000000

a1d12214  81608468 hal!HalpDispatchSoftwareInterrupt+0×5e

a1d12218  00000000

a1d1221c  00000000

a1d12220  00000206

a1d12224  a1d12240

a1d12228  81608668 hal!HalpCheckForSoftwareInterrupt+0×64

a1d1222c  00000002

a1d12230  00000000

a1d12234  816086a8 hal!KfLowerIrql

a1d12238  00000000

a1d1223c  00000002

a1d12240  a1d12250

a1d12244  8160870c hal!KfLowerIrql+0×64

a1d12248  00000000

a1d1224c  00000000

a1d12250  a1d12294

a1d12254  816e035a nt!KiSwapThread+0×477

a1d12258  85138030

a1d1225c  851380b8

a1d12260  805d8120

a1d12264  0014d1f8

[…]
Looking at raw stack further we can even see that it was processing a page fault too and manually reconstruct its stack trace:
[...]

a1d1074c  85aef510

a1d10750  a1d10768

a1d10754  81678976 nt!IofCallDriver+0×63

a1d10758  84c87d50

a1d1075c  85aef510

a1d10760  00000000

a1d10764  84c87d50

a1d10768  a1d10784

a1d1076c  8166d74e nt!IoPageRead+0×172

a1d10770  85138030

a1d10774  84a1352c

a1d10778  84a134f8

a1d1077c  84a13538

a1d10780  84c87d50

a1d10784  a1d10840

a1d10788  816abf07 nt!MiDispatchFault+0xd14

a1d1078c  00000043

a1d10790  85138030

a1d10794  84a13538

a1d10798  84a1350c

a1d1079c  84a1352c

a1d107a0  8174c800 nt!MmSystemCacheWs

a1d107a4  00000000

a1d107a8  85138030

a1d107ac  a5397bf8

a1d107b0  85b01c48

a1d107b4  00000000

a1d107b8  00000000

a1d107bc  a5397bf8

a1d107c0  84a1358c

a1d107c4  a1d10864

a1d107c8  00000000

a1d107cc  8463a590

a1d107d0  84a134f8

a1d107d4  c0518000

a1d107d8  00000000

a1d107dc  00000000

a1d107e0  00000028

a1d107e4  a1d107f4

a1d107e8  00000000

a1d107ec  00000038

a1d107f0  859f5640

a1d107f4  a4bfa390

a1d107f8  00000000

a1d107fc  00000000

a1d10800  00000000

a1d10804  a1d10938

a1d10808  818652bd nt!MmCreateSection+0×98f

a1d1080c  00000000

a1d10810  846652e8

a1d10814  00000000

a1d10818  00000000

a1d1081c  00000000

a1d10820  00000028

a1d10824  00000000

a1d10828  00000080

a1d1082c  0000000a

a1d10830  85ae1c98

a1d10834  85ae1c20

a1d10838  00000000

a1d1083c  00000000

a1d10840  a1d108b8

a1d10844  816cd325 nt!MmAccessFault+0×10c6

a1d10848  a3000000

a1d1084c  a5397bf8

a1d10850  00000000

a1d10854  8174c800 nt!MmSystemCacheWs

a1d10858  00000000

a1d1085c  00000000

a1d10860  a5397bf8

a1d10864  00000000

[…]
0: kd> k L=a1d10750 a1d10750 a1d10750

ChildEBP RetAddr

WARNING: Frame IP not in any known module. Following frames may be wrong.

a1d10750 81678976 0xa1d10750

a1d10768 8166d74e nt!IofCallDriver+0x63

a1d10784 816abf07 nt!IoPageRead+0x172

a1d10840 816cd325 nt!MiDispatchFault+0xd14

a1d108b8 816f0957 nt!MmAccessFault+0x10c6

a1d10924 8181c952 nt!MmCheckCachedPageState+0x801

a1d109b0 8c60f850 nt!CcCopyRead+0x435

a1d109dc 8c613c52 Ntfs!NtfsCachedRead+0x13b

a1d10abc 8c612b6f Ntfs!NtfsCommonRead+0x105a

a1d10b2c 81678976 Ntfs!NtfsFsdRead+0x273

a1d10b44 8c40cba7 nt!IofCallDriver+0x63

a1d10b68 8c40d7c7 fltmgr!FltpLegacyProcessingAfterPreCallbacksCompleted+0x251

a1d10ba0 8c40dbe7 fltmgr!FltPerformSynchronousIo+0xb9

a1d10c10 9ca680e5 fltmgr!FltReadFile+0x2ed

[...]
A bit of reverse engineering offtopic here: I think that the absence of a trap means that cache processing NTFS code reuses page fault handling code.
- Dmitry Vostokov @ DumpAnalysis.org -
Posted in Assembly Language, Crash Dump Analysis, Crash Dump Patterns, Virtualization, Windows Server 2008 | 2 Comments »
Thursday, May 7th, 2009
The community of Citrix and Microsoft Terminal Services / Virtualization meets again in Dublin, Ireland:
Event: PubForum 2009 Dublin - just one this year
Date: 5 to 7 June 2009
Where: Dublin, Ireland
Event Location: Camden Court Hotel, Dublin
Sessions: 20
Master Classes: 6
Visitors: 75 - 80
Attendee Fee: just 199 EUR
Agenda of the Event

- Dmitry Vostokov @ DumpAnalysis.org -
Posted in Announcements, Citrix, Virtualization, Windows Server 2008, Windows System Administration | No Comments »