Trace Analysis Patterns (Part 261)
Sunday, June 28th, 2026Large traces and logs often contain many combinations of conditions. The analyst sees many individual events but struggles to see which combinations are essential and which are redundant, equivalent, or adjacent manifestations of the same underlying behavior. The trace appears complex because the diagnostic space is fragmented into many small observations.
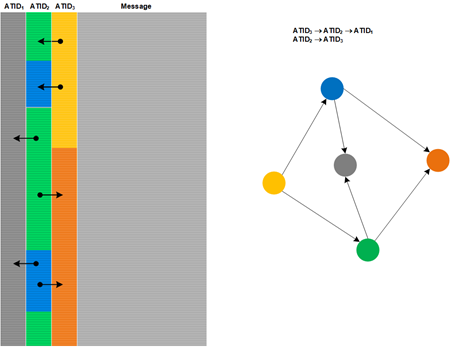
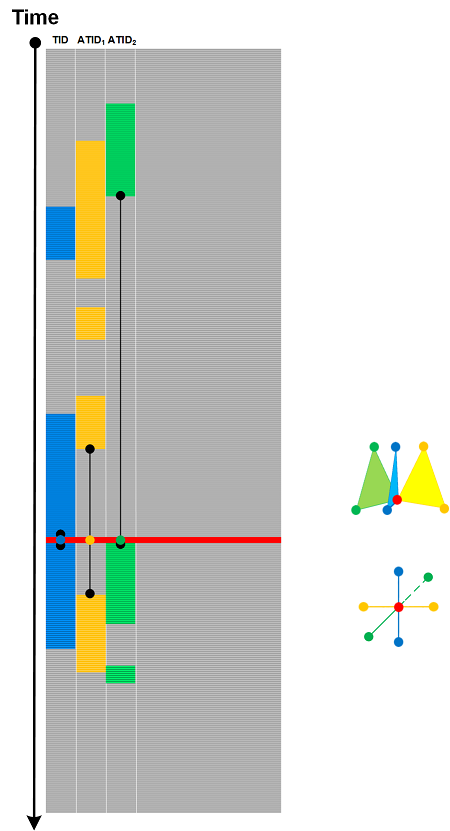
Karnaugh Map analysis pattern is useful when trace or log fragments can be classified by several binary or categorical dimensions, for example, distinctive features of Marked Messages. We project events into a structured logical space, similar to how a Karnaugh map projects Boolean combinations into an adjacency-preserving logical grid. Grouping cells in this grid simplifies the apparent complexity of many observed failure combinations into a minimal Boolean diagnostic condition, separating essential root cause dimensions from incidental ones that vary freely without affecting the outcome.
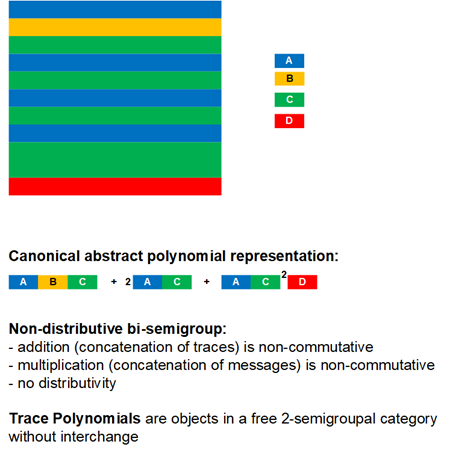
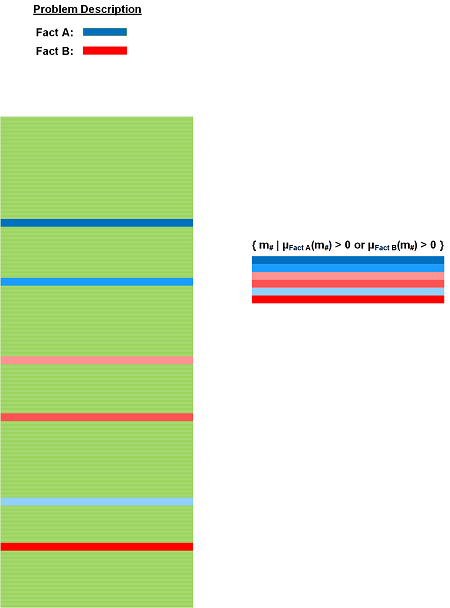
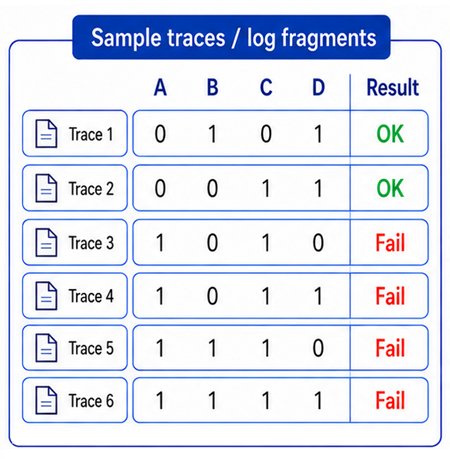
For example, suppose we analyze failures using four binary dimensions:
- A - Auth token expired
- B - Cache miss
- C - Backend timeout
- D - Retry attempt
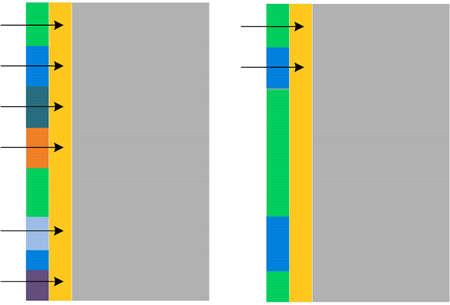
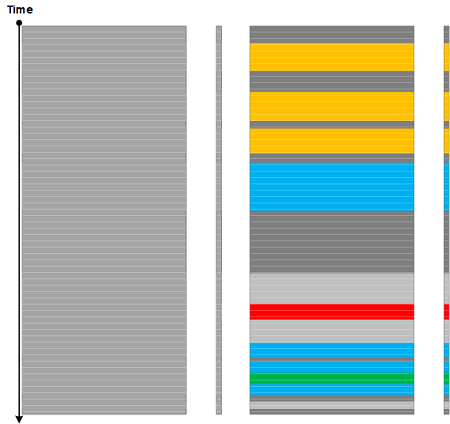
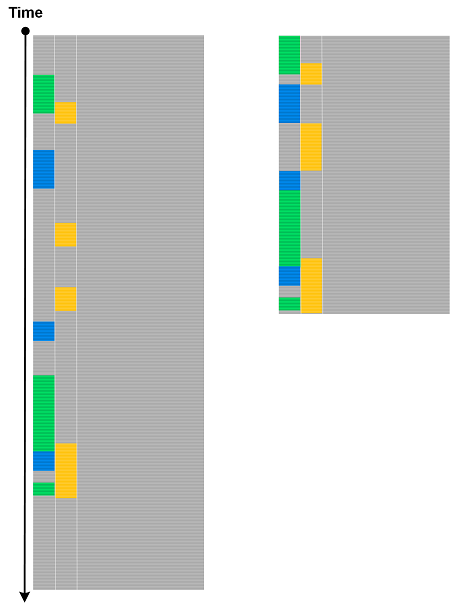
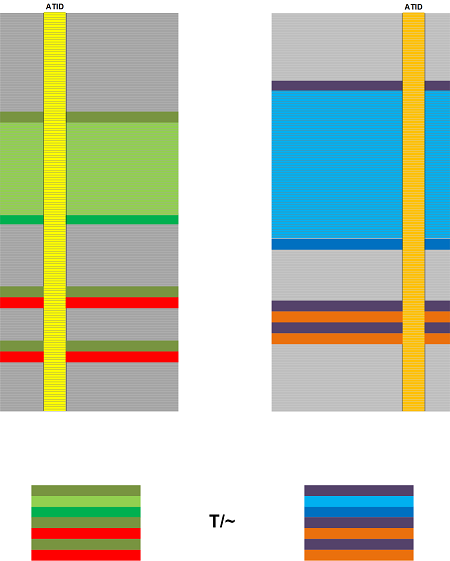
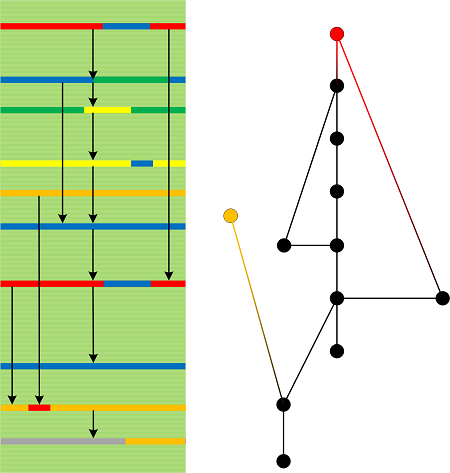
We collected many traces for both working and non-working (failure) cases, and at first, it looks like there are four different failure cases:
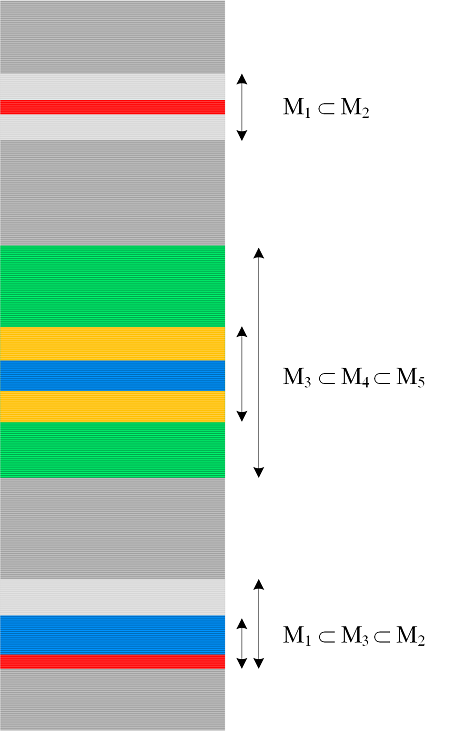
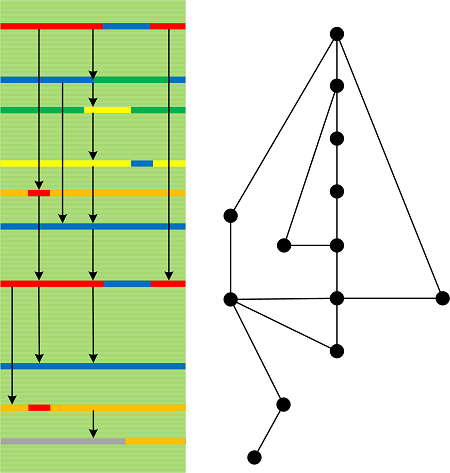
But in Karnaugh-map form, these four cases form one group. The varying dimensions are B and D, while A and C remain constant:
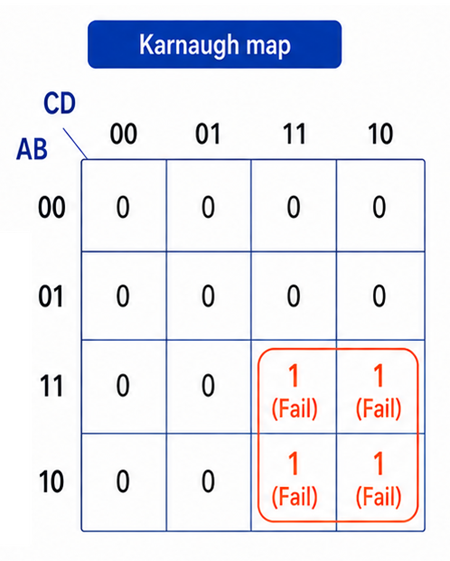
So the simplified diagnostic condition is: failure occurs when the auth token expires and the backend times out, regardless of cache state or retry state. Or, in Boolean-like form: Failure = A ∧ C. This means cache misses and retries are not root discriminators here. They are incidental dimensions.
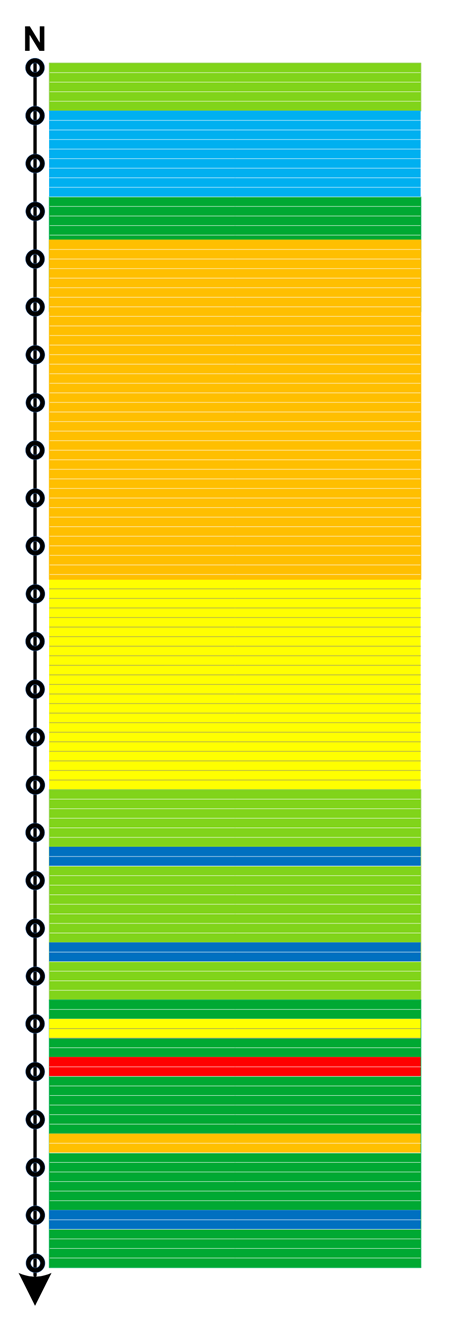
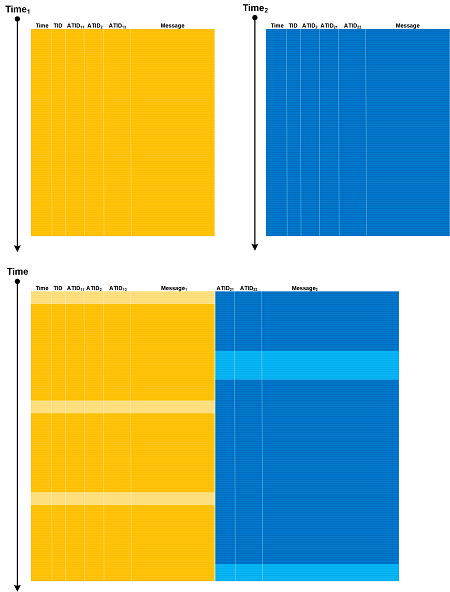
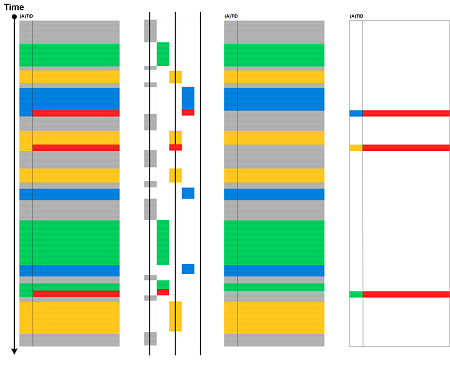
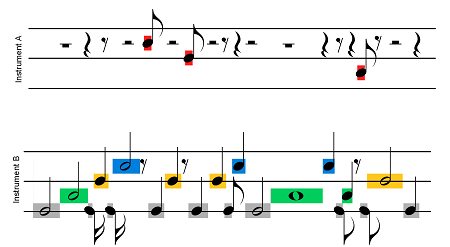
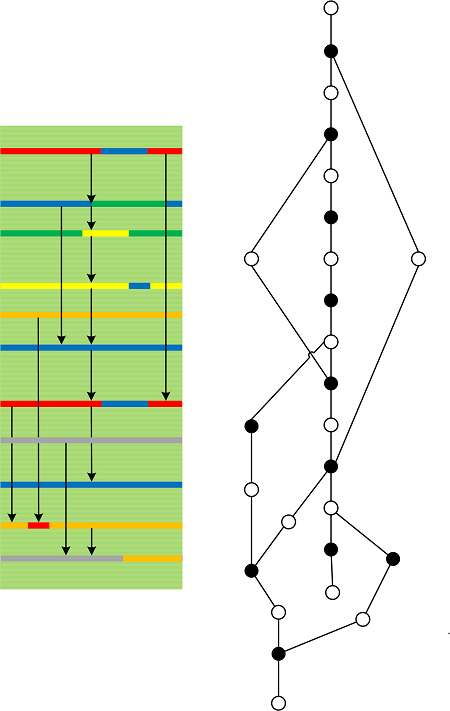
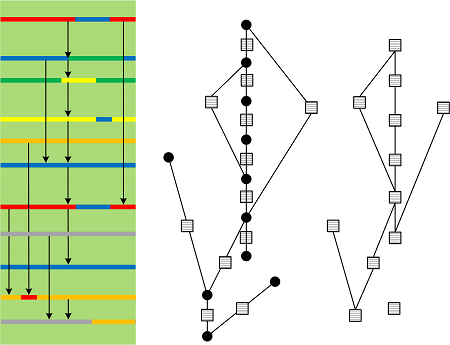
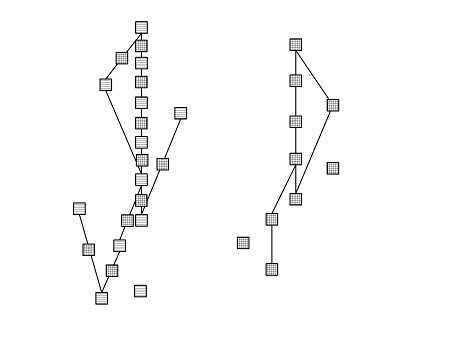
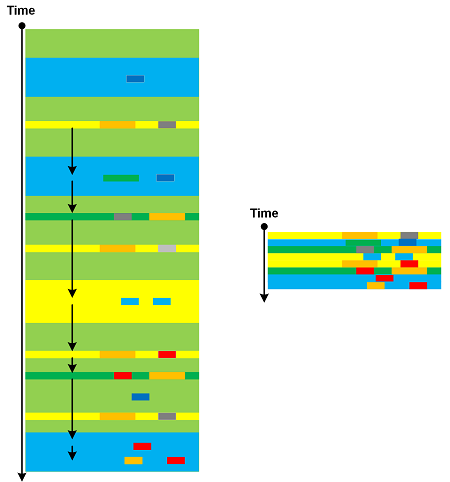
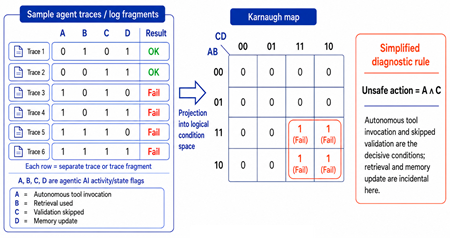
Here is a similar example for agentic AI:
- Dmitry Vostokov @ DumpAnalysis.org + TraceAnalysis.org -