Crash Dump Analysis Patterns (Part 257)
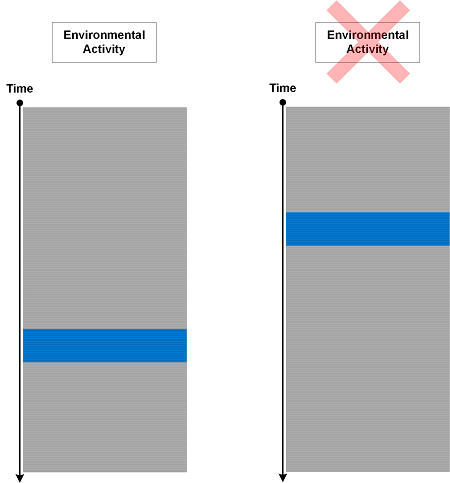
Tuesday, November 20th, 2018In addition to Exception Thread analysis pattern (or several threads when we have Multiple Exceptions) that we named Exception Stack Trace there may be a separated thread that reports such exceptions (Exception Reporting Thread):
This dump file has an exception of interest stored in it.

The stored exception information can be accessed via .ecxr.

(4a0c.2ab4): Application hang - code cfffffff (first/second chance not available)

win32u!NtUserCreateWindowEx+0x14:
0:002> kc

# Call Site

00 win32u!NtUserCreateWindowEx

01 user32!VerNtUserCreateWindowEx

02 user32!CreateWindowInternal

03 user32!CreateWindowExW

04 CoreMessaging!Microsoft::CoreUI::Dispatch::UserAdapter:: InitializeWindow

05 CoreMessaging!Microsoft::CoreUI::Dispatch::UserAdapter::Initialize

06 CoreMessaging!Microsoft::CoreUI::Dispatch::EventLoop::Callback_Run

07 CoreMessaging!Microsoft::CoreUI::Messaging::MessageSession$R:: Microsoft__CoreUI__IExportMessageSession_Impl::Run

08 CoreMessaging!Microsoft::CoreUI:: IExportMessageSession$X__ExportAdapter::Run

09 CoreMessaging!Windows::System::DispatcherQueue::RunLoop

0a CoreMessaging!Windows::System::DispatcherQueueController:: DispatcherQueueThreadProc

0b kernel32!BaseThreadInitThunk

0c ntdll!RtlUserThreadStart
0:002> ~42kc

# Call Site

00 ntdll!NtWaitForMultipleObjects

01 ntdll!WerpWaitForCrashReporting

02 ntdll!RtlReportExceptionEx

03 eModel!s_ReportAsyncBoundaryHangOnSuspendedThread

04 kernel32!BaseThreadInitThunk

05 ntdll!RtlUserThreadStart
We can spot such a thread in Stack Trace Collection.
Although the example above is for application hang (Blocked Thread) and also illustrates Self-Diagnosis, similar threads may report Handled Exceptions. Usually, Exception Threads are also Exception Reporting Threads as shown in Invalid Parameter analysis pattern example.
- Dmitry Vostokov @ DumpAnalysis.org + TraceAnalysis.org -