Archive for the ‘Memory Analysis Forensics and Intelligence’ Category
Friday, July 13th, 2012
For some time I was struggling with finding a good name for memory dump and software trace analysis activities. The name Memoretics I use for the science of memory dump analysis (that also incorporates software traces) seems not so good to describe the whole practical activity that should be transparent to everyone in IT. Fortunately, I timely understood that all these activities constitute the essence of software diagnostics that previously lacked any solid foundation. Thus, Software Diagnostics Institute was reborn from the previous Crash Dump Analysis Portal. This institute does pure and applied research and scientific activities and in recent years was funded mainly from OpenTask publisher and recently from Memory Dump Analysis Services. The latter company also recognized that the broadening of its commercial activities requires a new name. So, Software Diagnostics Services was reborn:
The First Comprehensive Software Diagnostics Service
- Dmitry Vostokov @ DumpAnalysis.org + TraceAnalysis.org -
Posted in Announcements, Cloud Memory Dump Analysis, Complete Memory Dump Analysis, Core Dump Analysis, Crash Analysis Report Environment (CARE), Crash Dump Analysis, Debugging, Debugging Bureau, Debugging Industry, Debugging Methodology, Debugging Today, Debugging Trends, Education, Education and Research, Escalation Engineering, Event Tracing for Windows (ETW), First Fault Software Diagnostics, Generative Debugging, JIT Crash Analysis, JIT Memory Space Analysis, Java Debugging, Kernel Development, Kernel Memory Dump Analysis, Linux Crash Corner, MFC Debugging, Mac Crash Corner, Mac OS X, Malware Analysis, Memoretics, Memory Analysis Forensics and Intelligence, Memory Analysis Report System, Memory Dump Analysis Methodology, Memory Dump Analysis Services, Minidump Analysis, New Debugging School, Pattern-Driven Debugging, Pattern-Driven Software Support, Performance Monitoring, Root Cause Analysis, SQL Debugging, Security, Software Debugging Services, Software Diagnostics, Software Diagnostics Institute, Software Diagnostics Services, Software Engineering, Software Problem Solving, Software Technical Support, Software Trace Analysis, Software Trace Analysis Report Environment (STARE), Tools, Training and Seminars, Troubleshooting Methodology, Unified Software Diagnostics, Windows 7, Windows 8, Windows Azure, Windows Mobile, Windows Server 2008, Windows System Administration, x64 Mac OS X, x64 Windows | No Comments »
Monday, April 9th, 2012
Memory Dump Analysis Services organizes a free Webinar on Unified Software Diagnostics (USD) and the new scalable cost-effective software support model called Pattern-Driven Software Support devised to address various shortcomings in existing tiered software support organizations. Examples cover Windows, Mac OS and Linux.

Date: 22nd of June, 2012
Time: 17:00 (BST) 12:00 (EST) 09:00 (PST)
Duration: 60 minutes
Space is limited.
Reserve your Webinar seat now at:
https://www3.gotomeeting.com/register/172771078
- Dmitry Vostokov @ DumpAnalysis.org + TraceAnalysis.org -
Posted in Announcements, Best Practices, Crash Dump Analysis, Crash Dump Patterns, Debugging, Debugging Methodology, Debugging Trends, Economics, Escalation Engineering, Event Tracing for Windows (ETW), JIT Crash Analysis, JIT Memory Space Analysis, Malware Analysis, Malware Patterns, Memoretics, Memory Analysis Forensics and Intelligence, Memory Dump Analysis Methodology, Memory Dump Analysis Services, New Acronyms, New Debugging School, Pattern Prediction, Pattern-Driven Debugging, Pattern-Driven Software Support, Root Cause Analysis, Science of Memory Dump Analysis, Science of Software Tracing, Software Behavior DNA, Software Behavior Patterns, Software Behavioral Genome, Software Diagnostics, Software Engineering, Software Narratology, Software Problem Description Patterns, Software Problem Solving, Software Support Patterns, Software Technical Support, Software Trace Analysis, Software Troubleshooting Patterns, Software Victimology, Software and Economics, Structural Memory Patterns, Structural Trace Patterns, Systems Thinking, Testing, Tools, Trace Analysis Patterns, Training and Seminars, Troubleshooting Methodology, UI Problem Analysis Patterns, Unified Debugging Patterns, Unified Software Diagnostics, Victimware, Webinars, Workaround Patterns | No Comments »
Monday, December 12th, 2011
More than 4 years passed since I provided a longer structuralist definition. Recently I came to recognize a pattern-driven iterative and incremental nature of memory and software trace analysis and post-construction software problem solving in general and therefore a one sentence definition became necessary:
“Recognition and interpretation of patterns of software behavior”
- Dmitry Vostokov @ DumpAnalysis.org + TraceAnalysis.org -
Posted in Announcements, Crash Dump Analysis, Crash Dump Patterns, Malware Analysis, Malware Patterns, Memiotics (Memory Semiotics), Memoretics, Memory Analysis Forensics and Intelligence, Science of Memory Dump Analysis, Science of Software Tracing, Software Behavior Patterns, Software Narratology, Software Problem Solving, Software Trace Analysis, Structural Memory Patterns, Structural Trace Patterns, Trace Analysis Patterns, Victimware | No Comments »
Monday, September 26th, 2011
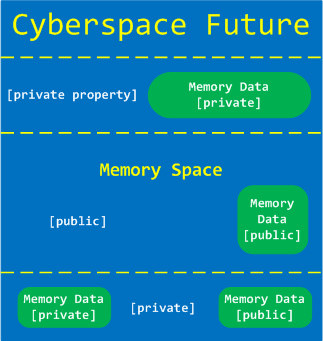
Memoretics views Cyber Space as Memory Space + Memory Data. Here Memory Space consists of many different memory spaces. Although data is private property memory space where it is located is not:
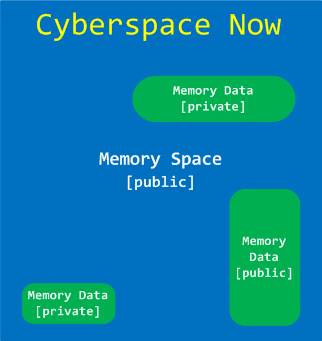
We propose private property on memory spaces and their partitions as a solution to various Cyber problems such as Cyber Crime and Cyber War:
- Dmitry Vostokov @ DumpAnalysis.org + TraceAnalysis.org -
Posted in Announcements, Cyber Intelligence, Cyber Problems, Cyber Security, Cyber Space, Cyber Warfare, Memory Analysis Forensics and Intelligence, Security | No Comments »
Wednesday, September 21st, 2011
Memoretics promotes pattern-driven memory dump and software trace analysis which has many uses but not limited to:
- Software and site reliability
- Software Debugging
- QA and Software Testing
- Computer Security
- Software Troubleshooting
- Malware Research and Analysis
- Tools as a Service (TaaS)
- Supportability
- Software Diagnostics

- Dmitry Vostokov @ DumpAnalysis.org + TraceAnalysis.org -
Posted in Cloud Memory Dump Analysis, Computer Forensics, Crash Dump Analysis, Crash Dump Patterns, DebugWare Patterns, Debugging, Debugging Trends, Escalation Engineering, Malware Analysis, Malware Patterns, Memiotics (Memory Semiotics), Memoretics, Memory Analysis Forensics and Intelligence, Metadefect Template Library, Metamalware, Pattern Models, Pattern Prediction, Reverse Engineering, Root Cause Analysis, Science of Memory Dump Analysis, Science of Software Tracing, Security, Software Behavior DNA, Software Behavior Patterns, Software Behavioral Genome, Software Defect Construction, Software Engineering, Software Generalist, Software Narratology, Software Support Patterns, Software Technical Support, Software Trace Analysis, Software Troubleshooting Patterns, Structural Memory Patterns, Structural Trace Patterns, Systems Thinking, Testing, Tools, Trace Analysis Patterns, Troubleshooting Methodology, UI Problem Analysis Patterns, Unified Debugging Patterns, Victimware, Windows System Administration, Workaround Patterns | No Comments »
Wednesday, September 21st, 2011
Memoretics as a science of memory snapshots borrows many ideas from the following disciplines (the list is not exhaustive):
- Troubleshooting and Debugging
- Intelligence Analysis
- Critical Thinking
- Forensics
- Linguistics
- Archaeology
- Psychoanalysis
- History
- Mathematics: Sets and Categories
- Literary Criticism and Narratology
It also contributes many ideas back. The following diagram depicts such an interaction:

- Dmitry Vostokov @ DumpAnalysis.org + TraceAnalysis.org -
Posted in Archaeology of Computer Memory, Categorical Debugging, Computer Forensics, Computer Science, Countefactual Debugging, Crash Dump Analysis, Crash Dump De-analysis, Crash Dump Patterns, Debugging, Debugging Methodology, Dublin School of Security, Education and Research, Escalation Engineering, General Memory Analysis, Generative Debugging, Hermeneutics of Memory Dumps and Traces, History, Intelligence Analysis Patterns, M->analysis, Malware Analysis, Malware Patterns, Mathematics of Debugging, Memiotics (Memory Semiotics), Memoretics, Memory Analysis Forensics and Intelligence, Memory Dump Analysis and History, Memory Systems Language, Memory Visualization, Metadefect Template Library, Metamalware, New Debugging School, Paleo-debugging, Pattern Models, Pattern Prediction, Psychoanalysis of Software Maintenance and Support, Psychology, Reverse Engineering, Root Cause Analysis, Science of Memory Dump Analysis, Science of Software Tracing, Security, Software Architecture, Software Behavior DNA, Software Behavior Patterns, Software Behavioral Genome, Software Chorography, Software Chorology, Software Defect Construction, Software Engineering, Software Narratology, Software Technical Support, Software Trace Analysis, Software Trace Analysis and History, Software Trace Deconstruction, Software Trace Linguistics, Software Trace Reading, Software Trace Visualization, Software Tracing Implementation Patterns, Software Troubleshooting Patterns, Software Victimology, Software and History, Structural Memory Analysis and Social Sciences, Structural Memory Patterns, Structural Trace Patterns, Systems Thinking, Testing, Tools, Trace Analysis Patterns, Troubleshooting Methodology, UI Problem Analysis Patterns, Unified Debugging Patterns, Victimware, Virtualization, Visual Dump Analysis, Workaround Patterns | No Comments »
Friday, June 3rd, 2011
Finally on the parallels between memory dump and software trace analysis and intelligence (Memoretics is a discipline that studies computer memory snapshots and their evolution in time):
Memoretics ”opens a unique window on” software “affairs”.
John H. Hedley, The Challenges of Intelligence Analysis, Strategic Intelligence, Volume 1
- Dmitry Vostokov @ DumpAnalysis.org + TraceAnalysis.org -
Posted in Bugtations, Crash Dump Analysis, Cyber Warfare, General Memory Analysis, Malware Analysis, Memory Analysis Forensics and Intelligence | No Comments »
Friday, May 27th, 2011
Tapping - The act of collecting software traces for subsequent pattern-driven trace analysis. From TAP (Trace Analysis Pattern).
Examples: We started tapping the service for any anomalies. Software tapping methods and tools.
- Dmitry Vostokov @ DumpAnalysis.org + TraceAnalysis.org -
Posted in Debugging, Debugging Slang, Memory Analysis Forensics and Intelligence, Memory Intelligence Agency, New Acronyms, Software Trace Analysis | No Comments »
Thursday, May 26th, 2011
A few years ago when searching for interdisciplinary ideas via metaphorical bijections I found many parallels between memory dump analysis and intelligence. At that time I started reading a book Intelligence Analysis: A Target-Centric Approach, 2nd Edition (currently in the 3rd edition
 ). Now looking at the cover of that book I think it might have later unconsciously influenced the picture of RADII process:


After some break with studying intelligence I now resume it after I found that tapping (trace analysis patterns for general memory traces with extra uncertainty attribute) could be a good basis for intelligence analysis patterns. My recent jump into cyber warfare also contributed to that. As a fictional continuation from MIx line (MI5, MI6 *) I feel the need to create MIA to promote such ideas (it is a well known fact that MI6 initially started as an amateurish organization **).
* MI5 and MI6 both look to me as pool tags  GCHQ sounds like related to Garbage Collector
** Strategic Intelligence [5 volumes], Volume 1
- Dmitry Vostokov @ DumpAnalysis.org + TraceAnalysis.org -
Posted in Announcements, Cyber Warfare, Memory Analysis Forensics and Intelligence, Memory Intelligence Agency, Security, Software Trace Analysis | No Comments »
Sunday, May 22nd, 2011
Being deep into intelligence analysis while preparing for cyberwarfare memory dump analysis presentation I came to an idea of intelligence analysis patterns based on software trace analysis patterns and software narratology. Basically we consider intelligence data as pseudo-software trace messages with an additional probability field (column). Most of the patterns can be transferred and used immediately in intelligence analysis and I’m working on such a map. Because real software trace messages are quite certain (deterministic) where their sequences sometimes not (see, for example, Impossible Trace pattern) there are some unique patterns applicable only in intelligence analysis domain and I’m working on the first such pattern to introduce it in the next part.
- Dmitry Vostokov @ DumpAnalysis.org + TraceAnalysis.org -
Posted in Cyber Warfare, Intelligence Analysis Patterns, Memory Analysis Forensics and Intelligence, Security, Software Narratology, Software Trace Analysis, Software Trace Analysis and History, Trace Analysis Patterns | No Comments »
Saturday, May 21st, 2011
Posted in Announcements, Debugging, EasyDbg, Memory Analysis Forensics and Intelligence, New Acronyms, Software Trace Analysis, Software Trace Reading, Tool Objects, Tools, Trace Analysis Patterns | No Comments »
Thursday, April 21st, 2011
Imagine a pattern-driven crash analysis report (car) when you need it: at the very moment of a crash, just in time! And the car drives you to a problem resolution. Imagine also a periodic pattern-driven just-in-time memory space analysis (JIT MSA) that provides you instant intelligent reports on what’s going on inside memory while your application, service or system is running! This is a forthcoming optional client side part of CARE (Crash Analysis Report Environment) which is being developed by Memory Dump Analysis Services engineering team under the leadership of Alexey Golikov. Combined with generative debugging techniques both client and server parts form a complete unique enterprise crash and hang analysis solution suitable for development and production environments. Stay tuned for further exciting updates.
PS. The car drives on a road to the first fault software problem solving.
- Dmitry Vostokov @ DumpAnalysis.org + TraceAnalysis.org -
Posted in Crash Analysis Report Environment (CARE), Crash Dump Analysis, Debugging, Debugging Methodology, Escalation Engineering, First Fault Problem Solving, Generative Debugging, JIT Crash Analysis, JIT Memory Space Analysis, Memory Analysis Forensics and Intelligence, Memory Dump Analysis Services, Pattern Prediction, Software Behavior Patterns, Software Engineering, Software Technical Support, Testing, Tools, Windows System Administration | No Comments »
Sunday, April 17th, 2011
I’m pleased to announce that MDAA, Volume 5 is available in PDF format:
www.dumpanalysis.org/Memory+Dump+Analysis+Anthology+Volume+5
It features:
- 25 new crash dump analysis patterns
- 11 new pattern interaction case studies (including software tracing)
- 16 new trace analysis patterns
- 7 structural memory patterns
- 4 modeling case studies for memory dump analysis patterns
- Discussion of 3 common analysis mistakes
- Malware analysis case study
- Computer independent architecture of crash analysis report service
- Expanded coverage of software narratology
- Metaphysical and theological implications of memory dump worldview
- More pictures of memory space and physicalist art
- Classification of memory visualization tools
- Memory visualization case studies
- Close reading of the stories of Sherlock Holmes: Dr. Watson’s observational patterns
- Fully cross-referenced with Volume 1, Volume 2, Volume 3, and Volume 4
Its table of contents is available here:
www.dumpanalysis.org/MDAA/MDA-Anthology-V5-TOC.pdf
Paperback and hardcover versions should be available in a week or two. I also started working on Volume 6 that should be available in November-December.
- Dmitry Vostokov @ DumpAnalysis.org + TraceAnalysis.org -
Posted in Aesthetics of Memory Dumps, Analysis Notation, Announcements, AntiPatterns, Archaeology of Computer Memory, Art, Assembly Language, Best Practices, Books, C and C++, CDF Analysis Tips and Tricks, Categorical Debugging, Citrix, Common Mistakes, Common Questions, Complete Memory Dump Analysis, Computer Forensics, Computer Science, Crash Analysis Report Environment (CARE), Crash Dump Analysis, Crash Dump De-analysis, Crash Dump Patterns, Crash Dumps for Dummies, Cyber Warfare, Debugging, Debugging Bureau, Debugging Industry, Debugging Methodology, Debugging Slang, Debugging Trends, Deep Down C++, Dr. Watson, Dublin School of Security, Education and Research, Escalation Engineering, Fun with Crash Dumps, Fun with Debugging, Fun with Software Traces, General Memory Analysis, Hermeneutics of Memory Dumps and Traces, Images of Computer Memory, Kernel Development, Malware Analysis, Mathematics of Debugging, Memiotics (Memory Semiotics), Memory Analysis Forensics and Intelligence, Memory Diagrams, Memory Dump Analysis Services, Memory Dumps in Myths, Memory Space Art, Memory Systems Language, Memory Visualization, Memory and Glitches, Metaphysics of Memory Worldview, Multithreading, Music for Debugging, New Acronyms, New Debugging School, New Words, Pattern Models, Philosophy, Physicalist Art, Publishing, Reverse Engineering, Science of Memory Dump Analysis, Science of Software Tracing, Security, Software Architecture, Software Behavior Patterns, Software Chorography, Software Chorology, Software Defect Construction, Software Engineering, Software Generalist, Software Maintenance Institute, Software Narratology, Software Technical Support, Software Trace Analysis, Software Trace Reading, Software Trace Visualization, Software Tracing for Dummies, Software Troubleshooting Patterns, Software Victimology, Structural Memory Patterns, Structural Trace Patterns, Systems Thinking, Testing, The Way of Philip Marlowe, Tools, Trace Analysis Patterns, Training and Seminars, Troubleshooting Methodology, Victimware, Vista, Webinars, WinDbg Scripting Extensions, WinDbg Scripts, WinDbg Tips and Tricks, WinDbg for GDB Users, Windows 7, Windows Server 2008, Windows System Administration, Workaround Patterns, x64 Windows | No Comments »
Monday, April 11th, 2011
Memory Dump Analysis Services plans a free Webinar in July to introduce a uniform methodology and tools for analysis of memory in cyber intelligence and counterintelligence activities.

- Dmitry Vostokov @ DumpAnalysis.org + TraceAnalysis.org -
Posted in Announcements, Crash Dump Analysis, Cyber Warfare, Memory Analysis Forensics and Intelligence, Memory Dump Analysis Services, Security, Software Trace Analysis, Tools, Training and Seminars, Webinars | No Comments »
Saturday, March 26th, 2011
The presentation materials from the webinar (25th of March, 2011) are available for download:
http://www.dumpanalysis.com/PDSPSI-materials
Thanks to everyone who registered and attended!
- Dmitry Vostokov @ DumpAnalysis.org + TraceAnalysis.org -
Posted in Announcements, Crash Dump Analysis, Crash Dump Patterns, DebugWare Patterns, Debugging, Debugging Methodology, Escalation Engineering, Mac Crash Corner, Malware Analysis, Malware Patterns, Memory Analysis Forensics and Intelligence, Software Architecture, Software Behavior Patterns, Software Engineering, Software Technical Support, Software Trace Analysis, Software Tracing Implementation Patterns, Software Troubleshooting Patterns, Structural Memory Patterns, Structural Trace Patterns, Tools, Trace Analysis Patterns, Training and Seminars, Troubleshooting Methodology, Unified Debugging Patterns, Webinars, Workaround Patterns | No Comments »
Monday, March 7th, 2011

The first Webinar to start an in-depth discussion of pattern-driven software troubleshooting, debugging and maintenance:
Date: 25th of March 2011
Time: 18:30 (GMT) 14:30 (EST) 11:30 (PST)
Duration: 60 minutes
Space is limited.
Reserve your Webinar seat now at:
https://www3.gotomeeting.com/register/448268158
Topics include:
- A Short History of DumpAnalysis.org
- Memory Dump Analysis Patterns
- Troubleshooting and Debugging Tools (Debugware) Patterns
- Software Trace Analysis Patterns
- From Software Defects to Software Behavior
- Workaround Patterns
- Structural Memory Patterns
- Memory Analysis Domain Pattern Hierarchy
- New Directions
Prerequisites: experience in software troubleshooting and/or debugging.
- Dmitry Vostokov @ DumpAnalysis.org + TraceAnalysis.org -
Posted in .NET Debugging, Analysis Notation, Announcements, AntiPatterns, Best Practices, CDA Pattern Classification, Crash Dump Analysis, Crash Dump Patterns, DebugWare Patterns, Debugging, Debugging Methodology, Debugging Trends, Escalation Engineering, Java Debugging, Linux Crash Corner, Mac Crash Corner, Malware Analysis, Malware Patterns, Memory Analysis Forensics and Intelligence, Memory Dump Analysis Services, Pattern Models, Pattern Prediction, Presentations, Software Behavior Patterns, Software Chorology, Software Engineering, Software Narratology, Software Technical Support, Software Trace Analysis, Software Trace Reading, Software Tracing Implementation Patterns, Software Troubleshooting Patterns, Structural Memory Patterns, Structural Trace Patterns, Systems Thinking, Testing, Trace Analysis Patterns, Training and Seminars, Troubleshooting Methodology, Unified Debugging Patterns, Webinars, Workaround Patterns | No Comments »
Monday, February 14th, 2011
My recent desire is to have the ultimate human debugger’s desk: monitors joined together around me to have 360-degree memory surveillance. I haven’t yet been talking about spherical coordinate system for memory analysis, only cylindrical one. Any sponsor?
Source: 360-Degree Memory Analysis
- Dmitry Vostokov @ DumpAnalysis.org + TraceAnalysis.org -
Posted in Crash Dump Analysis, Debugging, Debugging Environment, Memory Analysis Forensics and Intelligence, Memory Dump Analysis Jobs | No Comments »
Saturday, February 5th, 2011
Finally had time today to test python WinDbg extension. I installed python 2.6.6 and used Debugging Tools for Windows x64. The script I used was from the extension web site blog slightly modified and called processes.py:
from pykd import *

nt = loadModule( "nt" )

processList = typedVarList( nt.PsActiveProcessHead, "nt", "_EPROCESS", "ActiveProcessLinks" )

for process in processList:

    dprintln( "".join( [ chr(i) for i in process.ImageFileName.values() ] ) )

    dprintln( "\r" )
I loaded x64 version of pykd.pyd extension and executed the script:
0: kd> !py c:\PyScripts\processes.py

System

smss.exe

csrss.exe

csrss.exe

psxss.exe

winlogon.exe

wininit.exe

services.exe

lsass.exe

lsm.exe

svchost.exe

svchost.exe

svchost.exe

svchost.exe

svchost.exe

svchost.exe

svchost.exe

svchost.exe

spoolsv.exe

mdm.exe

svchost.exe

svchost.exe

svchost.exe

taskhost.exe

dwm.exe

explorer.exe

DTLite.exe

mmc.exe

WZQKPICK.EXE

concentr.exe

pnamain.exe

jusched.exe

wfcrun32.exe

msdtc.exe

iexplore.exe

iexplore.exe

iexplore.exe

splwow64.exe

iexplore.exe

jucheck.exe

iexplore.exe

notepad.exe

notepad.exe

iexplore.exe

notepad.exe

iexplore.exe

notepad.exe

notepad.exe

iexplore.exe

audiodg.exe

CDViewer.exe

wfica32.exe

iexplore.exe

notepad.exe

cmd.exe

conhost.exe

wuauclt.exe

wfica32.exe

wlrmdr.exe

TrustedInstall

wfica32.exe

notepad.exe

iexplore.exe

wmplayer.exe

VISIO.EXE

mspaint.exe

svchost.exe

sppsvc.exe

windbg.exe

mmc.exe

LogonUI.exe

taskeng.exe

NotMyfault.exe
Very good so far. I’m learning now Python language to write more interesting scripts for crash dump analysis pattern diagnostics, mining statistics, formatting and visualization. After browsing Amazon for some time I chose this book for study:
A Primer on Scientific Programming with Python

About 5 or 6 years ago I was thinking about using a Prolog interpreter to write an expert system for crash dump analysis. I even wrote a simple Prolog program to match product hotfixes and was contemplating writing a WinDbg extension especially after I learnt that SWI-Prolog system I used had an interpreter DLL that could be dynamically loaded into a Win32 API application.
- Dmitry Vostokov @ DumpAnalysis.org + TraceAnalysis.org -
Posted in Artificial Intelligence for Debugging, Crash Analysis Report Environment (CARE), Crash Dump Analysis, Crash Dump Patterns, Debugging, Malware Analysis, Memory Analysis Forensics and Intelligence, Memory Analysis Report System, Memory Visualization, Prolog for Debugging, Python for Debugging, WinDbg Scripting Extensions | No Comments »
Monday, January 3rd, 2011
GI Index (Google Insights for Search) shows that crash dump analysis and debugging slowly decline in popularity:
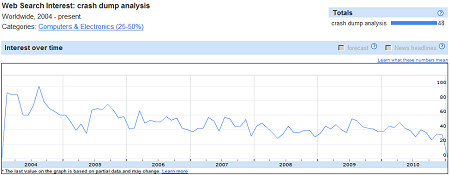
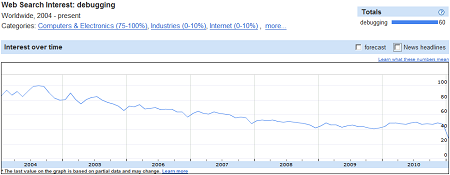
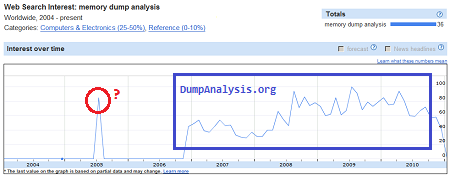
GI for memory dump analysis searches coincides with the birth of DumpAnalysis.org in later 2006 (the only mystery for me is mid 2005 peak):
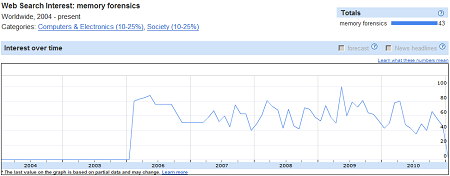
The birth of memory dump analysis as a discipline probably reinforced the emergence of memory forensics in the early 2006:
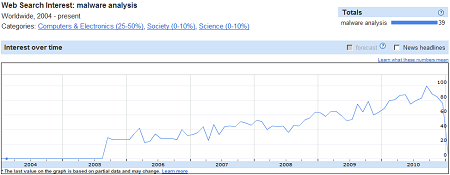
We also see that malware analysis is on the rise and it is not a surprise that DumpAnalysis.org is moving to MARS:
Perhaps mid 2005 peak for memory dump analysis searches coincides with the interest in malware analysis.
- Dmitry Vostokov @ DumpAnalysis.org + TraceAnalysis.org -
Posted in Announcements, Crash Dump Analysis, Debugging, History, Malware Analysis, Memoretics, Memory Analysis Forensics and Intelligence, Security | No Comments »