Archive for the ‘UI Problem Analysis Patterns’ Category
Saturday, January 12th, 2013
These are not really testing patterns but patterns of a user or program behaviour resulting in abnormalities such as colored screens (blue and grey), crash dumps and other support artefacts including performance alerts and UI problem patterns. The first such pattern is called Space Precondition. It is often a case that a process checks for free disk space before proceeding, for example, with updates. This precondition may be violated by a user filling disk after the check but before or during installation. Such was the case with our recent Mac OS X update where we did some copying in the background while the update was downloaded that resulted in insufficient space after reboot, then a grey screen after that and subsequent disk corruption and finally reinstalling OS and loss of several hours better spent with other pattern categories.
- Dmitry Vostokov @ DumpAnalysis.org + TraceAnalysis.org -
Posted in Mac Crash Corner, Mac OS X, Software Behavior Patterns, Software Disruption Patterns, Testing, UI Problem Analysis Patterns, x64 Mac OS X | 1 Comment »
Thursday, November 1st, 2012
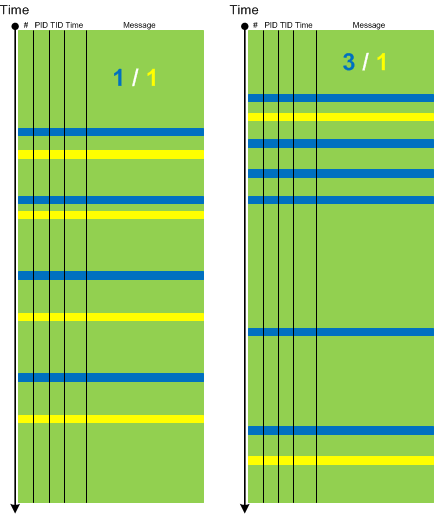
Relative Density pattern describes anomalies related to the semantically related pairs of trace messages, for example, “data arrival” and “data display”. Their statement densities can be put in a ratio (also called specific gravity) and compared between working and non-working scenarios. Because the total number of trace messages cancel each other we have just mutual ratio of two message types. In our hypothetical “data” example the increased ratio of “data arrival” to “data display” messages accounts for reported visual data loss and sluggish GUI.
- Dmitry Vostokov @ DumpAnalysis.org + TraceAnalysis.org -
Posted in Software Trace Analysis, Trace Analysis Patterns, UI Problem Analysis Patterns | 1 Comment »
Sunday, September 9th, 2012
We continue with such problem pattern category and discuss Unresponsive Window pattern. The previous one was Error Message Box. We all see hang windows from time to time. This can happen, for example, from a main thread blocked in a wait chain. Some windows become unresponsive only temporary, for example, when a window message loop results in a CPU intensive window procedure code path. When I open large WinDbg logs generated by WinDbg scripts running on a complete memory dump in Notepad it opens up a frozen window for some seconds and sometimes for a minute or two. To get an unresponsive window for a longer time I opened a PDF file with a size of a few MB and I attached WinDbg. I got this stack trace:
0:000> k

Child-SP          RetAddr           Call Site

00000000`001ecce0 000007fe`ff9fdf89 USP10!otlCacheManager::GetNextLookup+0x12a

00000000`001ecd40 000007fe`ff9fa134 USP10!ApplyFeatures+0x489

00000000`001ed000 000007fe`ff9e1600 USP10!SubstituteOtlGlyphs+0x224

00000000`001ed0b0 000007fe`ff9d4b60 USP10!GenericEngineGetGlyphs+0x1000

00000000`001ed450 000007fe`ff9989c5 USP10!ShlShape+0x7a0

00000000`001ed670 000007fe`ff9a7363 USP10!ScriptShape+0x205

00000000`001ed710 000007fe`ff9a8ac9 USP10!RenderItemNoFallback+0x433

00000000`001ed7d0 000007fe`ff9a8d86 USP10!RenderItemWithFallback+0x129

00000000`001ed820 000007fe`ff9aa5f7 USP10!RenderItem+0x36

00000000`001ed870 000007fe`ff99b2c9 USP10!ScriptStringAnalyzeGlyphs+0x277

00000000`001ed910 000007fe`ff30285c USP10!ScriptStringAnalyse+0x399

00000000`001ed990 000007fe`ff3031c1 LPK!EditStringAnalyse+0x1d4

00000000`001eda70 000007fe`fc876c05 LPK!EditCchInWidth+0x4e

00000000`001edad0 000007fe`fc85862e COMCTL32!EditML_BuildchLines+0x221

00000000`001edba0 000007fe`fc878f56 COMCTL32!Edit_ResetTextInfo+0x82

00000000`001edbe0 000007fe`fc85a566 COMCTL32!EditML_WndProc+0x456

00000000`001edcd0 00000000`77a19bd1 COMCTL32!Edit_WndProc+0xe0a

00000000`001edd70 00000000`77a16aa8 USER32!UserCallWinProcCheckWow+0x1ad

00000000`001ede30 00000000`77a16bad USER32!SendMessageWorker+0x682

00000000`001edec0 00000000`ff7f4256 USER32!SendMessageW+0x5c

00000000`001edf10 00000000`ff7f43d6 NOTEPAD!LoadFile+0x7cb

00000000`001ee260 00000000`ff7f1018 NOTEPAD!NPInit+0x802

00000000`001efbb0 00000000`ff7f133c NOTEPAD!WinMain+0xc7

00000000`001efc30 00000000`7764652d NOTEPAD!DisplayNonGenuineDlgWorker+0x2da

00000000`001efcf0 00000000`77b2c521 kernel32!BaseThreadInitThunk+0xd

00000000`001efd20 00000000`00000000 ntdll!RtlUserThreadStart+0x1d
Another notepad.exe instance had this similar stack trace:
0:000> k

Child-SP          RetAddr           Call Site

00000000`0015ca60 000007fe`ff9e2152 USP10!ShapingLibraryInternal::RestoreCharMap+0x12

00000000`0015cab0 000007fe`ff9d80b8 USP10!GenericEngineGetGlyphPositions+0x2a2

00000000`0015ce60 000007fe`ff9d548e USP10!ShapingGetGlyphPositions+0x8c8

00000000`0015d030 000007fe`ff998c72 USP10!ShlPlace+0x2de

00000000`0015d1e0 000007fe`ff9a742d USP10!ScriptPlace+0x1f2

00000000`0015d270 000007fe`ff9a8ac9 USP10!RenderItemNoFallback+0x4fd

00000000`0015d330 000007fe`ff9a8d86 USP10!RenderItemWithFallback+0x129

00000000`0015d380 000007fe`ff9aa5f7 USP10!RenderItem+0x36

00000000`0015d3d0 000007fe`ff99b2c9 USP10!ScriptStringAnalyzeGlyphs+0x277

00000000`0015d470 000007fe`ff30285c USP10!ScriptStringAnalyse+0x399

00000000`0015d4f0 000007fe`ff3031c1 LPK!EditStringAnalyse+0x1d4

00000000`0015d5d0 000007fe`fc876c05 LPK!EditCchInWidth+0x4e

00000000`0015d630 000007fe`fc85862e COMCTL32!EditML_BuildchLines+0x221

00000000`0015d700 000007fe`fc878f56 COMCTL32!Edit_ResetTextInfo+0x82

00000000`0015d740 000007fe`fc85a566 COMCTL32!EditML_WndProc+0x456

00000000`0015d830 00000000`77a19bd1 COMCTL32!Edit_WndProc+0xe0a

00000000`0015d8d0 00000000`77a16aa8 USER32!UserCallWinProcCheckWow+0x1ad

00000000`0015d990 00000000`77a16bad USER32!SendMessageWorker+0x682

00000000`0015da20 00000000`ff7f4256 USER32!SendMessageW+0x5c

00000000`0015da70 00000000`ff7f43d6 NOTEPAD!LoadFile+0×7cb

00000000`0015ddc0 00000000`ff7f1018 NOTEPAD!NPInit+0×802

00000000`0015f710 00000000`ff7f133c NOTEPAD!WinMain+0xc7

00000000`0015f790 00000000`7764652d NOTEPAD!DisplayNonGenuineDlgWorker+0×2da

00000000`0015f850 00000000`77b2c521 kernel32!BaseThreadInitThunk+0xd

00000000`0015f880 00000000`00000000 ntdll!RtlUserThreadStart+0×1d
This thread is also spiking and all work was done in a Unicode script processor as the PDF file was obviously not an ASCII text file:
0:000> !runaway f

User Mode Time

Thread       Time

0:fa0       0 days 0:00:12.402

Kernel Mode Time

Thread       Time

0:fa0       0 days 0:00:10.826

Elapsed Time

Thread       Time

0:fa0       0 days 0:00:34.654
0:000> lmv m USP10

start             end                 module name

000007fe`ff990000 000007fe`ffa59000   USP10      (pdb symbols)          c:\mss\usp10.pdb\DB4EC1196F91457FBB0A462D9D0AFEC31\usp10.pdb

Loaded symbol image file: C:\Windows\system32\USP10.dll

Image path: C:\Windows\system32\USP10.dll

Image name: USP10.dll

Timestamp:        Sat Nov 20 13:15:33 2010 (4CE7C9F5)

CheckSum:         000C4B61

ImageSize:        000C9000

File version:     1.626.7601.17514

Product version:  1.626.7601.17514

File flags:       0 (Mask 3F)

File OS:          40004 NT Win32

File type:        2.0 Dll

File date:        00000000.00000000

Translations:     0409.04b0

CompanyName:      Microsoft Corporation

ProductName:      Microsoft(R) Uniscribe Unicode script processor

InternalName:     Uniscribe

OriginalFilename: Uniscribe

ProductVersion:   1.0626.7601.17514

FileVersion:      1.0626.7601.17514 (win7sp1_rtm.101119-1850)

FileDescription:  Uniscribe Unicode script processor

LegalCopyright:   © Microsoft Corporation. All rights reserved.
We see LoadFile function and find a file name from execution residue on the raw stack:
0:000> dpu 00000000`0015da70

00000000`0015da70  00000000`00000000

00000000`0015da78  00000000`00000000

00000000`0015da80  00000000`00000000

00000000`0015da88  00000000`00000000

00000000`0015da90  00000000`02b40040 "%PDF-1.4..%µµµµ..1 0 obj..<</Type/Catalog/Pages 2 0 R/L"

00000000`0015da98  00000000`00576a62

00000000`0015daa0  00000000`00000000

00000000`0015daa8  00000000`00000000

00000000`0015dab0  00000000`025c0000

00000000`0015dab8  00000000`00000000

00000000`0015dac0  00000000`00000000

00000000`0015dac8  00000000`00000100

00000000`0015dad0  00000000`00000000

00000000`0015dad8  00000000`025c0000

00000000`0015dae0  00000000`00000265

00000000`0015dae8  00000000`ff800b40 "C:\DL\History-Russian-Literature-VIII-Volume2.pdf"

[...]
- Dmitry Vostokov @ DumpAnalysis.org + TraceAnalysis.org -
Posted in Crash Dump Analysis, Crash Dump Patterns, Software Behavior Patterns, UI Problem Analysis Patterns, x64 Windows | No Comments »
Sunday, April 15th, 2012
In a week this short full color book should appear in online bookstores:
- Title: Software Narratology: An Introduction to the Applied Science of Software Stories
- Authors: Dmitry Vostokov, Memory Dump Analysis Services
- Description: This is a transcript of Memory Dump Analysis Services Webinar about Software Narratology: an exciting new discipline and a field of research founded by DumpAnalysis.org. When software executes it gives us its stories in the form of UI events, software traces and logs. Such stories can be analyzed for their structure and patterns for troubleshooting, debugging and problem resolution purposes. Topics also include software narremes and their types, anticipatory software construction and software diagnostics.
- Publisher: OpenTask (April 2012)
- Language: English
- Product Dimensions: 28.0 x 21.6
- Paperback: 26 pages
- ISBN-13: 978-1908043078

- Dmitry Vostokov @ DumpAnalysis.org + TraceAnalysis.org -
Posted in Announcements, Books, CDF Analysis Tips and Tricks, Code Reading, Computer Science, Debugging, Debugging Methodology, Debugging Trends, Education and Research, Escalation Engineering, Event Tracing for Windows (ETW), Hermeneutics of Memory Dumps and Traces, Ideas, Narralog Programming Language, New Debugging School, Pattern-Driven Debugging, Pattern-Driven Software Support, Presentations, Publishing, Root Cause Analysis, SPDL, Science of Software Tracing, Software Behavior DNA, Software Behavior Patterns, Software Behavioral Genome, Software Diagnostics, Software Engineering, Software Narrative Fiction, Software Narrative Science, Software Narratology, Software Narremes, Software Problem Description Patterns, Software Problem Solving, Software Technical Support, Software Trace Analysis, Software Trace Analysis and History, Software Trace Deconstruction, Software Trace Linguistics, Software Trace Modeling, Software Trace Reading, Software Trace Visualization, Software Tracing Implementation Patterns, Software Troubleshooting Patterns, Structural Trace Patterns, Systems Thinking, Testing, Tools, Trace Analysis Patterns, Training and Seminars, Troubleshooting Methodology, UI Problem Analysis Patterns, Unified Debugging Patterns, Unified Software Diagnostics, Webinars | No Comments »
Monday, April 9th, 2012
Memory Dump Analysis Services organizes a free Webinar on Unified Software Diagnostics (USD) and the new scalable cost-effective software support model called Pattern-Driven Software Support devised to address various shortcomings in existing tiered software support organizations. Examples cover Windows, Mac OS and Linux.

Date: 22nd of June, 2012
Time: 17:00 (BST) 12:00 (EST) 09:00 (PST)
Duration: 60 minutes
Space is limited.
Reserve your Webinar seat now at:
https://www3.gotomeeting.com/register/172771078
- Dmitry Vostokov @ DumpAnalysis.org + TraceAnalysis.org -
Posted in Announcements, Best Practices, Crash Dump Analysis, Crash Dump Patterns, Debugging, Debugging Methodology, Debugging Trends, Economics, Escalation Engineering, Event Tracing for Windows (ETW), JIT Crash Analysis, JIT Memory Space Analysis, Malware Analysis, Malware Patterns, Memoretics, Memory Analysis Forensics and Intelligence, Memory Dump Analysis Methodology, Memory Dump Analysis Services, New Acronyms, New Debugging School, Pattern Prediction, Pattern-Driven Debugging, Pattern-Driven Software Support, Root Cause Analysis, Science of Memory Dump Analysis, Science of Software Tracing, Software Behavior DNA, Software Behavior Patterns, Software Behavioral Genome, Software Diagnostics, Software Engineering, Software Narratology, Software Problem Description Patterns, Software Problem Solving, Software Support Patterns, Software Technical Support, Software Trace Analysis, Software Troubleshooting Patterns, Software Victimology, Software and Economics, Structural Memory Patterns, Structural Trace Patterns, Systems Thinking, Testing, Tools, Trace Analysis Patterns, Training and Seminars, Troubleshooting Methodology, UI Problem Analysis Patterns, Unified Debugging Patterns, Unified Software Diagnostics, Victimware, Webinars, Workaround Patterns | No Comments »
Sunday, February 19th, 2012
Memory Dump Analysis Services (DumpAnalysis.com) organizes a free Webinar about software narratology: an application of ideas from narratology to software narrative stories.

Learn about this exciting new discipline and a field of research. When software executes it gives us its stories in the form of UI events, software traces and logs. Such stories can be analyzed for their structure and patterns for troubleshooting, debugging and problem resolution purposes.
Prerequisites: basic software troubleshooting and ability to read software generated logs.
Audience: anyone can benefit from this new perspective: from software users to software engineers and managers.
Space is limited.
Reserve your Webinar seat now at:
https://www3.gotomeeting.com/register/603136294
- Dmitry Vostokov @ DumpAnalysis.org + TraceAnalysis.org -
Posted in Announcements, Computer Science, Debugging, Escalation Engineering, Intelligence Analysis Patterns, Memory Dump Analysis Services, SPDL, Science of Software Tracing, Security, Software Behavior DNA, Software Behavior Patterns, Software Behavioral Genome, Software Engineering, Software Narrative Fiction, Software Narratology, Software Problem Description Patterns, Software Problem Solving, Software Technical Support, Software Trace Analysis, Software Trace Deconstruction, Software Trace Linguistics, Software Trace Modeling, Software Trace Reading, Software Trace Visualization, Software Tracing Implementation Patterns, Software Tracing for Dummies, Software Troubleshooting Patterns, Software Victimology, Structural Trace Patterns, Testing, Tools, Trace Analysis Patterns, Troubleshooting Methodology, UI Problem Analysis Patterns, Unified Debugging Patterns, Unit Testing, Victimware, Webinars, Windows System Administration | No Comments »
Thursday, November 3rd, 2011
The new 6th volume contains revised, edited, cross-referenced, and thematically organized selected DumpAnalysis.org blog posts about memory dump and software trace analysis, software troubleshooting and debugging written in November 2010 - October 2011 for software engineers developing and maintaining products on Windows platforms, quality assurance engineers testing software on Windows platforms, technical support and escalation engineers dealing with complex software issues, and security researchers, malware analysts and reverse engineers. The sixth volume features:
- 56 new crash dump analysis patterns including 14 new .NET memory dump analysis patterns
- 4 new pattern interaction case studies
- 11 new trace analysis patterns
- New Debugware pattern
- Introduction to UI problem analysis patterns
- Introduction to intelligence analysis patterns
- Introduction to unified debugging pattern language
- Introduction to generative debugging, metadefect template library and DNA of software behaviour
- The new school of debugging and trends
- .NET memory dump analysis checklist
- Software trace analysis checklist
- Introduction to close and deconstructive readings of a software trace
- Memory dump analysis compass
- Computical and Stack Trace Art
- The abductive reasoning of Philip Marlowe
- Orbifold memory space and cloud computing
- Memory worldview
- Interpretation of cyberspace
- Relationship of memory dumps to religion
- Fully cross-referenced with Volume 1, Volume 2, Volume 3, Volume 4, and Volume 5
Product information:
- Title: Memory Dump Analysis Anthology, Volume 6
- Author: Dmitry Vostokov
- Language: English
- Product Dimensions: 22.86 x 15.24
- Paperback: 300 pages
- Publisher: Opentask (December 2011)
- ISBN-13: 978-1-908043-19-1
- Hardcover: 300 pages
- Publisher: Opentask (January 2012)
- ISBN-13: 978-1-908043-20-7

Back cover features 3d memory space visualization image created with ParaView.
- Dmitry Vostokov @ DumpAnalysis.org + TraceAnalysis.org -
Posted in .NET Debugging, Announcements, Art, Books, Cloud Computing, Cloud Memory Dump Analysis, Common Mistakes, Complete Memory Dump Analysis, Computer Science, Computicart (Computical Art), Crash Dump Analysis, Crash Dump Patterns, Cyber Intelligence, Cyber Problems, Cyber Security, Cyber Space, Cyber Warfare, DebugWare Patterns, Debugging, Debugging Industry, Debugging Methodology, Debugging Slang, Debugging Trends, Escalation Engineering, Generative Debugging, Intelligence Analysis Patterns, Kernel Development, Memoidealism, Memoretics, Memory Visualization, Metadefect Template Library, New Debugging School, Philosophy, Physicalist Art, Publishing, Root Cause Analysis, Science of Memory Dump Analysis, Science of Software Tracing, Security, Software Behavior DNA, Software Behavior Patterns, Software Behavioral Genome, Software Engineering, Software Narratology, Software Technical Support, Software Trace Analysis, Software Trace Deconstruction, Software Trace Reading, Software Victimology, Testing, The Way of Philip Marlowe, Tools, Trace Analysis Patterns, Training and Seminars, Troubleshooting Methodology, UI Problem Analysis Patterns, Unified Debugging Patterns, Victimware, WinDbg Tips and Tricks, Windows 7, Windows Azure, Windows Data Structures, Windows Server 2008, Windows System Administration, x64 Windows | No Comments »
Wednesday, September 21st, 2011
Memoretics promotes pattern-driven memory dump and software trace analysis which has many uses but not limited to:
- Software and site reliability
- Software Debugging
- QA and Software Testing
- Computer Security
- Software Troubleshooting
- Malware Research and Analysis
- Tools as a Service (TaaS)
- Supportability
- Software Diagnostics

- Dmitry Vostokov @ DumpAnalysis.org + TraceAnalysis.org -
Posted in Cloud Memory Dump Analysis, Computer Forensics, Crash Dump Analysis, Crash Dump Patterns, DebugWare Patterns, Debugging, Debugging Trends, Escalation Engineering, Malware Analysis, Malware Patterns, Memiotics (Memory Semiotics), Memoretics, Memory Analysis Forensics and Intelligence, Metadefect Template Library, Metamalware, Pattern Models, Pattern Prediction, Reverse Engineering, Root Cause Analysis, Science of Memory Dump Analysis, Science of Software Tracing, Security, Software Behavior DNA, Software Behavior Patterns, Software Behavioral Genome, Software Defect Construction, Software Engineering, Software Generalist, Software Narratology, Software Support Patterns, Software Technical Support, Software Trace Analysis, Software Troubleshooting Patterns, Structural Memory Patterns, Structural Trace Patterns, Systems Thinking, Testing, Tools, Trace Analysis Patterns, Troubleshooting Methodology, UI Problem Analysis Patterns, Unified Debugging Patterns, Victimware, Windows System Administration, Workaround Patterns | No Comments »
Wednesday, September 21st, 2011
Memoretics as a science of memory snapshots borrows many ideas from the following disciplines (the list is not exhaustive):
- Troubleshooting and Debugging
- Intelligence Analysis
- Critical Thinking
- Forensics
- Linguistics
- Archaeology
- Psychoanalysis
- History
- Mathematics: Sets and Categories
- Literary Criticism and Narratology
It also contributes many ideas back. The following diagram depicts such an interaction:

- Dmitry Vostokov @ DumpAnalysis.org + TraceAnalysis.org -
Posted in Archaeology of Computer Memory, Categorical Debugging, Computer Forensics, Computer Science, Countefactual Debugging, Crash Dump Analysis, Crash Dump De-analysis, Crash Dump Patterns, Debugging, Debugging Methodology, Dublin School of Security, Education and Research, Escalation Engineering, General Memory Analysis, Generative Debugging, Hermeneutics of Memory Dumps and Traces, History, Intelligence Analysis Patterns, M->analysis, Malware Analysis, Malware Patterns, Mathematics of Debugging, Memiotics (Memory Semiotics), Memoretics, Memory Analysis Forensics and Intelligence, Memory Dump Analysis and History, Memory Systems Language, Memory Visualization, Metadefect Template Library, Metamalware, New Debugging School, Paleo-debugging, Pattern Models, Pattern Prediction, Psychoanalysis of Software Maintenance and Support, Psychology, Reverse Engineering, Root Cause Analysis, Science of Memory Dump Analysis, Science of Software Tracing, Security, Software Architecture, Software Behavior DNA, Software Behavior Patterns, Software Behavioral Genome, Software Chorography, Software Chorology, Software Defect Construction, Software Engineering, Software Narratology, Software Technical Support, Software Trace Analysis, Software Trace Analysis and History, Software Trace Deconstruction, Software Trace Linguistics, Software Trace Reading, Software Trace Visualization, Software Tracing Implementation Patterns, Software Troubleshooting Patterns, Software Victimology, Software and History, Structural Memory Analysis and Social Sciences, Structural Memory Patterns, Structural Trace Patterns, Systems Thinking, Testing, Tools, Trace Analysis Patterns, Troubleshooting Methodology, UI Problem Analysis Patterns, Unified Debugging Patterns, Victimware, Virtualization, Visual Dump Analysis, Workaround Patterns | No Comments »
Thursday, July 14th, 2011
As a part of unified debugging pattern and generative debugging approach we extend software behavior analysis patterns such as memory dump and software trace analysis with UI abnormal behaviour patterns. Here by abnormality we mean behavior that users should not encounter while using software. Typical example is some error message or GUI distortion during execution of a functional use case. Such patterns will extend software behavior analysis pattern language we use for description of various post-construction software problems.
The first pattern we start with is called Error Message Box and we link it to Message Box and Self-Diagnosis memory analysis patterns. You can download x86 and x64 modeling examples from this location:
UIPMessageBox.zip
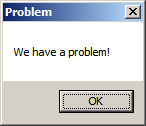
When we start the application it shows a message box:
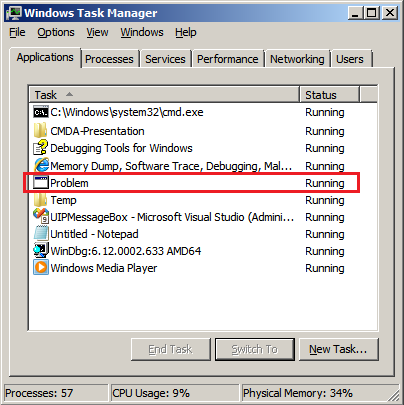
We then launch Task Manager and find the window:
Then we save a crash dump using right-click context menu:
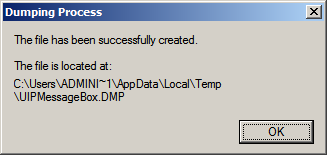
When we open the process memory dump we see this stack trace:
0:000> ~*kL
.  0  Id: d30.71c Suspend: 0 Teb: 000007ff`fffdd000 Unfrozen

Child-SP          RetAddr           Call Site

00000000`002ff1e8 00000000`77837214 user32!ZwUserWaitMessage+0xa

00000000`002ff1f0 00000000`778374a5 user32!DialogBox2+0x274

00000000`002ff280 00000000`778827f0 user32!InternalDialogBox+0x135

00000000`002ff2e0 00000000`77881ae5 user32!SoftModalMessageBox+0x9b4

00000000`002ff410 00000000`7788133b user32!MessageBoxWorker+0x31d

00000000`002ff5d0 00000000`77881232 user32!MessageBoxTimeoutW+0xb3

00000000`002ff6a0 00000001`3ffa101d user32!MessageBoxW+0×4e

00000000`002ff6e0 00000001`3ffa1039 UIPMessageBox!bar+0×1d

00000000`002ff710 00000001`3ffa1052 UIPMessageBox!foo+0×9

00000000`002ff740 00000001`3ffa11ea UIPMessageBox!wmain+0×12

00000000`002ff770 00000000`7770f56d UIPMessageBox!__tmainCRTStartup+0×15a

00000000`002ff7b0 00000000`77942cc1 kernel32!BaseThreadInitThunk+0xd

00000000`002ff7e0 00000000`00000000 ntdll!RtlUserThreadStart+0×1d
We see there that foo function called bar function which displayed the message box. In real scenarios function name could me more meaningful and give a clue for troubleshooting and debugging in addition to message text:
0:000> ub 00000001`3ffa101d

UIPMessageBox!__unguarded_readlc_active+0xfff:

00000001`3ffa0fff add     byte ptr [rax-7Dh],cl

00000001`3ffa1002 in      al,dx

00000001`3ffa1003 sub     byte ptr [rbp+33h],al

00000001`3ffa1006 leave

00000001`3ffa1007 lea     r8,[UIPMessageBox!__mnames+0×28 (00000001`3ffa83c8)]

00000001`3ffa100e lea     rdx,[UIPMessageBox!__mnames+0×38 (00000001`3ffa83d8)]

00000001`3ffa1015 xor     ecx,ecx

00000001`3ffa1017 call    qword ptr [UIPMessageBox!_imp_MessageBoxW (00000001`3ffa71d8)]
0:000> du 00000001`3ffa83c8

00000001`3ffa83c8  “Problem”
0:000> du 00000001`3ffa83d8

00000001`3ffa83d8  “We have a problem!”
- Dmitry Vostokov @ DumpAnalysis.org + TraceAnalysis.org -
Posted in Announcements, Crash Dump Analysis, Crash Dump Patterns, Debugging, Generative Debugging, Pattern Models, Software Behavior Patterns, UI Problem Analysis Patterns, Unified Debugging Patterns, x64 Windows | No Comments »