Picturing Computer Memory
An alternative to converting memory dumps to picture files is to save a memory range to a binary file and then convert it to a BMP file. Thus you can view the particular DLL or driver mapped into address space, heap or pool region, etc.
To save a memory range to a file use WinDbg .writemem command:
.writemem d2p-range.bin 00800000 0085e000
or
.writemem d2p-range.bin 00400000 L20000
I wrote a WinDbg script that saves a specified memory range and then calls a shell script which automatically converts saved binary file to a BMP file and then runs whatever picture viewer is registered for .bmp extension.
The WinDbg script code (mempicture.txt):
.writemem d2p-range.bin ${$arg1} ${$arg2}

.if (${/d:$arg3})

{

  .shell -i- mempicture.cmd d2p-range ${$arg3}

}

.else

{

  .shell -i- mempicture.cmd d2p-range

}
The shell script (mempicture.cmd):
dump2picture %1.bin %1.bmp %2

%1.bmp
Because WinDbg installation folder is assumed to be the default directory for both scripts and Dump2Picture.exe they should be copied to the same folder where windbg.exe is located. On my system it is
C:\Program Files\Debugging Tools for Windows
Both scripts are now included in Dump2Picture package available for free download:
To call the script from WinDbg use the following command:
$$>a< mempicture.txt Range [bits-per-pixel]
where Range can be in Address1 Address2 or Address Lxxx format, bits-per-pixel can be 8, 16, 24 or 32. By default it is 32.
For example, I loaded a complete Windows x64 memory dump and visualized HAL (hardware abstraction layer) module:
kd> lm

start             end                 module name

fffff800`00800000 fffff800`0085e000   hal

fffff800`01000000 fffff800`0147b000   nt

fffff97f`ff000000 fffff97f`ff45d000   win32k

...

...

...
kd> $$>a< mempicture.txt fffff800`00800000 fffff800`0085e000

Writing 5e001 bytes...
C:\Program Files\Debugging Tools for Windows>dump2picture d2p-range.bin d2p-range.bmp
Dump2Picture version 1.1

Written by Dmitry Vostokov, 2007
d2p-range.bmp

d2p-range.bin

        1 file(s) copied.
C:\Program Files\Debugging Tools for Windows>d2p-range.bmp

<.shell waiting 10 second(s) for process>

.shell: Process exited

kd>
and Windows Picture and Fax Viewer application was launched and displayed the following picture:
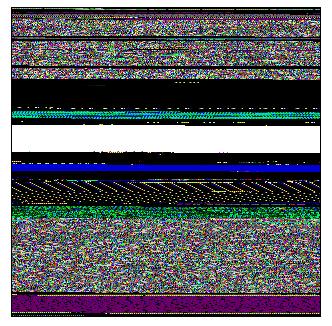
Enjoy ![]()
- Dmitry Vostokov @ DumpAnalysis.org -
August 15th, 2007 at 3:49 pm
Security warning:
http://www.dumpanalysis.org/blog/index.php/2007/08/15/memory-visualization-and-security/
February 8th, 2008 at 12:34 pm
Source code for Dump2Picture:
http://www.dumpanalysis.org/blog/index.php/2008/02/05/dump2picture-v11-source-code/
June 17th, 2008 at 4:42 pm
[…] at computer memory visual images combined with listening to the incredible nostalgic music composed by Oystein Sevag is highly […]
December 14th, 2008 at 1:18 pm
[…] Memory Dump Analysis Anthology, Volume 1 and Volume 2 have numerous articles related to computer memory visualization techniques using Dump2Picture and Microsoft debugger WinDbg. […]
December 23rd, 2008 at 6:30 pm
[…] Thread stackprints were generated from a complete memory dump using WinDbg scripts and Dump2Picture. […]
January 5th, 2009 at 1:38 am
[…] (0×7D9) - The Year of DebuggingI made a beautiful 100 x 18400 slice of pagefile.bmp generated by Dump2Picture using ImageMagick (1.5Mb JPEG […]
April 29th, 2010 at 1:38 pm
[…] WinDbg scripts […]
August 30th, 2010 at 3:02 pm
[…] with glitches on the cover similar to the fabric of memory and some pictures from inside remind me natural memory visualization images you can find in the print form in DLL List Landscape: The Art from Computer Memory […]
September 1st, 2010 at 3:04 pm
[…] colorimetric structure of those regions: 0`00470000 0`007f0000 and 0`01f10000 0`02290000 using MemPicture WinDbg script and they seem to conform with the magnified picture […]