ManagementBits update (April, 2009)
Thursday, April 30th, 2009Monthly summary of my Management Bits and Tips blog:
Strategic and Tactical Personal Learning
- Dmitry Vostokov @ DumpAnalysis.org -
Monthly summary of my Management Bits and Tips blog:
Strategic and Tactical Personal Learning
- Dmitry Vostokov @ DumpAnalysis.org -
Monthly summary of my Literate Scientist blog:
Evolution: The First Four Billion Years
- Dmitry Vostokov @ DumpAnalysis.org -
Indeterminate infinite Urstoff, out of which emerges the plurality of worlds that come and go, is the foundation of Anaximander philosophy. In memoidealism, Memory is indeterminate in the sense that it doesn’t represent determinate material substance. It is actually infinite too. The crucial feature of memoidealistic notion of memory is the fact that coming into existence plurality doesn’t perish. It is saved. In some sense Memory is apeiron of memoidealism.
- Dmitry Vostokov @ DumpAnalysis.org -
To illustrate preemptive multitasking orchestrated by a central processor I use a Russian toy that reminds me of the dining philosophers problem that usually opens any textbook on concurrency:
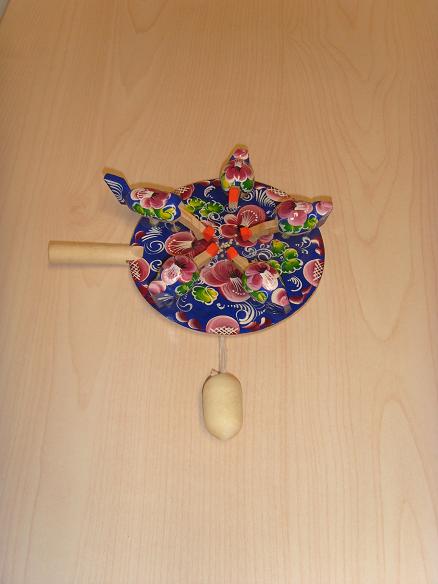
Here is the video (you need to download and install Xvid MP4 codec if your computer doesn’t play it):
Download DiningChicken.avi (1.2 Mb)
- Dmitry Vostokov @ DumpAnalysis.org -
I often say or write something like this: “I looked at the dump|trace file from different angles”.
- Dmitry Vostokov @ DumpAnalysis.org -
One application was constantly crashing in a highly dynamic multi-user environment with various value-added GUI-enhancing hooking and patching 3rd-party products. The dump was analyzed and it shows the data NULL pointer access violation:
0:000> r

eax=05503ff0 ebx=05503f10 ecx=6bb7da25 edx=00000000 esi=02203c10 edi=00000000

eip=6b542ba3 esp=04f6f860 ebp=04f6f87c iopl=0 nv up ei pl zr na pe nc

cs=001b ss=0023 ds=0023 es=0023 fs=003b gs=0000 efl=00010246

gui_plugin!entry+0xe63:

6b542ba3 8b0f            mov     ecx,dword ptr [edi]  ds:0023:00000000=????????
Unfortunately due to the lack of gui_plugin symbols the stack trace is incorrect:
0:000> kv

ChildEBP RetAddr  Args to Child

WARNING: Stack unwind information not available. Following frames may be wrong.

04f6f87c 00000000 000003b9 00000690 00000d20 gui_plugin!entry+0xe63
We do not attempt stack trace reconstruction here but show one of troubleshooting methods to eliminate possible effects of the changed environment. We look for any code patching modules by examining hooked functions:
0:000> !chkimg -lo 50 -d !kernel32 -v

Searching for module with expression: !kernel32

Will apply relocation fixups to file used for comparison

Will ignore NOP/LOCK errors

Will ignore patched instructions

Image specific ignores will be applied

Comparison image path: c:\mss\kernel32.dll\4791A76Ddb000\kernel32.dll

No range specified
Scanning section:    .text

Size: 835001

Range to scan: 76701000-767ccdb9

    7670a672-7670a676  5 bytes - kernel32!MoveFileW

 [ 8b ff 55 8b ec:e9 89 59 80 09 ]

    7671c5c8-7671c5cc  5 bytes - kernel32!DeleteFileW (+0×11f56)

 [ 8b ff 55 8b ec:e9 33 3a 80 09 ]

    76721070-76721074  5 bytes - kernel32!MoveFileExW (+0×4aa8)

 [ 8b ff 55 8b ec:e9 8b ef 83 09 ]

    7678ff3f-7678ff43  5 bytes - kernel32!ReplaceFileW (+0×6eecf)

 [ 68 b4 03 00 00:e9 bc 00 7a 09 ]

Total bytes compared: 835001(100%)

Number of errors: 20

20 errors : !kernel32 (7670a672-7678ff43)
0:000> u 7670a672

kernel32!MoveFileW:

7670a672 e989598009      jmp     7ff10000

7670a677 6a02            push    2

7670a679 6a00            push    0

7670a67b 6a00            push    0

7670a67d ff750c          push    dword ptr [ebp+0Ch]

7670a680 ff7508          push    dword ptr [ebp+8]

7670a683 e8c4690100      call    kernel32!MoveFileWithProgressW (7672104c)

7670a688 5d              pop     ebp
0:000> u 7ff10000

7ff10000 e99b1e94f5      jmp     3rdPartyHook!MoveFileW (75851ea0)

7ff10005 8bff            mov     edi,edi

7ff10007 55              push    ebp

7ff10008 8bec            mov     ebp,esp

7ff1000a e968a67ff6      jmp     kernel32!MoveFileW+0×5 (7670a677)

7ff1000f 0000            add     byte ptr [eax],al

7ff10011 0000            add     byte ptr [eax],al

7ff10013 0000            add     byte ptr [eax],al
We see lots of references to 3rdPartyHook on the thread raw stack:
0:000> !teb

TEB at 7ffd5000

    ExceptionList:        04f6ff70

    StackBase:            04f70000

    StackLimit:           04f6c000

    SubSystemTib:         00000000

    FiberData:            00001e00

    ArbitraryUserPointer: 00000000

    Self:                 7ffd5000

    EnvironmentPointer:   00000000

    ClientId:             00001790 . 000017d0

    RpcHandle:            00000000

    Tls Storage:          7ffd502c

    PEB Address:          7ffd8000

    LastErrorValue:       0

    LastStatusValue:      0

    Count Owned Locks:    0

    HardErrorMode:        0
0:000> dds 04f6c000 04f70000

[...]

04f6cf28  00440042

04f6cf2c  04f6d2d4

04f6cf30  77179834 ntdll!_except_handler4

04f6cf34  003ce48e

04f6cf38  fffffffe

04f6cf3c  7719d584 ntdll!LdrpResSearchResourceInsideDirectory+0x80f

04f6cf40  7719cf9d ntdll!LdrpResSearchResourceMappedFile+0x521

04f6cf44  6b920002

04f6cf48  00000000

04f6cf4c  000bf000

04f6cf50  6b9d9000

04f6cf54  6b9200f8

04f6cf58  00000000

04f6cf5c  01f6d1d4 <Unloaded_D3D9.DLL>+0x12d1d4

04f6cf60  00000003

04f6cf64  04f6cf88

04f6cf68  04f6d370

04f6cf6c  04f6d340

04f6cf70  771d8fb2 ntdll!_SEH_epilog4_GS+0xa

04f6cf74  7719d018 ntdll!LdrpResSearchResourceMappedFile+0x781

04f6cf78  73d77612

04f6cf7c  6b920002

04f6cf80  000bf000

04f6cf84  00000000

04f6cf88  00000001

04f6cf8c  00000000

04f6cf90  00000000

04f6cf94  00000000

04f6cf98  00000000

04f6cf9c  04f6d44c

04f6cfa0  75851c2f 3rdPartyHook+0×1c2f

04f6cfa4  04f6d1e8

04f6cfa8  00000000

04f6cfac  00000000

04f6cfb0  00000000

04f6cfb4  00000000

[…]
The symbolic references point to valid and sound code:
0:000> ub 75851c2f

3rdPartyHook!GetData+0x22d:

75851c1d c20c00          ret     0Ch

75851c20 8b4dfc          mov     ecx,dword ptr [ebp-4]

75851c23 5f              pop     edi

75851c24 5e              pop     esi

75851c25 33cd            xor     ecx,ebp

75851c27 33c0            xor     eax,eax

75851c29 5b              pop     ebx

75851c2a e8590f0000      call    3rdPartyHook!__security_check_cookie (75852b88)
0:000> u 75851c2f

3rdPartyHook!GetData+0x23f:

75851c2f 8be5            mov     esp,ebp

75851c31 5d              pop     ebp

75851c32 c20c00          ret     0Ch

75851c35 cc              int     3

75851c36 cc              int     3

75851c37 cc              int     3

75851c38 cc              int     3

75851c39 cc              int     3
We also see the other 4th-party module that we know as patching from our past experience:
[...]

04f6f850  00000000

04f6f854  00000000

04f6f858  00000000

04f6f85c  00000000

04f6f860  1000c200 4thPartyHook!Shared+0×80

04f6f864  00000000

04f6f868  04f6f87c

04f6f86c  00000001

04f6f870  00000000

04f6f874  00000000

04f6f878  00000000

04f6f87c  0000006c

[…]
The address 1000c200 looks suspicious and coincidental as the set of flags. However, when we disassemble the address, we see the valid and sound code and the module seems to be loaded at 0×10000000 address:
0:000> ub 1000c200

4thPartyHook!Shared+0x80:

1000c1e8 e8234effff      call    10001010

1000c1ed a160020710      mov     eax,dword ptr [10070260]

1000c1f2 83c418          add     esp,18h

1000c1f5 8b750c          mov     esi,dword ptr [ebp+0Ch]

1000c1f8 85f6            test    esi,esi

1000c1fa 7530            jne     1000c22c

1000c1fc 85c0            test    eax,eax

1000c1fe 742c            je      1000c22c
0:000> u 1000c200

4thPartyHook!Shared+0x80:

1000c200 8b08            mov     ecx,dword ptr [eax]

1000c202 8b5004          mov     edx,dword ptr [eax+4]

1000c205 53              push    ebx

1000c206 8bd9            mov     ebx,ecx

1000c208 0bda            or      ebx,edx

1000c20a 5b              pop     ebx

1000c20b 741f            je      1000c22c

1000c20d f6400801        test    byte ptr [eax+8],1
0:000> !dh 10000000

[...]

File Type: DLL

FILE HEADER VALUES

     14C machine (i386)

       5 number of sections

       0 file pointer to symbol table

       0 number of symbols

      E0 size of optional header

    2102 characteristics

            Executable

            32 bit word machine

            DLL

[...]

OPTIONAL HEADER VALUES

     10B magic #

    8.00 linker version

   62000 size of code

   15000 size of initialized data

       0 size of uninitialized data

   3E1B6 address of entry point

    1000 base of code

         ----- new -----

10000000 image base

    1000 section alignment

    1000 file alignment

       2 subsystem (Windows GUI)

    4.00 operating system version

    0.00 image version

    4.00 subsystem version

   7A000 size of image

    1000 size of headers

[...]
0:000> lm

start    end        module name

00400000 00425000   App

[...]

10000000 1007a000   4thPartyHook

[...]
The recommendation I usually give in such cases it to remove or disable 3rd- and 4th-party products that do code patching to see if this resolves the problem. This makes the module list internally clean and if the problem persists then we should look for another causes and restore 3rd- and 4th-party products.
- Dmitry Vostokov @ DumpAnalysis.org -
On the great divide in modern software factories:
“We have in fact, two kinds of” engineers, “side by side: one that” design, “but do not” code, “and another that” code, “but seldom” design.
Bertrand Russell, Sceptical Essays
- Dmitry Vostokov @ DumpAnalysis.org -
After coming back to engineering I decided to expand the domain of my research and start the new series of posts called Trace Analysis Patterns. In addition to Citrix CDF / Microsoft ETW traces I plan to cover other variants based on my extensive software engineering background in the past where I used tracing in software products ranging from soft multi-platform real-time systems to static code analysis tools. Connection with memory dump analysis will be covered too because sometimes the combination of static and dynamic data leads to interesting observations and helps to troubleshoot and resolve customer problems especially when not all data can be collected dynamically.
In fact, stack traces and their collections are specializations of the more general traces. Another example is historical information in memory dump files especially when it is somehow timestamped.
In this part I start with the obvious and to some extent the trivial pattern called Periodic Error. This is an error or a status value that is observed periodically many times:
No     PID  TID   Date      Time         Statement

[...]

664957 1788 22504 4/23/2009 17:59:14.600 MyClass::Initialize: Cannot open connection “Client ID: 310″, status=5

[…]

668834 1788 19868 4/23/2009 19:11:52.979 MyClass::Initialize: Cannot open connection “Client ID: 612″, status=5

[…]
or
No     PID  TID   Date      Time         Statement

[...]

202314 1788 19128 4/21/2009 16:03:46.861 HandleDataLevel: Error 12005 Getting Mask

[…]

347653 1788 17812 4/22/2009 13:26:00.735 HandleDataLevel: Error 12005 Getting Mask

[…]
Here single trace entries can be isolated from the trace and studied in detail.
Be aware though that some modules might report periodic errors that are false positive, in the sense, that they are expected as a part of implementation details, for example, when a function returns an error to indicate that bigger buffer is required or to estimate its size for a subsequent call. It merits its own pattern name and I come to it next time with more examples.
I also created a page where I’ll will be adding all tracing patterns:
- Dmitry Vostokov @ TraceAnalysis.org -
Memoidealism is characterized by the unity of philosophy and (computer) science. It has deep roots in practical memory (dump) analysis. The interpretation of observations as memory snapshots (universal memory dumps) leads to the declaration of Memory to be the One (or the First Principle) like Water in Thales practical scientific philosophy. We also observe that processes are memory snapshots as well, through their observational data. We try to understand the plurality of experiences through the unity of memory (the so called Unity in Difference).
- Dmitry Vostokov @ DumpAnalysis.org -
I’m RARE rule #5 says:
“Provide appropriate explanations and narrative in the cases where analysis is inconclusive”.
Here is the typical example of such case when a kernel dump was taken with the vague description about server problems. The dump file analysis revealed the following abnormal conditions warranting further troubleshooting steps:
The AppA.exe, the part of the customer product, is about 1Gb in size when its typical size should be no more than 200Mb. Perhaps we have a memory leak here. We can suggest to take a few consecutive memory dumps of the growing memory and analyze it later as described in a heap leak pattern. This can also be a .NET leak too if unmanaged AppA.exe happened to load any managed components through 3rd-party DLLs. It could be also some unknown loaded component reserved and committed large portion of virtual memory space.
0: kd> !vm

[...]

0eec AppA.exe        241366 (    965464 Kb)

03c0 svchost.exe      10304 (     41216 Kb)

0230 lsass.exe         8764 (     35056 Kb)

0298 svchost.exe       6402 (     25608 Kb)

01f4 winlogon.exe      5787 (     23148 Kb)

[…]
We can confirm the absence of handle leaks:
0: kd> !process 0eec

Searching for Process with Cid == eec

Cid Handle table at fffffa80014d6000 with 794 Entries in use

PROCESS fffffade6e601860

    SessionId: 0  Cid: 0eec    Peb: 7efdf000  ParentCid: 0eb8

    DirBase: b10fa000  ObjectTable: fffffa8000c39170  HandleCount: 865.

    Image: AppA.exe

    VadRoot fffffade68d7e580 Vads 1961 Clone 0 Private 237843. Modified 77. Locked 1.

    DeviceMap fffffa8001221580

    Token                             fffffa8001fdebe0

    ElapsedTime                       6 Days 22:18:09.271

    UserTime                          00:23:00.406

    KernelTime                        00:27:31.281

    QuotaPoolUsage[PagedPool]         106968

    QuotaPoolUsage[NonPagedPool]      19055186

    Working Set Sizes (now,min,max)  (240529, 50, 345) (962116KB, 200KB, 1380KB)

    PeakWorkingSetSize                240671

    VirtualSize                       1244 Mb

    PeakVirtualSize                   1246 Mb

    PageFaultCount                    244053

    MemoryPriority                    BACKGROUND

    BasePriority                      8

    CommitCharge                      241366
Kernel and user times seem high (about 30 minutes) but it correlates with almost 7 day extensive application usage that involves constant database access.
Looking further at running processes we see that the crucial AppB and AppC applications that were supposed to be running to serve user requests are orphaned:
09e8 AppB.exe            0 (         0 Kb)

09c0 AppC.exe            0 (         0 Kb)
Were they closed normally, forcefully terminated after being hang or crashed? These questions should be asked and appropriate measures taken to capture crash dumps in case event logs reveal access violations.
- Dmitry Vostokov @ DumpAnalysis.org -
On the deliberate practice to become a Debugging Expert:
“Of all days, the day on which one has not” debugged “is the one most surely wasted.”
Nicolas Chamfort, Maximes et Pensées
- Dmitry Vostokov @ DumpAnalysis.org -
“A” fix “can break a” bug “in two.”
- Dmitry Vostokov @ DumpAnalysis.org -
“It is easier to know” programming “in general than to understand one” program “in particular.”
François de La Rochefoucauld, Maxims
- Dmitry Vostokov @ DumpAnalysis.org -
I finally read this book from cover to cover and I must say it is the very sound book and presents a consistent approach to debugging real-life problems with user-land C and C++ code on Linux environments.
The Developer’s Guide to Debugging

Although it uses mainly GDB for illustrations and provides Visual C++ equivalents when possible it doesn’t cover Debugging Tools for Windows and its main GUI debugger, WinDbg. To rectify this I created extensive notes while reading.
Additional reader audience for this book might include a Windows engineer who needs to debug software on Linux or FreeBSD so a quick GDB crash course is needed. It would also serve as an excellent debugging course or as a supplemental course to any C or C++ course. Highly recommended if you are a Linux C/C++ software engineer. Even if you are an experienced one, you will find something new or make your debugging more consistent. If you need to teach or mentor juniors, this book helps too.
- Dmitry Vostokov @ DumpAnalysis.org -
Noticed UnusualBoost in !process WinDbg command output from the complete memory dump taken from Windows 7 Beta which I’m evaluating for the purposes of memory dump analysis:
THREAD 852b5d48  Cid 071c.0950  Teb: 7ff9c000 Win32Thread: fe1fc008 WAIT: (WrUserRequest) UserMode Non-Alertable

    853e0690  SynchronizationEvent

Not impersonating

DeviceMap                 8f909fc8

Owning Process            8538a030       Image:         explorer.exe

Attached Process          N/A            Image:         N/A

Wait Start TickCount      47057          Ticks: 9460 (0:00:02:27.812)

Context Switch Count      61

UserTime                  00:00:00.000

KernelTime                00:00:00.046

Win32 Start Address WINMM!mciwindow (0x73942761)

Stack Init 904b9fd0 Current 904b9a60 Base 904ba000 Limit 904b7000 Call 0

Priority 13 BasePriority 10 UnusualBoost 0 ForegroundBoost 2 IoPriority 2 PagePriority 5

Kernel stack not resident.

ChildEBP RetAddr

904b9a78 8268951d nt!KiSwapContext+0×26

904b9abc 826cf460 nt!KiSwapThread+0×57b

904b9b10 8268ccaf nt!KiCommitThreadWait+0×340

904b9be8 8e50c768 nt!KeWaitForSingleObject+0×3ee

904b9c44 8e50c575 win32k!xxxRealSleepThread+0×1d7

904b9c60 8e508379 win32k!xxxSleepThread+0×2d

904b9cb8 8e50cf9a win32k!xxxRealInternalGetMessage+0×4b2

904b9d1c 8269066a win32k!NtUserGetMessage+0×3f

904b9d1c 771e5704 nt!KiFastCallEntry+0×12a

053af7e8 76fdbb29 ntdll!KiFastSystemCallRet

053af7ec 76fd3f49 USER32!NtUserGetMessage+0xc

053af810 739427e0 USER32!GetMessageA+0×8d

053af848 76f536d6 WINMM!mciwindow+0×102

053af854 771c883c kernel32!BaseThreadInitThunk+0xe

053af894 771c880f ntdll!__RtlUserThreadStart+0×70

053af8ac 00000000 ntdll!_RtlUserThreadStart+0×1b
There is also ForegroundBoost but its meaning is obvious to me.
- Dmitry Vostokov @ DumpAnalysis.org -
I looked at thread raw stack in a process dump from Windows Server 2008 and found ntdll!FinalExceptionHandler symbol:
Loading Dump File [App.dmp]

User Mini Dump File with Full Memory: Only application data is available

Windows Server 2008/Windows Vista Version 6001 (Service Pack 1) MP (4 procs) Free x86 compatible
0:000> !teb
TEB at 7ffde000
ExceptionList: 0022fdd8
StackBase: 00230000
StackLimit: 00225000
SubSystemTib: 00000000
FiberData: 00001e00
ArbitraryUserPointer: 00000000
Self: 7ffde000
EnvironmentPointer: 00000000
ClientId: 00002458 . 00002478
RpcHandle: 00000000
Tls Storage: 7ffde02c
PEB Address: 7ffdf000
LastErrorValue: 0
LastStatusValue: c0000035
Count Owned Locks: 0
HardErrorMode: 0
0:000> dds 00225000 00230000

[...]

0022ff7c  00000000

0022ff80  00000000

0022ff84  00000000

0022ff88  0022ff94

0022ff8c  76744911 kernel32!BaseThreadInitThunk+0xe

0022ff90  7ffdf000

0022ff94  0022ffd4

0022ff98  77b5e4b6 ntdll!__RtlUserThreadStart+0x23

0022ff9c  7ffdf000

0022ffa0  2497b80a

0022ffa4  00000000

0022ffa8  00000000

0022ffac  7ffdf000

0022ffb0  00000000

0022ffb4  00000000

0022ffb8  00000000

0022ffbc  0022ffa0

0022ffc0  00000000

0022ffc4  0022ffe4

0022ffc8  77b29834 ntdll!_except_handler4

0022ffcc  530d7826

0022ffd0  00000000

0022ffd4  0022ffec

0022ffd8  77b5e489 ntdll!_RtlUserThreadStart+0x1b

0022ffdc  00401110 App+0x1110

0022ffe0  7ffdf000

0022ffe4  ffffffff

0022ffe8  77bc75de ntdll!FinalExceptionHandler

0022ffec  00000000

0022fff0  00000000

0022fff4  00401110 App+0×1110

0022fff8  7ffdf000

0022fffc  00000000

00230000  78746341
Search on Internet led me to this very interesting review article about Windows memory protection mechanisms:
http://taossa.com/archive/bh08sotirovdowd.pdf
It also explains this new “Final” exception mechanism in W2K8.
I couldn’t find this in raw stack traces on Windows 7 so it might be the case that it is not enabled by default there like in Windows Vista.
- Dmitry Vostokov @ DumpAnalysis.org -
One application was hanging after printing and its user dump was taken. Inspection of threads reveals only one blocked thread:
0:000> ~*kL
.  0  Id: 486c.5704 Suspend: 1 Teb: 7ffa9000 Unfrozen

ChildEBP RetAddr

01c0fb68 7c827cfb ntdll!KiFastSystemCallRet

01c0fb6c 77e6202c ntdll!NtWaitForMultipleObjects+0xc

01c0fc14 77e62fbe kernel32!WaitForMultipleObjectsEx+0x11a

01c0fc30 00439f16 kernel32!WaitForMultipleObjects+0×18

01c0fd94 77bcaed6 App!~MyPrinter+0xe

01c0fdc0 77bcaf82 msvcrt!_cinit+0xad

01c0fdd0 77baf582 msvcrt!_cexit+0xb

01c0fde0 7c81a352 msvcrt!__CRTDLL_INIT+0×15c

01c0fe00 7c830e70 ntdll!LdrpCallInitRoutine+0×14

01c0feb8 77e668a3 ntdll!LdrShutdownProcess+0×182
We see that the process was being terminated and the last thread was blocked in a destructor of MyPrinter class. However we see some historical information, faultrep.dll unloaded, and this means that some exception happened prior to the process shutdown:
0:000> lm

[...]

Unloaded modules:

69500000 69517000   faultrep.dll

[…]
Then we look at the thread raw stack to see any signs of execution residue and hidden exceptions in particular:
0:000> !teb

TEB at 7ffa9000

    ExceptionList:        01c0fc04

    StackBase:            01c10000

    StackLimit:           01c08000

    SubSystemTib:         00000000

    FiberData:            00001e00

    ArbitraryUserPointer: 00000000

    Self:                 7ffa9000

    EnvironmentPointer:   00000000

    ClientId:             0000486c . 00005704

    RpcHandle:            00000000

    Tls Storage:          00000000

    PEB Address:          7ffd9000

    LastErrorValue:       0

    LastStatusValue:      c0000010

    Count Owned Locks:    0

    HardErrorMode:        0
0:000> dds 01c08000 01c10000

01c08000  00000000

01c08004  00000000

01c08008  00000000

[...]

01c0e704  00001000

01c0e708  01c0ea14

01c0e70c  7c82855e ntdll!KiUserExceptionDispatcher+0xe

01c0e710  01c0a000

01c0e714  01c0e73c

01c0e718  01c0e720

01c0e71c  01c0e73c

01c0e720  c0000005

01c0e724  00000000

01c0e728  00000000

01c0e72c  7c82a756 ntdll!RtlpCoalesceFreeBlocks+0×370

01c0e730  00000002

01c0e734  00000000

[…]
Applying exception context we see heap corruption:
0:000> .cxr 01c0e73c

eax=01998db0 ebx=00370000 ecx=01998db0 edx=4d445443 esi=01998da8 edi=01998010

eip=7c82a756 esp=01c0ea08 ebp=01c0ea14 iopl=0 nv up ei pl zr na pe nc

cs=001b ss=0023 ds=0023 es=0023 fs=003b gs=0000    efl=00010246

ntdll!RtlpCoalesceFreeBlocks+0×370:

7c82a756 3b4a04  cmp    ecx,dword ptr [edx+4] ds:0023:4d445447=????????
However stack trace a bit incorrect at the end (shown in magenta) but this can be explained that it is a residual stack trace that happened in the past with some data overwritten by exception processing:
0:000> kL

  *** Stack trace for last set context - .thread/.cxr resets it

ChildEBP RetAddr

01c0ea14 7c82a82b ntdll!RtlpCoalesceFreeBlocks+0x370

01c0eafc 77bbcef6 ntdll!RtlFreeHeap+0x38e

01c0eb44 00421fdc msvcrt!free+0xc3

01c0eb6c 00422395 App!SetData+0x3a5

[...]

01c0f81c 7c829f60 App!CreatePrinter+0x6a

01c0f824 7c829f59 ntdll!CheckHeapFillPattern+0×64

01c0f948 7c82770b ntdll!RtlFreeHeap+0×70f

01c0f96c 77c27631 ntdll!NtQueryValueKey+0xc

01c0fab8 00000000 gdi32!ReadDisableMetaFilesRegKey+0xfc
Because the hang happens after printing we detect old printer drivers in the module list (certainly not my version of the environment used for application testing):
0:000> lmt

start    end        module name

[...]

6b900000 6b925000   PrinterDriverA  [...] 2002

6c900000 6c947000   PrinterDriverB  […] 2002

[…]
- Dmitry Vostokov @ DumpAnalysis.org -
If we assume the model-based definition of software defects we can easily see that any changes to an underlying model can surface the new unanticipated defects and hide the known ones. New and evolving disciplines like software security engineering can change our views about solid code and create defects by introducing non-functional constraints on models. Another aspect of this is the interaction of a human debugger with code, the very act of reading code can create defects. However the latter effect is controversial and belongs to the evolving quantum theory of software defects (see my previous post about bugtanglement).
- Dmitry Vostokov @ DumpAnalysis.org -
Before we explain stages of the analysis process shown in Part 1, let’s start with a brief overview of memory dumps, debuggers and logs. Recall that a memory dump is a snapshot of a process, system or physical memory state. This unifies post-mortem analysis and live debugging. Debuggers are tools that allow us to get and modify these memory snapshots. Other tools that allow us to get memory dump files are process dumpers like userdump.exe, Task Manager since Vista, WER, and system dumpers like LiveKd and Win32dd. We should not forget tools and methods that allow us to trigger Windows kernel ability to save consistent memory dump files: NMI button, keyboard method and various software bugcheck-triggers like Citrix SystemDump. Now coming back to debuggers. One of their essential features is to save a debugging session log, formatted textual output saved in a text file for further processing. One good example is !process 0 ff WinDbg command to output all processes and their thread stack traces (see Stack Trace Collection pattern for other variations).
I’ve created a page to add all P-DMA parts as soon as I write them:
Pattern-Driven Memory Analysis
- Dmitry Vostokov @ DumpAnalysis.org -
I used to be a fun of Yanni music in the late 1990s. Today I started listening again to some of his albums and recommend them for any debugging session. If you are new to this music there is a compilation album that I’m listening to while I’m writing this post:

Here is my version of track titles inspired by listening (with my comments in italics):
1. In the Memory Dump File
2. The Morning Session
3. Love for Debugging
4. A Debugger’s Dream
5. Within Kernel
6. Forbidden Access
7. Once Upon a Second Chance
8. Chasing Bugs
9. The Main Thread [Special Debugging Version]
10. Quiet Memory Analyst
11. Debugging Joy (My Life is Debugging)
12. So Long My Debugger (My Only Friend on Virtual Memory Plains)
13. Before I Leave the Debugger
14. End of Session (It wasn’t bad after all)
15. Face in the Memory Dump (after applying Natural Memory Visualization techniques: you can see pictures and various artifacts stored in memory buffers)
- Dmitry Vostokov @ DumpAnalysis.org -