Moving to kernel space (annotated references)
Thursday, September 28th, 2006The post was updated and can be found here:
http://www.dumpanalysis.org/blog/index.php/2007/08/26/moving-to-kernel-space-updated-references/
- Dmitry Vostokov -
The post was updated and can be found here:
http://www.dumpanalysis.org/blog/index.php/2007/08/26/moving-to-kernel-space-updated-references/
- Dmitry Vostokov -
HTML version of selected lecture materials from my forthcoming book is available on my personal web site:
http://www.dumpanalysis.org/blog/index.php/foundations-of-debugging-x86/
Topics available online include:
In addition to x86 (32-bit) the book covers assembler, C/C++ and crash dump analysis on the following platforms:
It will include an educational version of x86/x64/ARM4 assembler and interpreter written using modern C++ and STL (including UML diagrams of all classes and components) and much more! Although all this bonus stuff is still under development it is actually working, compiling, loading and executing/interpreting small assembly language programs.
I’m also planning to publish an Internet version of this assembly language interpreter to run small educational assembly language programs anytime, anywhere. The latter Citrix-like goal is actually the part of my Masters degree project.
- Dmitry Vostokov -
During development of one of my projects for Windows Mobile I needed full information about windows on my pocket PC devices. I needed that information gathered in real-time and when I was not connected to my host PC so I couldn’t use remote SPY++ from MS Windows CE tools. The decision was to port existing Citrix WindowHistory tool to Windows CE. It worked well and I tested it on Windows Pocket PC 2003 emulator and on real devices running Windows Mobile 5.0 (Acer n300 and mobile phone Mio A701 both have ARM processors). It should work on any other mobile device powered by ARM/XScale processor.
- Dmitry Vostokov -
Don’t expect me to talk about Netscaler stuff. I’m a Windows guy. It’s started in 1989 when I got PS/2 with 2Mb of memory on board and Windows 2.x as a GUI appliance to an IBM thermal printer. And then suddenly Windows 3.0 appeared and I didn’t have a clue about programming on it (I was an MS DOS guy). Thanks to BBS (some of you probably have never heard about it - it was mini Internet at that time) I got a text file - that wonderful book “Programming Windows” 1st edition written by Charles Petzold and read it twice and being facinated by Windows GUI independence from hardware went straight programming Norton Commander variant. Enough nostalgia. Let’s come back to Citrix and hardware.
I’m a big fan of OSR. Read their articles and bought some hardware from them to learn about USB driver programming, like this one:

This is a real USB device! You connect it via cable to your USB port and you have a button, switches and indicators. Inspired by this device I’m writing a driver which will monitor the health of a Citrix server by lighting appropiate indicators when your IMA service is gone, showing the number of sessions active, etc. And there is a button which could force a server to show a blue screen (in another words force a system dump to do an analysis later - that’s my job in Citrix) if things go beyond control of a Citrix administrator. Something like a magic to me. Stay tuned.
- Dmitry Vostokov -
Finally Citrix has got its own troubleshooting tool for capturing window messages. It is similar to what SPY++ does but more easy to use especially in a customer environment. Existing tools are useful for developers focusing on specific product where they know its internals or in the process of debugging. Customers and technical support need something different. From my experience, existing tools require too much effort for a customer who sees and tries to use them for the first time. On the other hand technical support needs good traces where nothing has been left out. So I sat down at my 64-bit workstation and spent weekend to develop this lightweight tool to let customers do minimum and record everything and thus avoid usual turnaround in technical support cases requiring capturing messages and at the same time simplify trace analysis (at least for myself).
While developing this tool I discovered its major feature: ability to capture all messages from 64-bit applications (in addition to messages from 32-bit applications). All existing tools I could find capture messages from 32-bit application only.
You can download MessageHistory for free from Citrix support web site (requires free registration):
Check out also Citrix WindowHistory for 32-bit and WindowHistory for 64-bit platforms.
Currently I’m developing a presentation/class: “Understanding windows and messages: peering inside Citrix troubleshooting tools and their log files (WindowHistory and MessageHistory)”
Further plans are to develop more tools to track the history of various system events (in addition to windows and messages) and finally develop a toolbar to integrate all of them.
- Dmitry Vostokov -
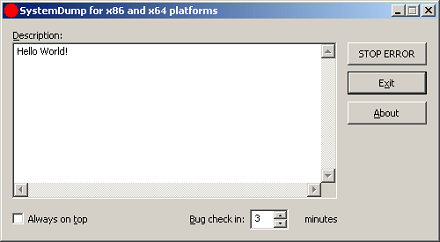
Not really new as it was previously called CtxBSOD v2.1 but was renamed to better show its purpose. In addition to renaming I added a command line option to dump a system remotely or from a command line locally without using its GUI interface. The main motivation for me to write this tool was the absence of similar tools for 64-bit Windows. SystemDump can dump a 64-bit server too!
You can download it form Citrix support web site (requires free registration):
http://support.citrix.com/article/CTX111072
Main features:
The latter feature is implemented entirely in kernel. Additional command that not covered in the article is
>SystemDump.exe abort
allows you to abort the action if you ran the tool using command line options.
I attached the UML component diagram showing the architecture of this tool. I recently developed a presentation about device drivers architecture and Citrix kernel drivers where I used this tool as one of examples.

- Dmitry Vostokov -
Still playing with WinDbg scripting and applying them to dump analysis. The following script will uncover deadlocks and critical section contention in user mode processes (including services) if you run it against complete memory dump:
$$

$$ List owned critical sections in user processes

$$

r $t0 = nt!PsActiveProcessHead

.for (r $t1 = poi(@$t0); (@$t1 != 0) & (@$t1 != @$t0); r $t1 = poi(@$t1))

{

    r? $t2 = #CONTAINING_RECORD(@$t1, nt!_EPROCESS, ActiveProcessLinks);

    .process @$t2

    .reload

    !ntsdexts.locks

}
To run it save in a file and use the following command in WinDbg: $$><script.txt
- Dmitry Vostokov -
I have two devices with Windows Mobile 5.0:
Acer n300
http://global.acer.com/products/pda/n300.htm
and mobile phone Mio A701
http://www.mio-tech.be/en/gps-navigation-products-a701-overview.htm
I bought them for debugging and testing my forthcoming product OpenTask Mobile 5.0 but found yet another use for Dump Analysis.
I frequently consult WinDbg help for ideas. I printed it to an HTML file and split it into 9 parts less then 1Mb each so Pocket IE on my devices can load them. And now I can read the help file while commuting to work, shopping around, walking or simply when my notebook is not accessible.
- Dmitry Vostokov -
The most common scenarios technical support people encounter when facing the need to create a dump are:
http://support.citrix.com/article/CTX104633
the article is applicable to any process, not only to Citrix IMA service
http://support.citrix.com/article/CTX106110
http://support.citrix.com/article/CTX105888
http://support.citrix.com/article/CTX106970
the article is applicable to any process, not only to Citrix IMA service
http://support.citrix.com/article/CTX111072
http://support.citrix.com/article/CTX108825 (Explorer extension)
http://support.citrix.com/article/CTX108890 (Command line version)
- Dmitry Vostokov -
I couldn’t find any forum on Internet dedicated solely for dump analysis topics so I created it some time ago. It is sponsored by me and free for everyone.
Recently I did some file tossing and it is now accessible directrly from www.dumpanalysis.org
- Dmitry Vostokov -
It takes approximately 10 - 30 minutes to process an average 2Gb complete memory dump. After loading couple of dumps I found the following useful features so far:
I’m currently using this tool with every memory dump I get and will post interesting cases.
- Dmitry Vostokov -
I got a dump with 30 IE processes running and I want to find the only one waiting for a specific function. I know there is one. The following script lists all processes and their stacks (of course, I already opened a log in WinDbg to save that huge amount of output):
$$

$$ List user processes and stacks

$$

r $t0 = nt!PsActiveProcessHead

.for (r $t1 = poi(@$t0); (@$t1 != 0) & (@$t1 != @$t0); r $t1 = poi(@$t1))

{

    r? $t2 = #CONTAINING_RECORD(@$t1, nt!_EPROCESS, ActiveProcessLinks);

    .process @$t2

    .reload

    !process @$t2

}
- Dmitry Vostokov -
Microsoft has released this tool to help analyze memory dumps. I’m currently evaluating it and post my opinion later. Seems to be pretty cool tool according to its description and PPT presentation which you can download here:
You need to manually copy x86 folder from kktools to your Debugging Tools for Windows folder and run kanalyze.exe from there. Refer to PPT presentation for details.
- Dmitry Vostokov -