Archive for the ‘CDA Pattern Classification’ Category
Saturday, June 18th, 2011
A page to reference all different kinds of stack traces is necessary, so I created this post:
I’ll update it as soon as I add more similar patterns.
- Dmitry Vostokov @ DumpAnalysis.org + TraceAnalysis.org -
Posted in CDA Pattern Classification, Crash Dump Analysis, Crash Dump Patterns, Stack Trace Collection, Training and Seminars | No Comments »
Friday, April 22nd, 2011
A page to reference all different kinds of .NET related patterns is necessary, so I created this post:
I’ll update it as soon as I add more similar patterns.
- Dmitry Vostokov @ DumpAnalysis.org + TraceAnalysis.org -
Posted in .NET Debugging, CDA Pattern Classification, Crash Dump Analysis, Crash Dump Patterns, Debugging, Training and Seminars | No Comments »
Monday, March 7th, 2011

The first Webinar to start an in-depth discussion of pattern-driven software troubleshooting, debugging and maintenance:
Date: 25th of March 2011
Time: 18:30 (GMT) 14:30 (EST) 11:30 (PST)
Duration: 60 minutes
Space is limited.
Reserve your Webinar seat now at:
https://www3.gotomeeting.com/register/448268158
Topics include:
- A Short History of DumpAnalysis.org
- Memory Dump Analysis Patterns
- Troubleshooting and Debugging Tools (Debugware) Patterns
- Software Trace Analysis Patterns
- From Software Defects to Software Behavior
- Workaround Patterns
- Structural Memory Patterns
- Memory Analysis Domain Pattern Hierarchy
- New Directions
Prerequisites: experience in software troubleshooting and/or debugging.
- Dmitry Vostokov @ DumpAnalysis.org + TraceAnalysis.org -
Posted in .NET Debugging, Analysis Notation, Announcements, AntiPatterns, Best Practices, CDA Pattern Classification, Crash Dump Analysis, Crash Dump Patterns, DebugWare Patterns, Debugging, Debugging Methodology, Debugging Trends, Escalation Engineering, Java Debugging, Linux Crash Corner, Mac Crash Corner, Malware Analysis, Malware Patterns, Memory Analysis Forensics and Intelligence, Memory Dump Analysis Services, Pattern Models, Pattern Prediction, Presentations, Software Behavior Patterns, Software Chorology, Software Engineering, Software Narratology, Software Technical Support, Software Trace Analysis, Software Trace Reading, Software Tracing Implementation Patterns, Software Troubleshooting Patterns, Structural Memory Patterns, Structural Trace Patterns, Systems Thinking, Testing, Trace Analysis Patterns, Training and Seminars, Troubleshooting Methodology, Unified Debugging Patterns, Webinars, Workaround Patterns | No Comments »
Wednesday, March 2nd, 2011
A page to reference all different kinds of stack overflow is necessary, so I created this post:
I’ll update it as soon as I add more similar patterns.
- Dmitry Vostokov @ DumpAnalysis.org + TraceAnalysis.org -
Posted in CDA Pattern Classification, Crash Dump Analysis, Crash Dump Patterns, Debugging, Training and Seminars | No Comments »
Tuesday, September 21st, 2010
A page to reference all different kinds of contention is necessary, so I created this post:
I’ll update it as soon as I add more similar patterns.
- Dmitry Vostokov @ DumpAnalysis.org + TraceAnalysis.org -
Posted in CDA Pattern Classification, Crash Dump Analysis, Crash Dump Patterns, Debugging, Training and Seminars | 1 Comment »
Thursday, April 22nd, 2010
I’ve decided to adapt archaeological classificatory framework (using my favourite method of inquiry: metaphorical bijectionism) to lay out foundations for yet another attempt to classify DA+TA patterns):
Attribute  ↔ Pattern

Artefact   ↔ Component Artefact1

Assemblage ↔ Component Assemblage

Culture    ↔ Memory System Culture
2

1 Can be either a component-generated artefact or a component like a module or symbol file
2 Typical examples of memory system cultures are Windows, UNIX or even “Multiplatform”
I propose a word Memoarchaeological for such a framework and Memoarchaeology for a branch of Memoretics that studies saved computer memory artifacts from past computations (as opposed to live memory).
Note: In one of the forthcoming issues of Debugged! MZ/PE magazine there will be presented yet another classificatory scheme.
- Dmitry Vostokov @ DumpAnalysis.org + TraceAnalysis.org -
Posted in Announcements, Archaeology of Computer Memory, CDA Pattern Classification, Crash Dump Analysis, Crash Dump Patterns, Debugging, Memoretics, Memory Analysis Forensics and Intelligence, New Words, Science of Memory Dump Analysis, Science of Software Tracing, Software Behavior Patterns, Software Trace Analysis, Trace Analysis Patterns | No Comments »
Sunday, April 18th, 2010
OpenTask to offer first 3 volumes of Memory Dump Analysis Anthology in one set:


The set is available exclusively from OpenTask e-Commerce web site starting from June. Individual volumes are also available from Amazon, Barnes & Noble and other bookstores worldwide.
Product information:
- Title: Modern Memory Dump and Software Trace Analysis: Volumes 1-3
- Author: Dmitry Vostokov
- Language: English
- Product Dimensions: 22.86 x 15.24
- Paperback: 1600 pages
- Publisher: Opentask (31 May 2010)
- ISBN-13: 978-1-906717-99-5
Information about individual volumes:
- Dmitry Vostokov @ DumpAnalysis.org + TraceAnalysis.org -
Posted in .NET Debugging, Aesthetics of Memory Dumps, Announcements, AntiPatterns, Art, Assembly Language, Books, Bugchecks Depicted, C and C++, CDA Pattern Classification, CDF Analysis Tips and Tricks, Categorical Debugging, Certification, Citrix, Code Reading, Common Mistakes, Computational Ghosts and Bug Hauntings, Computer Science, Countefactual Debugging, Crash Analysis Report Environment (CARE), Crash Dump Analysis, Crash Dump Patterns, Crash Dumps for Dummies, Data Recovery, DebugWare Patterns, Debugging, Debugging Methodology, Debugging Slang, Deep Down C++, Dictionary of Debugging, Dr. Watson, Education and Research, Escalation Engineering, Fun with Crash Dumps, Futuristic Memory Dump Analysis, GDB for WinDbg Users, Hardware, History, Horrors of Computation, Hyper-V, Intelligent Memory Movement, Kernel Development, Laws of Troubleshooting and Debugging, Mathematics of Debugging, Memiotics (Memory Semiotics), Memoidealism, Memoretics, Memory Analysis Culture, Memory Analysis Forensics and Intelligence, Memory Auralization, Memory Dump Analysis Jobs, Memory Religion (Memorianity), Memory Space Art, Memory Space Music, Memory Systems Language, Memory Visualization, Memuonics, Minidump Analysis, Multithreading, Music for Debugging, Music of Computation, New Acronyms, New Words, Occult Debugging, Philosophy, Psi-computation, Publishing, Science of Memory Dump Analysis, Science of Software Tracing, Security, Software Architecture, Software Defect Construction, Software Engineering, Software Generalist, Software Maintenance Institute, Software Narratology, Software Technical Support, Software Trace Analysis, Software Trace Visualization, Software Tracing for Dummies, Software Victimology, Stack Trace Collection, Testing, Tools, Trace Analysis Patterns, Training and Seminars, Troubleshooting Methodology, Victimware, Virtualization, Vista, Visual Dump Analysis, WinDbg Scripts, WinDbg Tips and Tricks, WinDbg for GDB Users, Windows 7, Windows Server 2008, Windows System Administration | No Comments »
Friday, April 9th, 2010
Plan to start providing training and seminars in my free time. If you are interested please answer these questions (you can either respond here in comments or use this form for private communication http://www.dumpanalysis.org/contact):
- Are you interested in on-site training, prefer traveling or attending webinars?
- Are you interested in software trace analysis as well?
- What specific topics are you interested in?
- What training level (beginner, intermediate, advanced) are you interested in? (please provide an example, if possible)
Additional topics of expertise that can be integrated into training include Source Code Reading and Analysis, Debugging, Windows Architecture, Device Drivers, Troubleshooting Tools Design and Implementation, Multithreading, Deep Down C and C++, x86 and x64 Assembly Language Reading.
Looking forward to your responses. Any suggestions are welcome.
- Dmitry Vostokov @ DumpAnalysis.org + TraceAnalysis.org -
Posted in .NET Debugging, Announcements, AntiPatterns, Assembly Language, Bugchecks Depicted, C and C++, CDA Pattern Classification, CDF Analysis Tips and Tricks, Certification, Code Reading, Common Mistakes, Crash Analysis Report Environment (CARE), Crash Dump Analysis, Crash Dump Patterns, Crash Dumps for Dummies, Data Recovery, DebugWare Patterns, Debugging, Debugging Methodology, Deep Down C++, Education and Research, Escalation Engineering, FreeBSD Crash Corner, GDB for WinDbg Users, Hardware, Hyper-V, Java Debugging, Kernel Development, Laws of Troubleshooting and Debugging, Linux Crash Corner, Mac Crash Corner, Memory Analysis Forensics and Intelligence, Memory Visualization, Minidump Analysis, Multithreading, Security, Software Architecture, Software Defect Construction, Software Engineering, Software Generalist, Software Maintenance Institute, Software Narratology, Software Technical Support, Software Trace Analysis, Software Trace Visualization, Software Tracing for Dummies, Software Victimology, Stack Trace Collection, Testing, Tools, Trace Analysis Patterns, Training and Seminars, Troubleshooting Methodology, Victimware, Virtualization, Vista, Visual Dump Analysis, WinDbg Scripts, WinDbg Tips and Tricks, WinDbg for GDB Users, Windows 7, Windows Server 2008, Windows System Administration, Workaround Patterns | No Comments »
Thursday, February 11th, 2010
This is a revised, edited, cross-referenced and thematically organized volume of selected DumpAnalysis.org blog posts about crash dump analysis and debugging written in July 2009 - January 2010 for software engineers developing and maintaining products on Windows platforms, quality assurance engineers testing software on Windows platforms and technical support and escalation engineers dealing with complex software issues. The fourth volume features:
- 13 new crash dump analysis patterns
- 13 new pattern interaction case studies
- 10 new trace analysis patterns
- 6 new Debugware patterns and case study
- Workaround patterns
- Updated checklist
- Fully cross-referenced with Volume 1, Volume 2 and Volume 3
- New appendixes
Product information:
- Title: Memory Dump Analysis Anthology, Volume 4
- Author: Dmitry Vostokov
- Language: English
- Product Dimensions: 22.86 x 15.24
- Paperback: 410 pages
- Publisher: Opentask (30 March 2010)
- ISBN-13: 978-1-906717-86-5
- Hardcover: 410 pages
- Publisher: Opentask (30 April 2010)
- ISBN-13: 978-1-906717-87-2

Back cover features memory space art image: Internal Process Combustion.
- Dmitry Vostokov @ DumpAnalysis.org + TraceAnalysis.org -
Posted in .NET Debugging, Aesthetics of Memory Dumps, Announcements, AntiPatterns, Art, Assembly Language, Books, C and C++, CDA Pattern Classification, CDF Analysis Tips and Tricks, Categorical Debugging, Certification, Citrix, Code Reading, Common Mistakes, Computer Science, Countefactual Debugging, Crash Analysis Report Environment (CARE), Crash Dump Analysis, Crash Dump Patterns, Crash Dumps for Dummies, DebugWare Patterns, Debugging, Debugging Slang, Education and Research, Escalation Engineering, Fun with Crash Dumps, Games for Debugging, Hardware, Horrors of Computation, Hyper-V, Kernel Development, Laws of Troubleshooting and Debugging, Mathematics of Debugging, Memiotics (Memory Semiotics), Memoidealism, Memoretics, Memory Analysis Culture, Memory Analysis Forensics and Intelligence, Memory Dreams, Memory Dump Analysis Jobs, Memory Dumps in Movies, Memory Space Art, Memory Visualization, Memuonics, Minidump Analysis, Multithreading, Music for Debugging, New Acronyms, New Words, Opcodism, Philosophy, Physicalist Art, Publishing, Science Fiction, Science of Memory Dump Analysis, Science of Software Tracing, Security, Software Architecture, Software Defect Construction, Software Engineering, Software Generalist, Software Maintenance Institute, Software Narratology, Software Technical Support, Software Trace Analysis, Software Trace Visualization, Software Tracing for Dummies, Software Victimology, Stack Trace Collection, Testing, Tools, Trace Analysis Patterns, Training and Seminars, Troubleshooting Methodology, Victimware, Virtualization, Vista, Visual Dump Analysis, WinDbg Scripts, WinDbg Tips and Tricks, WinDbg for GDB Users, Windows 7, Windows Server 2008, Windows System Administration, Workaround Patterns | No Comments »
Sunday, December 20th, 2009
“Memory dumps are facts.”
I’m very excited to announce that Volume 3 is available in paperback, hardcover and digital editions:
Memory Dump Analysis Anthology, Volume 3
Table of Contents
In two weeks paperback edition should also appear on Amazon and other bookstores. Amazon hardcover edition is planned to be available in January 2010.
The amount of information was so voluminous that I had to split the originally planned volume into two. Volume 4 should appear by the middle of February together with Color Supplement for Volumes 1-4.
- Dmitry Vostokov @ DumpAnalysis.org -
Posted in .NET Debugging, Aesthetics of Memory Dumps, Announcements, AntiPatterns, Art, Assembly Language, Books, Bugtations, C and C++, CDA Pattern Classification, CDF Analysis Tips and Tricks, Certification, Citrix, Code Reading, Common Mistakes, Computer Science, Crash Dump Analysis, Crash Dump Patterns, Crash Dumps for Dummies, DebugWare Patterns, Debugging, Debugging Slang, Deep Down C++, Education and Research, Escalation Engineering, Fun with Crash Dumps, Hardware, Horrors of Computation, Kernel Development, Mathematics of Debugging, Memiotics (Memory Semiotics), Memoidealism, Memoretics, Memory Analysis Culture, Memory Analysis Forensics and Intelligence, Memory Space Art, Memory Visualization, Minidump Analysis, Multithreading, Philosophy, Poetry, Publishing, Science of Memory Dump Analysis, Science of Software Tracing, Security, Software Architecture, Software Defect Construction, Software Engineering, Software Narratology, Software Technical Support, Software Trace Analysis, Software Trace Visualization, Software Tracing for Dummies, Software Victimology, Stack Trace Collection, Testing, Tools, Trace Analysis Patterns, Training and Seminars, Troubleshooting Methodology, Victimware, Virtualization, Vista, Visual Dump Analysis, WinDbg Scripts, WinDbg Tips and Tricks, WinDbg for GDB Users, Windows 7, Windows Server 2008, Windows System Administration | 1 Comment »
Monday, October 12th, 2009
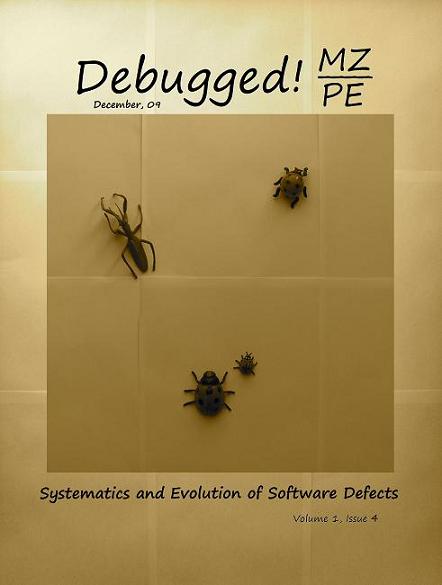
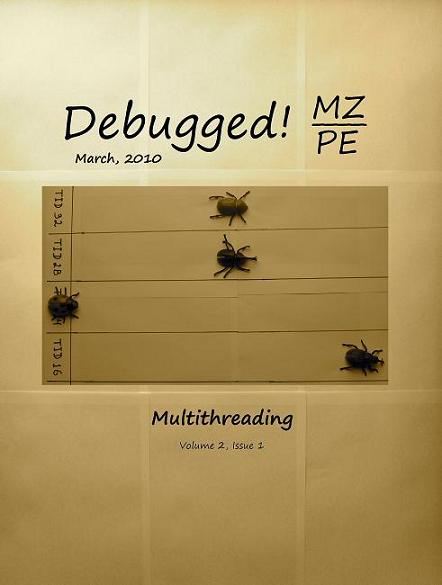
To commemorate 200 years since Darwin’s birth and 150 years since the publication of The Origin of Species, OpenTask plans to dedicate December, 2009 issue of Debugged! MZ/PE magazine to taxonomy and evolution of software defects and March, 2010 issue to multithreading (as natural selection).
Debugged! MZ/PE: Systematics and Evolution of Software Defects, December, 2009 (Paperback, ISBN: 978-1906717827)
Debugged! MZ/PE: Multithreading, March, 2010 (Paperback, ISBN: 978-1906717834)
Here are draft front covers designed during last weekend:
- Dmitry Vostokov @ DumpAnalysis.org -
Posted in Announcements, Books, CDA Pattern Classification, Computer Science, Crash Dump Analysis, Debugged! MZ/PE, Debugging, Multithreading, Publishing, Software Engineering, Software Technical Support | 2 Comments »
Tuesday, February 17th, 2009
While preparing a presentation for an engineering conference I found that a page to reference various wait chain patterns is necessary, so I created this post:
I’ll update it as soon as I add more similar patterns.
- Dmitry Vostokov @ DumpAnalysis.org -
Posted in CDA Pattern Classification, Crash Dump Analysis, Crash Dump Patterns, Debugging, Training and Seminars | 2 Comments »
Tuesday, February 17th, 2009
While preparing a presentation for an engineering conference I found that another different page to reference link time problems is necessary, so I created this post:
I’ll update it as soon as I add more similar patterns.
- Dmitry Vostokov @ DumpAnalysis.org -
Posted in CDA Pattern Classification, Crash Dump Analysis, Crash Dump Patterns, Debugging, Training and Seminars | 1 Comment »
Tuesday, February 17th, 2009
While preparing a presentation for an engineering conference I found that yet another page to reference different kinds of insufficient memory patterns is necessary, so I created this post:
I’ll update it as soon as I add more similar patterns.
- Dmitry Vostokov @ DumpAnalysis.org -
Posted in CDA Pattern Classification, Crash Dump Analysis, Crash Dump Patterns, Debugging, Training and Seminars | 1 Comment »
Tuesday, February 17th, 2009
While preparing a presentation for an engineering conference I found that another page to reference different kinds of dynamic memory corruption patterns is necessary, so I created this post too:
I’ll update it as soon as I add more similar patterns.
- Dmitry Vostokov @ DumpAnalysis.org -
Posted in CDA Pattern Classification, Crash Dump Analysis, Crash Dump Patterns, Debugging, Training and Seminars | No Comments »
Tuesday, February 17th, 2009
While preparing a presentation for an engineering conference I found that a page to reference all different kinds of deadlocks is necessary, so I created this post:
I’ll update it as soon as I add more similar patterns.
- Dmitry Vostokov @ DumpAnalysis.org + TraceAnalysis.org -
Posted in CDA Pattern Classification, Crash Dump Analysis, Crash Dump Patterns, Debugging, Training and Seminars | 2 Comments »
Tuesday, November 25th, 2008
As one of the new initiatives for the Year of Debugging DumpAnalysis Portal will publish bimonthly full color 16 page publication called:
Debugged! MZ/PE: MagaZine for/from Practicing Engineers
The only serial publication dedicated entirely to Windows® debugging
The first issue is planned for March, 2009 and will have ISBN-13: 978-1-906717-38-4. If it goes well I’m planning to have ISSN number assigned to it too. More details will be announced soon.
- Dmitry Vostokov @ DumpAnalysis.org -
Posted in Announcements, Assembly Language, Books, Bugchecks Depicted, CDA Pattern Classification, Citrix, Common Mistakes, Crash Dump Analysis, Crash Dump Patterns, Crash Dumps for Dummies, Data Recovery, Debugged! MZ/PE, Debugging, IDA for WinDbg Users, Kernel Development, Memory Analysis Forensics and Intelligence, Memory Visualization, Minidump Analysis, Philosophy, Publishing, Security, Software Technical Support, Testing, Tools, Training and Seminars, Troubleshooting Methodology, Vista, WinDbg Scripts, WinDbg Tips and Tricks, WinDbg for GDB Users, Windows Server 2008 | 4 Comments »
Sunday, August 10th, 2008
This is a new word I’ve just coined to describe applications heavily dependent on various hooks that are either injected by normal Windows hooking mechanism, registry or via more elaborate tricks like remote threads or patching code. Originally I thought of hookware but found that this term is already in use for completely different purpose.
Now I list various patterns in memory dumps that help in detection, troubleshooting and debugging of hooksware:
- Hooked Functions (user space)
- Hooked Functions (kernel space)
- Hooking Level
This is the primary detection mechanism for hooks that patch code.
See also Raw Pointer and Out-of-Module Pointer patterns.
- Hooked Modules
The WinDbg script to run when you don’t know which module was patched.
- Changed Environment
Loaded hooks shift other DLLs by changing their load address and therefore might expose dormant bugs.
- Insufficient Memory (module fragmentation)
Hooks loaded in the middle of address space limit the maximum amount of memory that can be allocated at once. For example, various virtual machines, like Java, reserve the big chunk of memory at the start up.
- No Component Symbols
We can get an approximate picture of what a 3rd-party hook module does by looking at its import table or in the case of patching by looking at the list of deviations returned by .chkimg command.
- Unknown Component
Might give an idea about the author of the hook.
- Coincidental Symbolic Information
Sometimes hooks are loaded at round addresses like 0×10000000 and these values are very frequently used as flags or constants too.
- Wild Code
When hooking goes wrong the execution path goes into the wild territory.
- Execution Residue
Here we can find various hooks that use normal Windows hooking mechanism. Sometimes the search for “hook” word in symbolic raw stack output of dds command reveals them but beware of Coincidental Symbolic Information. See also Raw Stack Analysis Scripts page.
- Message Hooks - Modeling Example
Windows message hooking pattern example.
- Hidden Module
Some hooks may hide themselves.
- Dmitry Vostokov @ DumpAnalysis.org + TraceAnalysis.org -
Posted in Announcements, CDA Pattern Classification, Crash Dump Analysis, Crash Dump Patterns, Debugging, Malware Analysis, Malware Patterns, Memory Analysis Forensics and Intelligence, New Words, WinDbg Scripts, WinDbg Tips and Tricks | 2 Comments »
Monday, July 21st, 2008
The following table provides correspondence between memory dump types (user, kernel and complete) and pattern names. For ALL, where appropriate, I also list the most common dump types where a pattern can be encountered.
Table: CDA Pattern Classification (Memory dump type)
- Dmitry Vostokov @ DumpAnalysis.org -
Posted in CDA Pattern Classification, Crash Dump Analysis, Crash Dump Patterns, Debugging | No Comments »
Monday, July 21st, 2008
The following table provides correspondence between kernel / user mode and space and pattern names. ALL means that a pattern is observable in both modes / spaces.
Table: CDA Pattern Classification (Space/Mode)
- Dmitry Vostokov @ DumpAnalysis.org -
Posted in CDA Pattern Classification, Crash Dump Analysis, Crash Dump Patterns, Debugging | No Comments »