Archive for the ‘Opcodism’ Category
Saturday, November 6th, 2010
I’m pleased to announce that MDAA, Volume 4 is available in PDF format:
www.dumpanalysis.org/Memory+Dump+Analysis+Anthology+Volume+4
It features:
- 15 new crash dump analysis patterns
- 13 new pattern interaction case studies
- 10 new trace analysis patterns
- 6 new Debugware patterns and case study
- Workaround patterns
- Updated checklist
- Fully cross-referenced with Volume 1, Volume 2 and Volume 3
- Memory visualization tutorials
- Memory space art
Its table of contents is available here:
http://www.dumpanalysis.org/MDAA/MDA-Anthology-V4-TOC.pdf
Paperback and hardcover versions should be available in a week or two. I also started working on Volume 5 that should be available in December.
- Dmitry Vostokov @ DumpAnalysis.org + TraceAnalysis.org -
Posted in .NET Debugging, Aesthetics of Memory Dumps, Announcements, AntiPatterns, Art, Assembly Language, Books, C and C++, CDF Analysis Tips and Tricks, Categorical Debugging, Common Mistakes, Complete Memory Dump Analysis, Computer Science, Countefactual Debugging, Crash Dump Analysis, Crash Dump Patterns, DebugWare Patterns, Debugging, Debugging Slang, Deep Down C++, Education and Research, Escalation Engineering, Fun with Crash Dumps, Fun with Debugging, Images of Computer Memory, Kernel Development, Memiotics (Memory Semiotics), Memoidealism, Memoretics, Memory Space Art, Memory Visualization, Memuonics, Metaphysics of Memory Worldview, Multithreading, Opcodism, Philosophy, Physicalist Art, Publishing, Science Fiction, Science of Memory Dump Analysis, Science of Software Tracing, Security, Software Architecture, Software Behavior Patterns, Software Defect Construction, Software Engineering, Software Narratology, Software Technical Support, Software Trace Analysis, Software Trace Reading, Software Victimology, Stack Trace Collection, Testing, Tools, Trace Analysis Patterns, Troubleshooting Methodology, Uses of UML, Victimware, Virtualization, Vista, Visual Dump Analysis, WinDbg Scripts, WinDbg Tips and Tricks, Windows 7, Windows Server 2008, Windows System Administration, Workaround Patterns, x64 Windows | No Comments »
Wednesday, June 23rd, 2010
Looks like reading Darwin biography influenced me in the direction of founding a museum. So I did and here’s its draft logo:

This multi-dimensional museum will show exhibitions dedicated to the history of debugging, memory dump artifacts and art. Stay tuned. The first exhibition opens very soon.
If you would like to donate an exhibit (for example, an old memory dump or a picture related to debugging) please use this page: http://www.dumpanalysis.org/contact. Any donations are greatly appreciated!
- Dmitry Vostokov @ DumpAnalysis.org + TraceAnalysis.org -
Posted in Announcements, Crash Dump Analysis, Debugging, History, Memorian Art, Memory Analysis Culture, Memory Auralization, Memory Dumps in Movies, Memory Dumps in Myths, Memory Space Art, Memory Space Music, Memory Visualization, Movies and Debugging, Museum of Debugging, Opcodism, Paleo-debugging, Physicalist Art, Software Trace Visualization, Stack Trace Collection | 2 Comments »
Thursday, February 11th, 2010
This is a revised, edited, cross-referenced and thematically organized volume of selected DumpAnalysis.org blog posts about crash dump analysis and debugging written in July 2009 - January 2010 for software engineers developing and maintaining products on Windows platforms, quality assurance engineers testing software on Windows platforms and technical support and escalation engineers dealing with complex software issues. The fourth volume features:
- 13 new crash dump analysis patterns
- 13 new pattern interaction case studies
- 10 new trace analysis patterns
- 6 new Debugware patterns and case study
- Workaround patterns
- Updated checklist
- Fully cross-referenced with Volume 1, Volume 2 and Volume 3
- New appendixes
Product information:
- Title: Memory Dump Analysis Anthology, Volume 4
- Author: Dmitry Vostokov
- Language: English
- Product Dimensions: 22.86 x 15.24
- Paperback: 410 pages
- Publisher: Opentask (30 March 2010)
- ISBN-13: 978-1-906717-86-5
- Hardcover: 410 pages
- Publisher: Opentask (30 April 2010)
- ISBN-13: 978-1-906717-87-2

Back cover features memory space art image: Internal Process Combustion.
- Dmitry Vostokov @ DumpAnalysis.org + TraceAnalysis.org -
Posted in .NET Debugging, Aesthetics of Memory Dumps, Announcements, AntiPatterns, Art, Assembly Language, Books, C and C++, CDA Pattern Classification, CDF Analysis Tips and Tricks, Categorical Debugging, Certification, Citrix, Code Reading, Common Mistakes, Computer Science, Countefactual Debugging, Crash Analysis Report Environment (CARE), Crash Dump Analysis, Crash Dump Patterns, Crash Dumps for Dummies, DebugWare Patterns, Debugging, Debugging Slang, Education and Research, Escalation Engineering, Fun with Crash Dumps, Games for Debugging, Hardware, Horrors of Computation, Hyper-V, Kernel Development, Laws of Troubleshooting and Debugging, Mathematics of Debugging, Memiotics (Memory Semiotics), Memoidealism, Memoretics, Memory Analysis Culture, Memory Analysis Forensics and Intelligence, Memory Dreams, Memory Dump Analysis Jobs, Memory Dumps in Movies, Memory Space Art, Memory Visualization, Memuonics, Minidump Analysis, Multithreading, Music for Debugging, New Acronyms, New Words, Opcodism, Philosophy, Physicalist Art, Publishing, Science Fiction, Science of Memory Dump Analysis, Science of Software Tracing, Security, Software Architecture, Software Defect Construction, Software Engineering, Software Generalist, Software Maintenance Institute, Software Narratology, Software Technical Support, Software Trace Analysis, Software Trace Visualization, Software Tracing for Dummies, Software Victimology, Stack Trace Collection, Testing, Tools, Trace Analysis Patterns, Training and Seminars, Troubleshooting Methodology, Victimware, Virtualization, Vista, Visual Dump Analysis, WinDbg Scripts, WinDbg Tips and Tricks, WinDbg for GDB Users, Windows 7, Windows Server 2008, Windows System Administration, Workaround Patterns | No Comments »
Monday, October 12th, 2009
The best of artistic work commissioned by OpenTask to be published with annotations in the following book scheduled to open 2010, The Year of The Foundation of Debugging (Crash Dump Analysis):
Spikes, Hangs, Crashes, Leaks and Dumps of Imagination: The Art of the Debugging Art (ISBN: 978-1906717841)
Note: This is not a book about natural computer memory visualization.
- Dmitry Vostokov @ DumpAnalysis.org -
Posted in Announcements, Art, Books, Debugged! MZ/PE, Debugging, Memory Dreams, Opcodism, Physicalist Art, Poetry, Publishing | No Comments »
Wednesday, September 30th, 2009
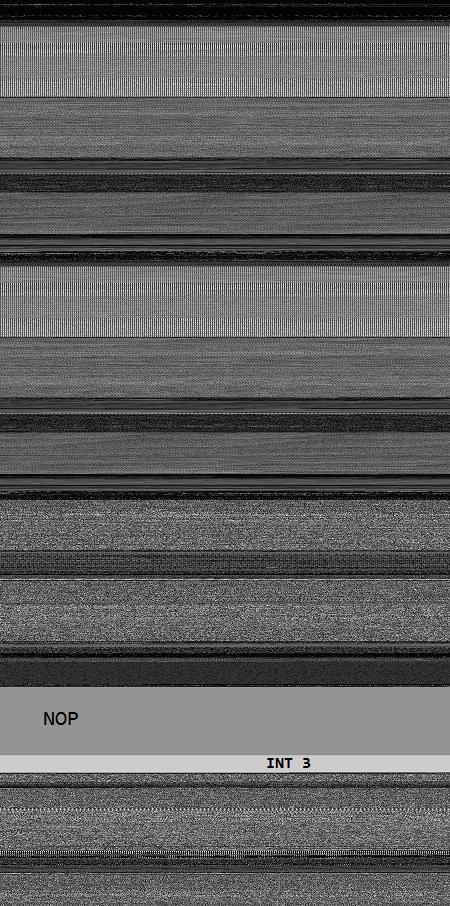
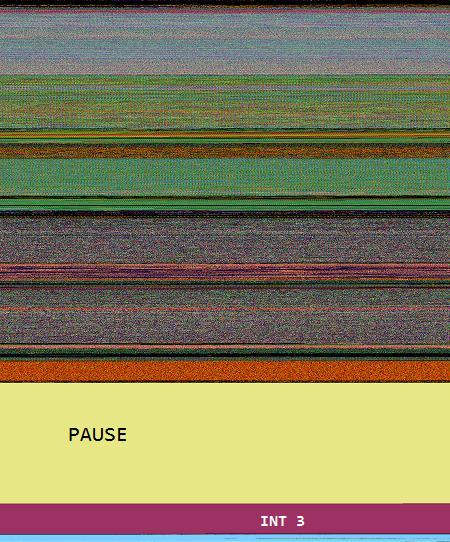
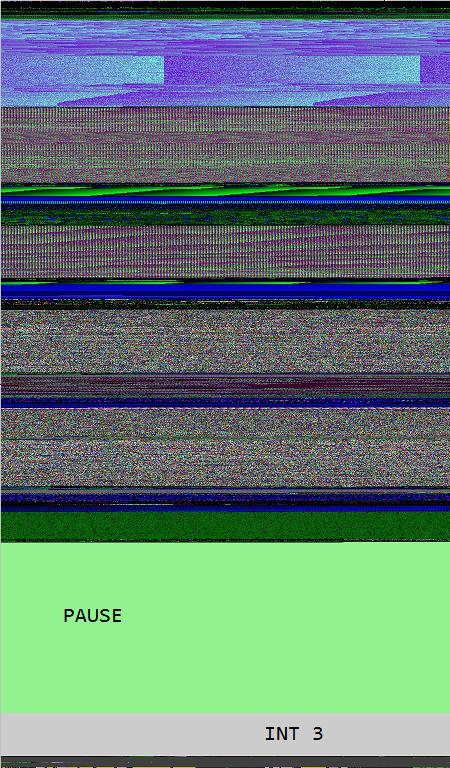
Opcodism art is not limited to assembly language code and binary installations. It also provides beautiful color illustrations of processor opcodes and instructions. In this post I provide illustrations of NOP, PAUSE and INT 3 instructions generated by Dump2Picture from memory dump images of crashed 1MbNop and 1MbPause processes.
0:000> lmp

start             end                 module name

00000000`77030000 00000000`7715d000   kernel32

00000000`77230000 00000000`773b6000   ntdll

00000001`40000000 00000001`40144000   1MbNop

000007fe`fd1c0000 000007fe`fd1f5000   apphelp

000007fe`fdaf0000 000007fe`fdc33000   rpcrt4

000007fe`ff400000 000007fe`ff508000   advapi32
8 bit image of 1Mb NOP field fenced by INT 3 wall:
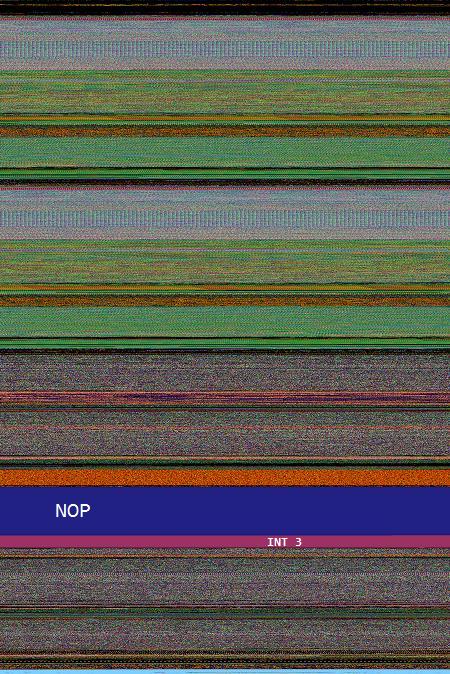
16 bit image of 1Mb NOP field fenced by INT 3 wall:
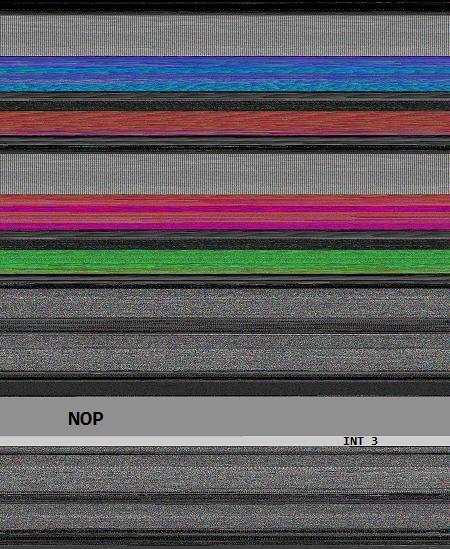
24 bit image of 1Mb NOP field fenced by INT 3 wall:
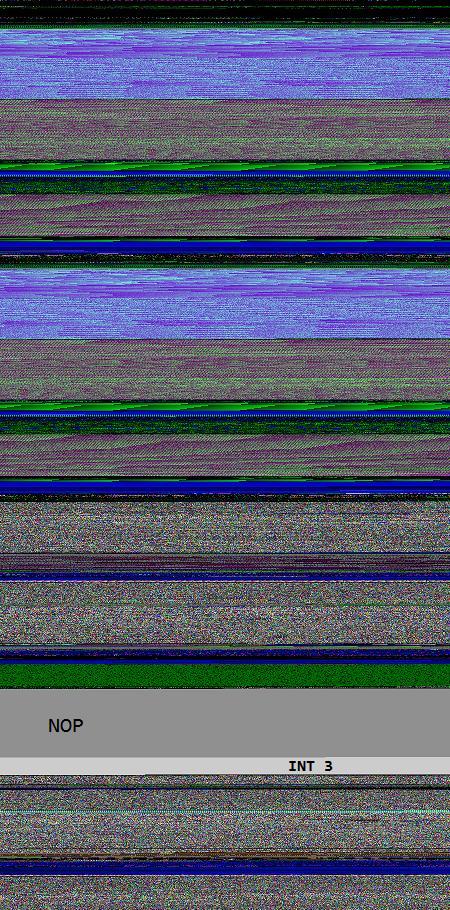
32 bit image of 1Mb NOP field fenced by INT 3 wall:
0:000> lmp

start             end                 module name

00000000`77030000 00000000`7715d000   kernel32

00000000`77230000 00000000`773b6000   ntdll

00000001`40000000 00000001`40284000   1MbPause
8 bit image of 1Mb PAUSE field fenced by INT 3 wall:
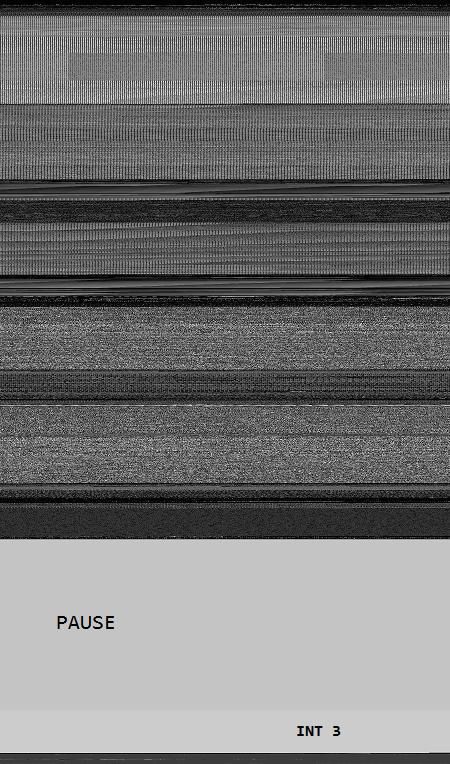
The same as above but PAUSE / INT 3 transition magnified:

16 bit image of 1Mb PAUSE field fenced by INT 3 wall:
24 bit image of 1Mb PAUSE field fenced by INT 3 wall:
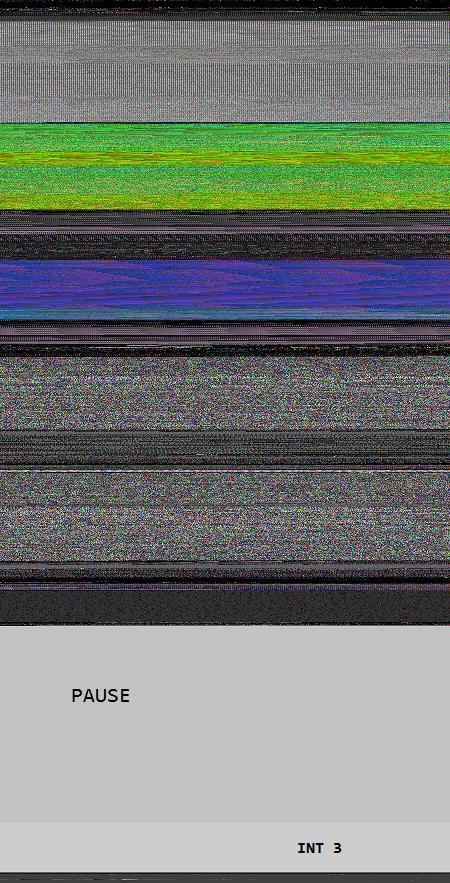
The same as above but PAUSE / INT 3 transition magnified:

32 bit image of 1Mb PAUSE field fenced by INT 3 wall:
- Dmitry Vostokov @ DumpAnalysis.org -
Posted in Art, Assembly Language, Breakfast with Intel, Fun with Crash Dumps, Memory Visualization, Opcodism | No Comments »
Monday, September 28th, 2009
Fascinated by Kazimir Malevich’s Black Square I created the new art genre with the following two artistic installations:
A Pause before Crash
This is 1Mb of PAUSE instructions without the point of return:
_text SEGMENT
main PROC
DW 100000h DUP (90f3h)
main ENDP
_text ENDS
END
When launched it crashes:
0:000> kL

Child-SP          RetAddr           Call Site

00000000`0012ff58 00000000`7704be3d 1MbPause+0x201011

00000000`0012ff60 00000000`77256a51 kernel32!BaseThreadInitThunk+0xd

00000000`0012ff90 00000000`00000000 ntdll!RtlUserThreadStart+0x1d
0:000> ub rip

1MbPause+0x201002:

00000001`40201002 f390            pause

00000001`40201004 f390            pause

00000001`40201006 f390            pause

00000001`40201008 f390            pause

00000001`4020100a f390            pause

00000001`4020100c f390            pause

00000001`4020100e f390            pause

00000001`40201010 cc              int     3
You can download the source code, PDB and 64-bit EXE from here:
1MbPause.zip
Do Nothing and Crash
This is 1Mb of NOP instructions without the point of return:
_text SEGMENT
main PROC
DB 100000h DUP (90h)
main ENDP
_text ENDS
END
When launched it crashes too:
0:000> kL

Child-SP          RetAddr           Call Site

00000000`0012ff58 00000000`7704be3d 1MbNop+0x101011

00000000`0012ff60 00000000`77256a51 kernel32!BaseThreadInitThunk+0xd

00000000`0012ff90 00000000`00000000 ntdll!RtlUserThreadStart+0x1d
0:000> ub rip

1MbNop+0x101009:

00000001`40101009 90              nop

00000001`4010100a 90              nop

00000001`4010100b 90              nop

00000001`4010100c 90              nop

00000001`4010100d 90              nop

00000001`4010100e 90              nop

00000001`4010100f 90              nop

00000001`40101010 cc              int     3
You can download the source code, PDB and 64-bit EXE from here:
1MbNop.zip
The earliest opcodism binary was created on October 25th, 2006 that I now call Nothingness and Crash: The Smallest Program.
- Dmitry Vostokov @ DumpAnalysis.org -
Posted in Announcements, Art, Assembly Language, Fun with Crash Dumps, New Words, Opcodism | 5 Comments »