Pointer Award
Thursday, July 31st, 2008This is a proposal for Debug Awards from Narasimha Vedala:
OSCAR parallel in debugging world - Pointer Award

- Dmitry Vostokov @ DumpAnalysis.org -
This is a proposal for Debug Awards from Narasimha Vedala:
OSCAR parallel in debugging world - Pointer Award
- Dmitry Vostokov @ DumpAnalysis.org -
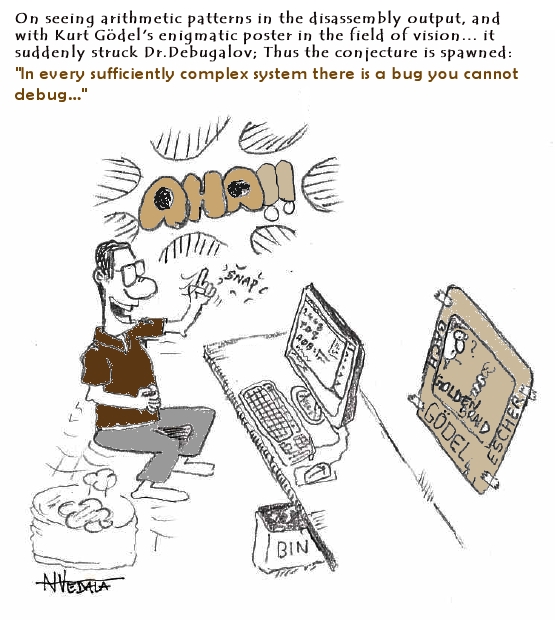
New cartoon from Narasimha Vedala, Science series, provides great insight into incompleteness of debugging:
Debugalov’s Conjecture… “In every sufficiently complex system there is a bug you cannot debug…”
- Dmitry Vostokov @ DumpAnalysis.org -
New version of StressPrinters tool is available that has a fix for the following bug:
When you run the tool it enumerates all installed printer drivers. When Citrix Universal Printer driver is found the enumeration procedure skips the rest of the list. This results in not showing all the drivers installed in Citrix terminal services environment.
You can download the new version from Citrix support website: CTX109374.
- Dmitry Vostokov @ DumpAnalysis.org -
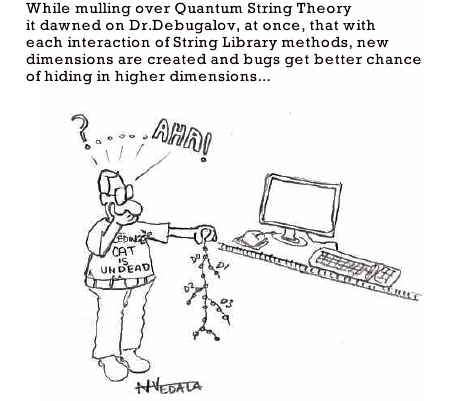
New cartoon from Narasimha Vedala, Science series, provides great insight into strcat(…)-family of functions:
Quantum String Theory and bugs chance…
- Dmitry Vostokov @ DumpAnalysis.org -
Opposite to Overaged System sometimes we can see Young System pattern. This means that the system didn’t have time to initialize and subsequently mature or reach the state when the problem could surface. Usual signs are less than a minute system uptime (or larger, depends on a problem context) and the low number of processes and services running (also, sometimes the problem description mentions a terminal services session but there is only one console session in the dump, or two as in Vista and Windows Server 2008):
System Uptime: 0 days 0:00:18.562
3: kd> !vm

[...]

         0248 lsass.exe         1503 (      6012 Kb)

         020c winlogon.exe      1468 (      5872 Kb)

         03b8 svchost.exe        655 (      2620 Kb)

         023c services.exe       416 (      1664 Kb)

         01f0 csrss.exe          356 (      1424 Kb)

         0338 svchost.exe        298 (      1192 Kb)

         02dc svchost.exe        259 (      1036 Kb)

         0374 svchost.exe        240 (       960 Kb)

         039c svchost.exe        224 (       896 Kb)

         01bc smss.exe            37 (       148 Kb)

         0004 System               8 (        32 Kb)
3: kd> !session

Sessions on machine: 1

Valid Sessions: 0
In the case of the fully initialized system the manual dump might have been taken after reboot when the bugcheck already happened or any other reason stemming from the usual confusion between crashes and hangs.
Similar considerations apply to a young process as well, where Process Uptime value from user dumps or ElapsedTime value from kernel or complete memory dumps is too small unless we have obvious crash or hang signs inside, for example, exceptions, deadlock, wait chain or blocked thread waiting for another coupled process:
Process Uptime: 0 days 0:00:10.000
3: kd> !process 8a389d88

PROCESS 8a389d88  SessionId: 0  Cid: 020c    Peb: 7ffdf000  ParentCid: 01bc

    DirBase: 7fbe6080  ObjectTable: e1721008  HandleCount: 455.

    Image: winlogon.exe

    VadRoot 8a65d070 Vads 194 Clone 0 Private 1166. Modified 45. Locked 0.

    DeviceMap e10030f8

    Token                             e139bde0

    ElapsedTime                       00:00:01.062

    UserTime                          00:00:00.046

    KernelTime                        00:00:00.015

    QuotaPoolUsage[PagedPool]         71228

    QuotaPoolUsage[NonPagedPool]      72232

    Working Set Sizes (now,min,max)  (2265, 50, 345) (9060KB, 200KB, 1380KB)

    PeakWorkingSetSize                2267

    VirtualSize                       41 Mb

    PeakVirtualSize                   42 Mb

    PageFaultCount                    2605

    MemoryPriority                    BACKGROUND

    BasePriority                      13

    CommitCharge                      1468
- Dmitry Vostokov @ DumpAnalysis.org -
Have you ever noticed how software bugs twist together or entwine into a confusing mass of an intricate trap that complicates and confuses debugging? Welcome to Bug Entanglement or just Bugtanglement[1], the new word inspired by quantum mechanics, see Quantum entanglement for analogy. We don’t see a software bug until an observer makes a measurement… And how uncertain these measurements (memory dumps, for example) are! If an observer interferes, it is not the same system, like we see it from observation, anymore. And once we made our measurement, the software system continues to evolve according to its internal design function which we never know fully and only approximate with our requirements specifications.
Welcome to Quantum Theory of Software Bugs ![]()
After writing the last paragraph I did Google search and found that I just rediscovered what was already discovered more than 10 years ago by Bernard Robertson-Dunn:
[1] Seems I coined yet another word…, Google is silent.
- Dmitry Vostokov @ DumpAnalysis.org -
New cartoon from Narasimha Vedala, Spiderman series:
Dr. Debugalov Boots the Spidey

- Dmitry Vostokov @ DumpAnalysis.org -
Suppose you are debugging a process and you want to send its memory dump to another engineer perhaps in a different company. You also use some symbol files that are not available on public symbol servers or your dump is minidump that requires certain images to be loaded too. Then you can use .dumpcab command to save a dump in a CAB file together with necessary symbols and images. You can only do it when your debugging target is a dump file. If you are debugging a live process you need to save a dump file first:
0:000> .dump /ma c:\UserDumps\notepad.dmp

Creating c:\UserDumps\notepad.dmp - mini user dump

Dump successfully written
Then you open the dump file and create a CAB file from it:
Loading Dump File [C:\UserDumps\notepad.dmp]

User Mini Dump File with Full Memory: Only application data is available
[...]
0:001> .dumpcab -a c:\UserDumps\notepad.cab

Creating a cab file can take a VERY VERY long time

.Ctrl-C can only interrupt the command after a file has been added to the cab.

  Adding C:\UserDumps\notepad.dmp - added

  Adding c:\mss\ntdll.pdb\B958B2F91A5A46B889DAFAB4D140CF252\ntdll.pdb - added

Wrote c:\UserDumps\notepad.cab
Additional information can be found in WinDbg help.
- Dmitry Vostokov @ DumpAnalysis.org -
These are handy shortcuts to .frame command. .f+ shifts the current frame index down the stack trace and .f- shifts it up towards the top. More information can be found in WinDbg help.
Here is an example from notepad process stack trace:
0:000> kn

 # ChildEBP RetAddr

00 001bfcfc 761ef837 ntdll!KiFastSystemCallRet

01 001bfd00 761ef86a USER32!NtUserGetMessage+0xc

02 001bfd1c 00c31418 USER32!GetMessageW+0x33

03 001bfd5c 00c3195d notepad!WinMain+0xec

04 001bfdec 76364911 notepad!_initterm_e+0x1a1

05 001bfdf8 76fde4b6 kernel32!BaseThreadInitThunk+0xe

06 001bfe38 76fde489 ntdll!__RtlUserThreadStart+0x23

07 001bfe50 00000000 ntdll!_RtlUserThreadStart+0x1b

0:000> .f+

01 001bfd00 761ef86a USER32!NtUserGetMessage+0xc

0:000> .f+

02 001bfd1c 00c31418 USER32!GetMessageW+0x33

0:000> .f+

03 001bfd5c 00c3195d notepad!WinMain+0xec

0:000> .f+

04 001bfdec 76364911 notepad!_initterm_e+0x1a1

0:000> .f-

03 001bfd5c 00c3195d notepad!WinMain+0xec

0:000> .f-

02 001bfd1c 00c31418 USER32!GetMessageW+0x33

0:000> .f-

01 001bfd00 761ef86a USER32!NtUserGetMessage+0xc

0:000> .f-

00 001bfcfc 761ef837 ntdll!KiFastSystemCallRet

0:000> .f-

         ^ Current frame index underflow '.f-'
- Dmitry Vostokov @ DumpAnalysis.org -
A year passed since I coined the word Citrixware. Now there are even more Citrix products on the market so definitely this word deserves more widespread use.
- Dmitry Vostokov @ DumpAnalysis.org -
I’ve just started writing the new series for the Russian version of my blog. It is called English for Software Engineers (in Russian) where I found new uses for UML (Unified Modeling Language) to teach important grammar patterns and concepts. Just to show you an example, here are two sequence diagrams depicting the difference between Present Perfect Tense and Past Tense:

- Dmitry Vostokov @ DumpAnalysis.org -
Just noticed that the new book will be published this August:
The Developer’s Guide to Debugging

Table of contents is available here:
Springer (ISBN: 978-1-4020-5539-3 TOC)
I’ve pre-ordered it and once I get it and read it I’ll post a review.
- Dmitry Vostokov @ DumpAnalysis.org -
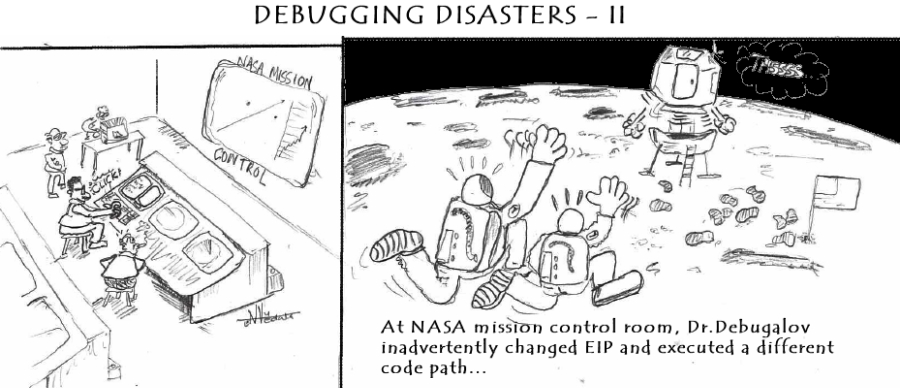
New cartoon from Narasimha Vedala, Debugging Disasters series (click on it to enlarge):
Debugging Disasters II
- Dmitry Vostokov @ DumpAnalysis.org -
Some WinDbg commands are very useful as shortcuts to common debugging actions. While working on Windows Debugging Notebook I constantly discover them and here is the first one: .exptr
“The .exptr command displays an EXCEPTION_POINTERS structure.” (from WinDbg help)
When looking at hidden exceptions and manual crash dumps we need information from this structure and this command provides a convenient way to see both exception record and exception context in one unified output:
0:003> kv

ChildEBP RetAddr  Args to Child

00b3e11c 7c822124 7c83970f 0000004c 00000000 ntdll!KiFastSystemCallRet

00b3e120 7c83970f 0000004c 00000000 00000000 ntdll!NtWaitForSingleObject+0xc

00b3e15c 7c839620 00000000 00000004 00000001 ntdll!RtlpWaitOnCriticalSection+0x19c

00b3e17c 7c832ad0 7c889d94 09150000 7c889e0c ntdll!RtlEnterCriticalSection+0xa8

00b3e1b0 77e68de4 00000001 00000000 00b3e1ec ntdll!LdrLockLoaderLock+0xe4

00b3e210 77e98fae 09150000 00b3e5b0 00000104 kernel32!GetModuleFileNameW+0x77

00b3e24c 77e76d5f 091518b8 00b3e5a4 00000000 kernel32!FillUEFInfo+0x51

00b3e8d4 77e84269 00b3e8fc 77e6b831 00b3e904 kernel32!UnhandledExceptionFilter+0xec

00b3e8dc 77e6b831 00b3e904 00000000 00b3e904 kernel32!BaseThreadStart+0×4a

00b3e904 7c82eeb2 00b3e9e8 00b3ffdc 00b3ea04 kernel32!_except_handler3+0×61

00b3e928 7c82ee84 00b3e9e8 00b3ffdc 00b3ea04 ntdll!ExecuteHandler2+0×26

00b3e9d0 7c82ecc6 00b38000 00b3ea04 00b3e9e8 ntdll!ExecuteHandler+0×24

00b3e9d0 7c832335 00b38000 00b3ea04 00b3e9e8 ntdll!KiUserExceptionDispatcher+0xe (CONTEXT @ 00b3ea04)

00b3eeec 77e67319 00090000 00000000 0000056a ntdll!RtlAllocateHeap+0×9e3

[…]
0:003> .exptr 00b3e8fc
----- Exception record at 00b3e9e8:

ExceptionAddress: 7c832335 (ntdll!RtlAllocateHeap+0x000009e3)

   ExceptionCode: c0000005 (Access violation)

  ExceptionFlags: 00000000

NumberParameters: 2

   Parameter[0]: 00000001

   Parameter[1]: 0008019d

Attempt to write to address 0008019d
----- Context record at 00b3ea04:

eax=0325f1f0 ebx=00000051 ecx=00090000 edx=00090400 esi=0008019d edi=0325f1e8

eip=7c832335 esp=00b3ecd0 ebp=00b3eeec iopl=0 nv up ei ng nz na po cy

cs=001b  ss=0023  ds=0023  es=0023  fs=003b  gs=0000  efl=00010283

ntdll!RtlAllocateHeap+0x9e3:

7c832335 8906            mov     dword ptr [esi],eax  ds:0023:0008019d=01000002
- Dmitry Vostokov @ DumpAnalysis.org -
New cartoon from Narasimha Vedala (untold Spiderman tales):
SPIDERMAN 2 - Doc Octopus Gets a Fix

- Dmitry Vostokov @ DumpAnalysis.org -
It is important to save crash dumps at the right time, for example, when an error message box is shown as discussed in one of my previous posts:
Crash Dumps for Dummies (Part 7)
However, sometimes crash dumps are saved after a visual indicator of the problem disappeared and the opportunity to see the stack trace was gone. This pattern is called Lost Opportunity. Here is one example of a service memory dump saved manually after it became unresponsive. In the dump file there was only one thread left excluding the thread created by a debugger:
0:001> ~*kv
   0  Id: a3c.700 Suspend: 1 Teb: 7ff59000 Unfrozen

ChildEBP RetAddr  Args to Child

1178fd60 7c822124 77e6bad8 00000574 00000000 ntdll!KiFastSystemCallRet

1178fd64 77e6bad8 00000574 00000000 00000000 ntdll!NtWaitForSingleObject+0xc

1178fdd4 77e6ba42 00000574 ffffffff 00000000 kernel32!WaitForSingleObjectEx+0xac

1178fde8 67e223dd 00000574 ffffffff 1178fe10 kernel32!WaitForSingleObject+0x12

1178fdfc 7c82257a 67e20000 00000000 00000001 componentA!DllInitialize+0xed

1178fe1c 7c8118b0 67e222f0 67e20000 00000000 ntdll!LdrpCallInitRoutine+0x14

1178feb8 77e53002 00000000 00000000 00000000 ntdll!LdrShutdownProcess+0x130

1178ffa4 77e53065 c0000005 77e8f3b0 ffffffff kernel32!_ExitProcess+0×43

1178ffb8 77e84277 c0000005 00000000 00000000 kernel32!ExitProcess+0×14

1178ffec 00000000 77c5de6d 0a078138 00000000 kernel32!BaseThreadStart+0×5f
#  1  Id: a3c.18bc Suspend: 1 Teb: 7ffde000 Unfrozen

ChildEBP RetAddr  Args to Child

0a6cffc8 7c845ea0 00000005 00000004 00000001 ntdll!DbgBreakPoint

0a6cfff4 00000000 00000000 00905a4d 00000003 ntdll!DbgUiRemoteBreakin+0x36
We also see exception code 0xc0000005 as ExitProcess parameter. The raw stack reveals the call to NtRaiseHardError function that definitely resulted in some error message box:
0:001> ~0s

[...]
0:000> !teb

TEB at 7ff59000

    ExceptionList:        1178fdc4

    StackBase:            11790000

    StackLimit:           11789000

    SubSystemTib:         00000000

    FiberData:            00001e00

    ArbitraryUserPointer: 00000000

    Self:                 7ff59000

    EnvironmentPointer:   00000000

    ClientId:             00000a3c . 00000700

    RpcHandle:            00000000

    Tls Storage:          00000000

    PEB Address:          7ffdf000

    LastErrorValue:       0

    LastStatusValue:      c0000008

    Count Owned Locks:    0

    HardErrorMode:        0
0:000> dds 11789000  11790000

11789000  00000000

11789004  00000000

11789008  00000000

1178900c  00000000

11789010  00000000

[...]

1178f058  0a4016f4

1178f05c  1178efe0

1178f060  695040c4 <Unloaded_faultrep.dll>+0x40c4

1178f064  7ffdf000

1178f068  00000000

1178f06c  0a4016f4

1178f070  0a4016f4

1178f074  00000000

1178f078  1178f06c

1178f07c  0a4016b8

1178f080  0a4016b8

1178f084  1178efa0

1178f088  7c821b74 ntdll!NtRaiseHardError+0xc

1178f08c  77e99af9 kernel32!UnhandledExceptionFilter+0×54b

1178f090  d0000144

1178f094  00000004

1178f098  00000000

1178f09c  1178f164

1178f0a0  00000001

1178f0a4  77e996a7 kernel32!UnhandledExceptionFilter+0×873

1178f0a8  00000000

1178f0ac  00000000

1178f0b0  00000000

1178f0b4  02f049f0

1178f0b8  1178f13c

1178f0bc  00000000

[…]
It was that time when the dump should have been saved. See also Process crash - getting the dump manually post for another example and full explanation.
- Dmitry Vostokov @ DumpAnalysis.org -
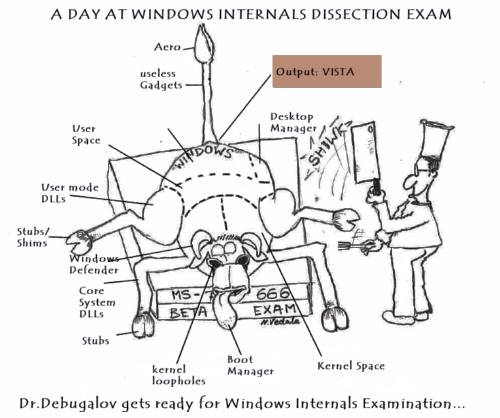
New cartoon from Narasimha Vedala provides an artist perspective:
A Day at Windows Internals Dissection Exam
- Dmitry Vostokov @ DumpAnalysis.org -
This is another case study showing how different patterns interact. It was reported that the service was spiking CPU (see Spiking Thread pattern) and other processes couldn’t communicate with it (see Coupled Processes pattern). The dump was saved using userdump.exe and !runaway command showed that the thread #18 was consuming CPU mostly in user mode:
0:018> !runaway 0y11

 User Mode Time

  Thread       Time

  18:6080      0 days 20:46:57.156

   3:2838      0 days 0:00:00.203

   5:53a0      0 days 0:00:00.093

  16:44a8      0 days 0:00:00.078

  17:2ad8      0 days 0:00:00.046

  19:5834      0 days 0:00:00.015

[…]

   0:57d4      0 days 0:00:00.000

 Kernel Mode Time

  Thread       Time

   5:53a0      0 days 0:00:03.328

   3:2838      0 days 0:00:01.046

  16:44a8      0 days 0:00:00.937

  18:6080      0 days 0:00:00.765

  17:2ad8      0 days 0:00:00.531

  19:5834      0 days 0:00:00.171

  20:3174      0 days 0:00:00.140

[…]
Its thread stack revealed runtime heap manipulation function on top of it:
0:018> ~18kL

ChildEBP RetAddr

0207f748 77e673ca ntdll!RtlFreeHeap+0×4a5

0207f7b0 77e67690 kernel32!BasepComputeProcessPath+0×395

0207f7b0 77e67690 kernel32!BaseComputeProcessDllPath+0xe3

0207f7f0 77e41b95 kernel32!BaseComputeProcessDllPath+0xe3

0207f850 710f43d9 kernel32!LoadLibraryExW+0×14e

[…]
The parameters to RtlFreeHeap call are described in the following MSDN article:
http://msdn.microsoft.com/en-us/library/ms796710.aspx
We see that the code was freeing the heap block with the address 0×02f88278 and it was located in the first heap 0×00090000:
0:018> ~18kv

ChildEBP RetAddr  Args to Child

0207f748 77e673ca 00090000 00000000 02f88278 ntdll!RtlFreeHeap+0×4a5

[…]
0:018> !heap

Index   Address  Name      Debugging options enabled

  1:   00090000

  2:   00190000

  3:   003b0000

  4:   00340000

  5:   00380000

  6:   007d0000

  7:   008e0000

  8:   00a40000

  9:   00ae0000

 10:   00c60000

 11:   00cf0000

 12:   00d30000

 13:   00d40000

 14:   00ed0000

 15:   01010000

 16:   01090000

 17:   00a20000

 18:   00c90000

 19:   00fd0000

 20:   01690000

 21:   01b30000

 22:   01b50000

 23:   01c20000

 24:   01e50000

 25:   01f20000

 26:   01f30000

 27:   01f40000
Could it be the case that the heap was corrupt? We can validate it:
0:018> !heap -s 00090000

Walking the heap 00090000 .HEAP 00090000 (Seg 00090640) At 00184998 Error: invalid block size
.List corrupted: (Blink->Flink = 00000000) != (Block = 02f88278)

HEAP 00090000 (Seg 02f80000) At 02f88270 Error: block list entry corrupted
[...]
The output shows our block 0×02f88278 too but this could also be the effect of False Positive Corruption, the fact that the heap control structures had not been updated yet: the thread is inside heap manipulation function.
When looking at critical sections and other threads we also see several wait chains (see Wait Chain pattern):
0:000> !locks
CritSec ntdll!LdrpLoaderLock+0 at 7c889d94

WaiterWoken        No

LockCount          18

RecursionCount     1

OwningThread       2300

EntryCount         0

ContentionCount    141

*** Locked
CritSec ntdll!FastPebLock+0 at 7c889d40

WaiterWoken        No

LockCount          1

RecursionCount     1

OwningThread       2904

EntryCount         0

ContentionCount    2

*** Locked
CritSec +90608 at 00090608

WaiterWoken        No

LockCount          7

RecursionCount     1

OwningThread       6080

EntryCount         0

ContentionCount    7

*** Locked
CritSec serviceA!ServiceSection+0 at 7617c340

WaiterWoken        No

LockCount          5

RecursionCount     1

OwningThread       2838

EntryCount         0

ContentionCount    1e3

*** Locked
0:000> ~*kv
[...]
3 Id: da4.2838 Suspend: 1 Teb: 7ffdc000 Unfrozen

ChildEBP RetAddr Args to Child

00c4f164 7c822124 7c83970f 00000688 00000000 ntdll!KiFastSystemCallRet

00c4f168 7c83970f 00000688 00000000 00000000 ntdll!NtWaitForSingleObject+0xc

00c4f1a4 7c839620 00000000 00000004 00090000 ntdll!RtlpWaitOnCriticalSection+0x19c

00c4f1c4 7c82fe72 00090608 000995b8 00000008 ntdll!RtlEnterCriticalSection+0xa8

00c4f3ec 7c81f4d5 00090000 00800000 000000f8 ntdll!RtlAllocateHeap+0×313

00c4f434 7c81f073 000995b8 00000000 00090000 ntdll!RtlpAllocateUserBlock+0×91

00c4f4f8 7c81ff83 00000bbe 00000000 00000001 ntdll!RtlpLowFragHeapAlloc+0×862

00c4f71c 7c820b23 00090000 00000000 0000000c ntdll!RtlAllocateHeap+0×80

00c4f734 77f6599e 00c4f7b8 00000001 00000002 ntdll!RtlAllocateAndInitializeSid+0×35

00c4f768 74062bfd 00c4f7b8 00000001 00000002 advapi32!AllocateAndInitializeSid+0×2c

[…]
[...]
18 Id: da4.6080 Suspend: 1 Teb: 7ffa8000 Unfrozen

[This is our spiking thread]

[...]
[...]
32 Id: da4.2904 Suspend: 1 Teb: 7ff9a000 Unfrozen

ChildEBP RetAddr Args to Child

0356fbfc 7c822124 7c83970f 00000688 00000000 ntdll!KiFastSystemCallRet

0356fc00 7c83970f 00000688 00000000 00000000 ntdll!NtWaitForSingleObject+0xc

0356fc3c 7c839620 00000000 00000004 00090000 ntdll!RtlpWaitOnCriticalSection+0x19c

0356fc5c 7c82fe72 00090608 7c8329a4 0000008e ntdll!RtlEnterCriticalSection+0xa8

0356fe84 77e67319 00090000 00000000 0000056a ntdll!RtlAllocateHeap+0×313

0356fee8 77e67690 77e676bc 00020a50 00000000 kernel32!BasepComputeProcessPath+0xc2

0356ff28 77e41b95 00000000 00000000 7c82f337 kernel32!BaseComputeProcessDllPath+0xe3

0356ff88 77e67b77 74066908 00000000 00000000 kernel32!LoadLibraryExW+0×14e

0356ff9c 74071b74 74066908 74075320 74071c1c kernel32!LoadLibraryW+0×11

[…]
  33  Id: da4.2300 Suspend: 1 Teb: 7ff99000 Unfrozen

ChildEBP RetAddr  Args to Child

035afb40 7c822124 7c83970f 00000164 00000000 ntdll!KiFastSystemCallRet

035afb44 7c83970f 00000164 00000000 00000000 ntdll!NtWaitForSingleObject+0xc

035afb80 7c839620 00000000 00000004 00000000 ntdll!RtlpWaitOnCriticalSection+0x19c

035afba0 7c83288c 7c889d40 77e630b8 00000000 ntdll!RtlEnterCriticalSection+0xa8

035afba8 77e630b8 00000000 007e5860 00000001 ntdll!RtlAcquirePebLock+0×11

[…]
[...]
18 threads -> TID#2300 -> TID#2904 -> TID#6080
5 threads -> TID#2838 -> TID#6080
So it looks like our spiking thread was the main problem and preventing other threads from running.
- Dmitry Vostokov @ DumpAnalysis.org -
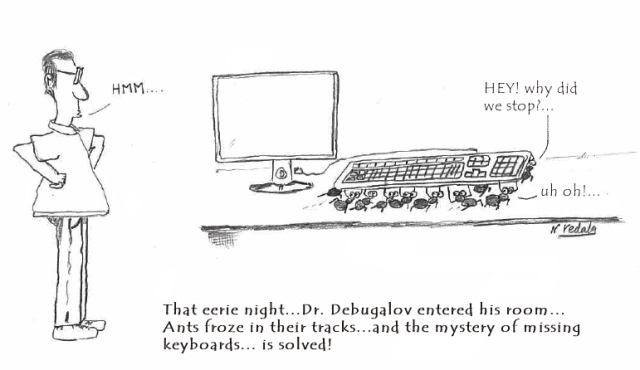
New cartoon from Narasimha Vedala based on a real event (click on it to enlarge):
Mysteriously Missing Keyboard
- Dmitry Vostokov @ DumpAnalysis.org -
When a process experienced an unhandled exception what were the possible reasons for a postmortem debugger not saving a crash dump? One of them will be illustrated in this post. The process AppA was hanging and causing another process AppB to hang too (see Coupled Processes pattern). If we look at AppA locked critical sections we would see a loader deadlock:
0:000> !locks
CritSec ntdll!LdrpLoaderLock+0 at 7c889d94

WaiterWoken        No

LockCount          8

RecursionCount     2

OwningThread       4534

EntryCount         0

ContentionCount    a3e

*** Locked
CritSec ntdll!FastPebLock+0 at 7c889d40

WaiterWoken        No

LockCount          2

RecursionCount     1

OwningThread       3eb4

EntryCount         0

ContentionCount    15

*** Locked
   3  Id: 30b0.3eb4 Suspend: 1 Teb: 7ffdb000 Unfrozen

ChildEBP RetAddr  Args to Child

00b3e11c 7c822124 7c83970f 0000004c 00000000 ntdll!KiFastSystemCallRet

00b3e120 7c83970f 0000004c 00000000 00000000 ntdll!NtWaitForSingleObject+0xc

00b3e15c 7c839620 00000000 00000004 00000001 ntdll!RtlpWaitOnCriticalSection+0×19c

00b3e17c 7c832ad0 7c889d94 09150000 7c889e0c ntdll!RtlEnterCriticalSection+0xa8

00b3e1b0 77e68de4 00000001 00000000 00b3e1ec ntdll!LdrLockLoaderLock+0xe4

00b3e210 77e98fae 09150000 00b3e5b0 00000104 kernel32!GetModuleFileNameW+0×77

00b3e24c 77e76d5f 091518b8 00b3e5a4 00000000 kernel32!FillUEFInfo+0×51

00b3e8d4 77e84269 00b3e8fc 77e6b831 00b3e904 kernel32!UnhandledExceptionFilter+0xec

00b3e8dc 77e6b831 00b3e904 00000000 00b3e904 kernel32!BaseThreadStart+0×4a

00b3e904 7c82eeb2 00b3e9e8 00b3ffdc 00b3ea04 kernel32!_except_handler3+0×61

00b3e928 7c82ee84 00b3e9e8 00b3ffdc 00b3ea04 ntdll!ExecuteHandler2+0×26

00b3e9d0 7c82ecc6 00b38000 00b3ea04 00b3e9e8 ntdll!ExecuteHandler+0×24

00b3e9d0 7c832335 00b38000 00b3ea04 00b3e9e8 ntdll!KiUserExceptionDispatcher+0xe (CONTEXT @ 00b3ea04)

00b3eeec 77e67319 00090000 00000000 0000056a ntdll!RtlAllocateHeap+0×9e3

00b3ef50 77e67690 77e676bc 00020a50 00000000 kernel32!BasepComputeProcessPath+0xc2

00b3ef90 77e41b95 00000000 00000000 00b3f05c kernel32!BaseComputeProcessDllPath+0xe3

00b3eff0 77e67b77 74065a30 00000000 00000000 kernel32!LoadLibraryExW+0×14e

00b3f004 7406615c 74065a30 007e1ab0 00000000 kernel32!LoadLibraryW+0×11

00b3f020 74066263 007e1ab0 00000000 534c4354 AppA!ProcessItem+0×2d

[…]
  21  Id: 30b0.4534 Suspend: 1 Teb: 7ffa3000 Unfrozen

ChildEBP RetAddr  Args to Child

031eeef8 7c822124 7c83970f 00000350 00000000 ntdll!KiFastSystemCallRet

031eeefc 7c83970f 00000350 00000000 00000000 ntdll!NtWaitForSingleObject+0xc

031eef38 7c839620 00000000 00000004 031ef278 ntdll!RtlpWaitOnCriticalSection+0×19c

031eef58 7c830c25 7c889d40 031ef328 00000000 ntdll!RtlEnterCriticalSection+0xa8

031ef200 7c831016 00000001 031ef2ac 031ef288 ntdll!RtlpDosPathNameToRelativeNtPathName_Ustr+0×97

031ef21c 7c830f85 031ef2ac 031ef288 00000000 ntdll!RtlDosPathNameToRelativeNtPathName_Ustr+0×18

031ef290 7c833ce9 031ef2ac 00000001 031ef414 ntdll!RtlDoesFileExists_UstrEx+0×1c

031ef2c0 7c83350e 031ef328 031ef434 031ef33c ntdll!LdrpSearchPath+0×76

031ef3c4 7c833637 0325fc78 031ef414 00000000 ntdll!LdrpCheckForLoadedDll+0xdc

031ef668 7c833ee5 00000000 0325fc78 031ef968 ntdll!LdrpLoadDll+0×1b3

031ef8e4 77e41bcc 0325fc78 031ef968 031ef948 ntdll!LdrLoadDll+0×198

031ef984 5e00b8d7 00115b00 00000000 00000008 kernel32!LoadLibraryExW+0×1b2

031ef9b0 5dff64aa 000cee40 7406275b 0000059c AppA!LoadPluginModule+0×42

[…]
Looking at TID#3eb4 we see that the cause for deadlock was an exception while loading a DLL. Applying exception context WinDbg command .cxr reveals heap corruption pattern:
0:003> .cxr 00b3ea04

eax=0325f1f0 ebx=00000051 ecx=00090000 edx=00090400 esi=0008019d edi=0325f1e8

eip=7c832335 esp=00b3ecd0 ebp=00b3eeec iopl=0  nv up ei ng nz na po cy

cs=001b  ss=0023  ds=0023  es=0023  fs=003b  gs=0000  efl=00010283

ntdll!RtlAllocateHeap+0×9e3:

7c832335 8906            mov     dword ptr [esi],eax  ds:0023:0008019d={(AppA+0×2) (01000002)}
0:003> kL

  *** Stack trace for last set context - .thread/.cxr resets it

ChildEBP RetAddr

00b3eeec 77e67319 ntdll!RtlAllocateHeap+0×9e3

00b3ef50 77e67690 kernel32!BasepComputeProcessPath+0xc2

00b3ef90 77e41b95 kernel32!BaseComputeProcessDllPath+0xe3

00b3eff0 77e67b77 kernel32!LoadLibraryExW+0×14e

00b3f004 7406615c kernel32!LoadLibraryW+0×11

00b3f020 74066263 AppA!ProcessItem+0×2d

[…]
Seems the address pointed by ESI is valid: [0008019d] = 01000002. However this is write MOV instruction but the accessed memory page is read-only:
0:003> !address 01000002

    01000000 : 01000000 - 00001000

                    Type     01000000 MEM_IMAGE

                    Protect  00000002 PAGE_READONLY

                    State    00001000 MEM_COMMIT

                    Usage    RegionUsageImage

                    FullPath […]AppA.exe
Without heap corruption the normal course of action can be depicted on the following diagram (Wait Chain pattern applied to critical sections):
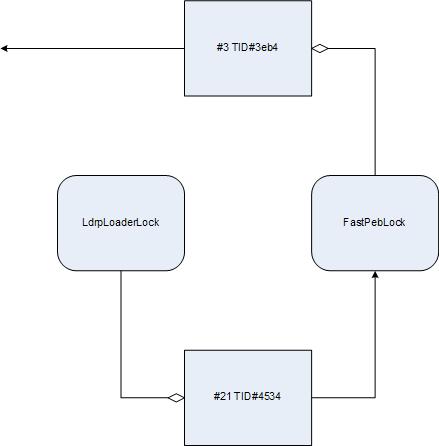
However the exception changes the picture. The course of execution is deflected to the loader again and the loop is closed. We have a classical deadlock:
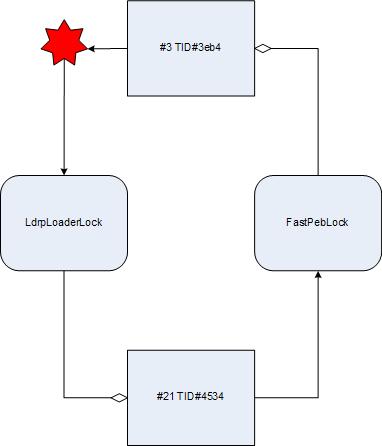
- Dmitry Vostokov @ DumpAnalysis.org -