Archive for the ‘WinDbg for GDB Users’ Category
Monday, April 30th, 2012
As we started providing memory dump analysis pattern examples for Mac OS X we resume our table of command correspondence between WinDbg and GDB providing some corrections on the way. For example, in the previous version of table we omitted a correspondence to ub WinDbg command. Now we provide such an equivalent:
(gdb) bt

[...]

#1  0×000000010e8cce73 in bar (ps=0×7fff6e4cbac0)

[…]
(gdb) disas 0×000000010e8cce73-10 0×000000010e8cce73

Dump of assembler code from 0×10e8cce69 to 0×10e8cce73:

0×000000010e8cce69 :	mov    %edi,-0×8(%rbp)

0×000000010e8cce6c :	mov    -0×8(%rbp),%rdi

0×000000010e8cce70 :	callq  *0×8(%rdi)

End of assembler dump.
Please note that the beginning of assembly will be dependent on how good we guessed the offset:
(gdb) disas 0x000000010e8cce73-0×10 0×000000010e8cce73

Dump of assembler code from 0×10e8cce63 to 0×10e8cce73:

0×000000010e8cce63 :	in     $0×48,%eax

0×000000010e8cce65 :	sub    $0×10,%esp

0×000000010e8cce68 :	mov    %rdi,-0×8(%rbp)

0×000000010e8cce6c :	mov    -0×8(%rbp),%rdi

0×000000010e8cce70 :	callq  *0×8(%rdi)

End of assembler dump.
(gdb) disas 0x000000010e8cce73-0×13 0×000000010e8cce73

Dump of assembler code from 0×10e8cce60 to 0×10e8cce73:

0×000000010e8cce60 :	push   %rbp

0×000000010e8cce61 :	mov    %rsp,%rbp

0×000000010e8cce64 :	sub    $0×10,%rsp

0×000000010e8cce68 :	mov    %rdi,-0×8(%rbp)

0×000000010e8cce6c :	mov    -0×8(%rbp),%rdi

0×000000010e8cce70 :	callq  *0×8(%rdi)

End of assembler dump.
However, we can ignore that because our goal is to check whether a CPU instruction before a return address is a call.
Additional commands we add are x/<N>bc for db (WinDbg), thread <N> for ~<N>s (WinDbg, process dumps), maintenance info sections for for !address (WinDbg), add-symbol-file for .reload (WinDbg), info r for r (WinDbg).
Action                      | GDB                 | WinDbg
----------------------------------------------------------------
Start the process           | run                 | g
Exit                        | (q)uit              | q
Disassemble (forward)       | (disas)semble       | uf, u
Disassemble N instructions  | x/<N>i              | -
Disassemble (backward)      | disas <a-o> <a>     | ub
Stack trace                 | backtrace (bt)      | k
Full stack trace            | bt full             | kv
Stack trace with parameters | bt full             | kP
Partial trace (innermost)   | bt <N>              | k <N>
Partial trace (outermost)   | bt -<N>             | -
Stack trace for all threads | thread apply all bt | ~*k
Breakpoint                  | break               | bp
Frame numbers               | any bt command      | kn
Select frame                | frame               | .frame
Display parameters          | info args           | dv /t /i /V
Display locals              | info locals         | dv /t /i /V
Dump byte char array        | x/<N>bc             | db
Switch to thread            | thread <N>          | ~<N>s
Sections/regions            | maint info sections | !address
Load symbol file            | add-symbol-file     | .reload
CPU registers               | i(nfo) r            | r
Now an advertisement command:
(gdb) info training

(gdb) Accelerated Mac OS X Core Dump Analysis training
- Dmitry Vostokov @ DumpAnalysis.org + TraceAnalysis.org -
Posted in Core Dump Analysis, Crash Dump Analysis, Debugging, GDB for WinDbg Users, Linux Crash Corner, Mac Crash Corner, Mac OS X, WinDbg for GDB Users | 1 Comment »
Sunday, April 15th, 2012
After 4 years in print this bestselling title needs an update to address minor changes, include extra examples and reference additional research published in Volumes 2, 3, 4, 5 and 6.
- Title: Memory Dump Analysis Anthology, Volume 1
- Author: Dmitry Vostokov
- Publisher: OpenTask (Summer 2012)
- Language: English
- Product Dimensions: 22.86 x 15.24
- Paperback: 800 pages
- ISBN-13: 978-1-908043-35-1
- Hardcover: 800 pages
- ISBN-13: 978-1-908043-36-8
The cover for both paperback and hardcover titles will also have a matte finish. We used A Memory Window artwork for the back cover.

- Dmitry Vostokov @ DumpAnalysis.org + TraceAnalysis.org -
Posted in Aesthetics of Memory Dumps, Announcements, AntiPatterns, Art, Assembly Language, Best Practices, Books, Bugchecks Depicted, C and C++, Complete Memory Dump Analysis, Computer Science, Crash Dump Analysis, Crash Dump Patterns, Crash Dumps for Dummies, Debugging, Debugging Methodology, Dr. Watson, Escalation Engineering, Fun with Crash Dumps, GDB for WinDbg Users, Hardware, Images of Computer Memory, Kernel Development, Mathematics of Debugging, Memiotics (Memory Semiotics), Memoretics, Memory Dump Analysis Methodology, Memory Space Art, Memory Space Music, Memory Visualization, Minidump Analysis, Multithreading, Pattern-Driven Debugging, Pattern-Driven Software Support, Publishing, Reference, Root Cause Analysis, Science of Memory Dump Analysis, Software Architecture, Software Behavior DNA, Software Behavior Patterns, Software Behavioral Genome, Software Diagnostics, Software Engineering, Software Technical Support, Stack Trace Collection, Testing, Tools, Troubleshooting Methodology, Vista, WinDbg Scripts, WinDbg Tips and Tricks, WinDbg for GDB Users, Windows 7, Windows Data Structures, Windows Server 2008, Windows System Administration, x64 Windows | No Comments »
Sunday, April 17th, 2011
I’m pleased to announce that MDAA, Volume 5 is available in PDF format:
www.dumpanalysis.org/Memory+Dump+Analysis+Anthology+Volume+5
It features:
- 25 new crash dump analysis patterns
- 11 new pattern interaction case studies (including software tracing)
- 16 new trace analysis patterns
- 7 structural memory patterns
- 4 modeling case studies for memory dump analysis patterns
- Discussion of 3 common analysis mistakes
- Malware analysis case study
- Computer independent architecture of crash analysis report service
- Expanded coverage of software narratology
- Metaphysical and theological implications of memory dump worldview
- More pictures of memory space and physicalist art
- Classification of memory visualization tools
- Memory visualization case studies
- Close reading of the stories of Sherlock Holmes: Dr. Watson’s observational patterns
- Fully cross-referenced with Volume 1, Volume 2, Volume 3, and Volume 4
Its table of contents is available here:
www.dumpanalysis.org/MDAA/MDA-Anthology-V5-TOC.pdf
Paperback and hardcover versions should be available in a week or two. I also started working on Volume 6 that should be available in November-December.
- Dmitry Vostokov @ DumpAnalysis.org + TraceAnalysis.org -
Posted in Aesthetics of Memory Dumps, Analysis Notation, Announcements, AntiPatterns, Archaeology of Computer Memory, Art, Assembly Language, Best Practices, Books, C and C++, CDF Analysis Tips and Tricks, Categorical Debugging, Citrix, Common Mistakes, Common Questions, Complete Memory Dump Analysis, Computer Forensics, Computer Science, Crash Analysis Report Environment (CARE), Crash Dump Analysis, Crash Dump De-analysis, Crash Dump Patterns, Crash Dumps for Dummies, Cyber Warfare, Debugging, Debugging Bureau, Debugging Industry, Debugging Methodology, Debugging Slang, Debugging Trends, Deep Down C++, Dr. Watson, Dublin School of Security, Education and Research, Escalation Engineering, Fun with Crash Dumps, Fun with Debugging, Fun with Software Traces, General Memory Analysis, Hermeneutics of Memory Dumps and Traces, Images of Computer Memory, Kernel Development, Malware Analysis, Mathematics of Debugging, Memiotics (Memory Semiotics), Memory Analysis Forensics and Intelligence, Memory Diagrams, Memory Dump Analysis Services, Memory Dumps in Myths, Memory Space Art, Memory Systems Language, Memory Visualization, Memory and Glitches, Metaphysics of Memory Worldview, Multithreading, Music for Debugging, New Acronyms, New Debugging School, New Words, Pattern Models, Philosophy, Physicalist Art, Publishing, Reverse Engineering, Science of Memory Dump Analysis, Science of Software Tracing, Security, Software Architecture, Software Behavior Patterns, Software Chorography, Software Chorology, Software Defect Construction, Software Engineering, Software Generalist, Software Maintenance Institute, Software Narratology, Software Technical Support, Software Trace Analysis, Software Trace Reading, Software Trace Visualization, Software Tracing for Dummies, Software Troubleshooting Patterns, Software Victimology, Structural Memory Patterns, Structural Trace Patterns, Systems Thinking, Testing, The Way of Philip Marlowe, Tools, Trace Analysis Patterns, Training and Seminars, Troubleshooting Methodology, Victimware, Vista, Webinars, WinDbg Scripting Extensions, WinDbg Scripts, WinDbg Tips and Tricks, WinDbg for GDB Users, Windows 7, Windows Server 2008, Windows System Administration, Workaround Patterns, x64 Windows | No Comments »
Friday, November 12th, 2010
Five volumes of cross-disciplinary Anthology (dubbed by the author “The Summa Memorianica”) lay the foundation of the scientific discipline of Memoretics (study of computer memory snapshots and their evolution in time) that is also called Memory Dump and Software Trace Analysis.ca
The 5th volume contains revised, edited, cross-referenced, and thematically organized selected DumpAnalysis.org blog posts about crash dump, software trace analysis and debugging written in February 2010 - October 2010 for software engineers developing and maintaining products on Windows platforms, quality assurance engineers testing software on Windows platforms, technical support and escalation engineers dealing with complex software issues, and security researchers, malware analysts and reverse engineers. The fifth volume features:
- 25 new crash dump analysis patterns
- 11 new pattern interaction case studies (including software tracing)
- 16 new trace analysis patterns
- 7 structural memory patterns
- 4 modeling case studies for memory dump analysis patterns
- Discussion of 3 common analysis mistakes
- Malware analysis case study
- Computer independent architecture of crash analysis report service
- Expanded coverage of software narratology
- Metaphysical and theological implications of memory dump worldview
- More pictures of memory space and physicalist art
- Classification of memory visualization tools
- Memory visualization case studies
- Close reading of the stories of Sherlock Holmes: Dr. Watson’s observational patterns
- Fully cross-referenced with Volume 1, Volume 2, Volume 3, and Volume 4
Product information:
- Title: Memory Dump Analysis Anthology, Volume 5
- Author: Dmitry Vostokov
- Language: English
- Product Dimensions: 22.86 x 15.24
- Paperback: 400 pages
- Publisher: Opentask (10 December 2010)
- ISBN-13: 978-1-906717-96-4
- Hardcover: 400 pages
- Publisher: Opentask (10 December 2010)
- ISBN-13: 978-1-906717-97-1

Back cover features memory space art image Hot Computation: Memory on Fire.
- Dmitry Vostokov @ DumpAnalysis.org + TraceAnalysis.org -
Posted in Aesthetics of Memory Dumps, Announcements, Archaeology of Computer Memory, Art, Assembly Language, Books, C and C++, CDF Analysis Tips and Tricks, Categorical Debugging, Common Mistakes, Complete Memory Dump Analysis, Computer Science, Crash Analysis Report Environment (CARE), Crash Dump Analysis, Crash Dump De-analysis, Crash Dump Patterns, Debugging, Debugging Methodology, Debugging Slang, Deep Down C++, Dr. Watson, Dublin School of Security, Education and Research, Escalation Engineering, Fun with Crash Dumps, Fun with Debugging, Fun with Software Traces, General Memory Analysis, Hermeneutics of Memory Dumps and Traces, Images of Computer Memory, Kernel Development, Malware Analysis, Malware Patterns, Mathematics of Debugging, Memiotics (Memory Semiotics), Memoidealism, Memoretics, Memory Analysis Culture, Memory Analysis Forensics and Intelligence, Memory Analysis Report System, Memory Diagrams, Memory Dreams, Memory Dump Analysis Jobs, Memory Dump Analysis Services, Memory Dump Analysis and History, Memory Dumps in Movies, Memory Dumps in Myths, Memory Religion (Memorianity), Memory Space Art, Memory Systems Language, Memory Visualization, Memory and Glitches, Memuonics, Metaphysical Society of Ireland, Minidump Analysis, Movies and Debugging, Multithreading, Museum of Debugging, Music for Debugging, Music of Computation, New Acronyms, New Words, Paleo-debugging, Pattern Models, Pattern Prediction, Philosophy, Physicalist Art, Psychoanalysis of Software Maintenance and Support, Publishing, Science of Memory Dump Analysis, Science of Software Tracing, Security, Software Architecture, Software Behavior Patterns, Software Chorography, Software Chorology, Software Defect Construction, Software Engineering, Software Generalist, Software Maintenance Institute, Software Narratology, Software Technical Support, Software Trace Analysis, Software Trace Analysis and History, Software Trace Deconstruction, Software Trace Reading, Software Trace Visualization, Software Tracing for Dummies, Software Troubleshooting Patterns, Software Victimology, Stack Trace Collection, Structural Memory Analysis and Social Sciences, Structural Memory Patterns, Structural Trace Patterns, Systems Thinking, Testing, Theology, Tool Objects, Tools, Trace Analysis Patterns, Training and Seminars, Troubleshooting Methodology, Uses of UML, Victimware, Virtualization, Vista, Visual Dump Analysis, Webinars, WinDbg Scripts, WinDbg Tips and Tricks, WinDbg for GDB Users, Windows 7, Windows Server 2008, Windows System Administration, Workaround Patterns, x64 Windows | No Comments »
Sunday, April 18th, 2010
OpenTask to offer first 3 volumes of Memory Dump Analysis Anthology in one set:


The set is available exclusively from OpenTask e-Commerce web site starting from June. Individual volumes are also available from Amazon, Barnes & Noble and other bookstores worldwide.
Product information:
- Title: Modern Memory Dump and Software Trace Analysis: Volumes 1-3
- Author: Dmitry Vostokov
- Language: English
- Product Dimensions: 22.86 x 15.24
- Paperback: 1600 pages
- Publisher: Opentask (31 May 2010)
- ISBN-13: 978-1-906717-99-5
Information about individual volumes:
- Dmitry Vostokov @ DumpAnalysis.org + TraceAnalysis.org -
Posted in .NET Debugging, Aesthetics of Memory Dumps, Announcements, AntiPatterns, Art, Assembly Language, Books, Bugchecks Depicted, C and C++, CDA Pattern Classification, CDF Analysis Tips and Tricks, Categorical Debugging, Certification, Citrix, Code Reading, Common Mistakes, Computational Ghosts and Bug Hauntings, Computer Science, Countefactual Debugging, Crash Analysis Report Environment (CARE), Crash Dump Analysis, Crash Dump Patterns, Crash Dumps for Dummies, Data Recovery, DebugWare Patterns, Debugging, Debugging Methodology, Debugging Slang, Deep Down C++, Dictionary of Debugging, Dr. Watson, Education and Research, Escalation Engineering, Fun with Crash Dumps, Futuristic Memory Dump Analysis, GDB for WinDbg Users, Hardware, History, Horrors of Computation, Hyper-V, Intelligent Memory Movement, Kernel Development, Laws of Troubleshooting and Debugging, Mathematics of Debugging, Memiotics (Memory Semiotics), Memoidealism, Memoretics, Memory Analysis Culture, Memory Analysis Forensics and Intelligence, Memory Auralization, Memory Dump Analysis Jobs, Memory Religion (Memorianity), Memory Space Art, Memory Space Music, Memory Systems Language, Memory Visualization, Memuonics, Minidump Analysis, Multithreading, Music for Debugging, Music of Computation, New Acronyms, New Words, Occult Debugging, Philosophy, Psi-computation, Publishing, Science of Memory Dump Analysis, Science of Software Tracing, Security, Software Architecture, Software Defect Construction, Software Engineering, Software Generalist, Software Maintenance Institute, Software Narratology, Software Technical Support, Software Trace Analysis, Software Trace Visualization, Software Tracing for Dummies, Software Victimology, Stack Trace Collection, Testing, Tools, Trace Analysis Patterns, Training and Seminars, Troubleshooting Methodology, Victimware, Virtualization, Vista, Visual Dump Analysis, WinDbg Scripts, WinDbg Tips and Tricks, WinDbg for GDB Users, Windows 7, Windows Server 2008, Windows System Administration | No Comments »
Friday, April 9th, 2010
Plan to start providing training and seminars in my free time. If you are interested please answer these questions (you can either respond here in comments or use this form for private communication http://www.dumpanalysis.org/contact):
- Are you interested in on-site training, prefer traveling or attending webinars?
- Are you interested in software trace analysis as well?
- What specific topics are you interested in?
- What training level (beginner, intermediate, advanced) are you interested in? (please provide an example, if possible)
Additional topics of expertise that can be integrated into training include Source Code Reading and Analysis, Debugging, Windows Architecture, Device Drivers, Troubleshooting Tools Design and Implementation, Multithreading, Deep Down C and C++, x86 and x64 Assembly Language Reading.
Looking forward to your responses. Any suggestions are welcome.
- Dmitry Vostokov @ DumpAnalysis.org + TraceAnalysis.org -
Posted in .NET Debugging, Announcements, AntiPatterns, Assembly Language, Bugchecks Depicted, C and C++, CDA Pattern Classification, CDF Analysis Tips and Tricks, Certification, Code Reading, Common Mistakes, Crash Analysis Report Environment (CARE), Crash Dump Analysis, Crash Dump Patterns, Crash Dumps for Dummies, Data Recovery, DebugWare Patterns, Debugging, Debugging Methodology, Deep Down C++, Education and Research, Escalation Engineering, FreeBSD Crash Corner, GDB for WinDbg Users, Hardware, Hyper-V, Java Debugging, Kernel Development, Laws of Troubleshooting and Debugging, Linux Crash Corner, Mac Crash Corner, Memory Analysis Forensics and Intelligence, Memory Visualization, Minidump Analysis, Multithreading, Security, Software Architecture, Software Defect Construction, Software Engineering, Software Generalist, Software Maintenance Institute, Software Narratology, Software Technical Support, Software Trace Analysis, Software Trace Visualization, Software Tracing for Dummies, Software Victimology, Stack Trace Collection, Testing, Tools, Trace Analysis Patterns, Training and Seminars, Troubleshooting Methodology, Victimware, Virtualization, Vista, Visual Dump Analysis, WinDbg Scripts, WinDbg Tips and Tricks, WinDbg for GDB Users, Windows 7, Windows Server 2008, Windows System Administration, Workaround Patterns | No Comments »
Monday, April 5th, 2010
I’m very pleased to announce that the Korean edition is available:

The book can be found on:
- Dmitry Vostokov @ DumpAnalysis.org + TraceAnalysis.org -
Posted in Announcements, AntiPatterns, Assembly Language, Books, Books (Korean), C and C++, Computer Science, Crash Dump Analysis, Crash Dump Patterns, Crash Dumps for Dummies, Debugging, Dr. Watson, Escalation Engineering, Fun with Crash Dumps, GDB for WinDbg Users, Hardware, Kernel Development, Mathematics of Debugging, Memiotics (Memory Semiotics), Memoretics, Memory Space Music, Memory Visualization, Minidump Analysis, Multithreading, Publishing, Science of Memory Dump Analysis, Security, Software Architecture, Software Engineering, Software Technical Support, Testing, Tools, Troubleshooting Methodology, Virtualization, Vista, WinDbg Scripts, WinDbg Tips and Tricks, WinDbg for GDB Users, Windows Server 2008, Windows System Administration | No Comments »
Thursday, February 11th, 2010
This is a revised, edited, cross-referenced and thematically organized volume of selected DumpAnalysis.org blog posts about crash dump analysis and debugging written in July 2009 - January 2010 for software engineers developing and maintaining products on Windows platforms, quality assurance engineers testing software on Windows platforms and technical support and escalation engineers dealing with complex software issues. The fourth volume features:
- 13 new crash dump analysis patterns
- 13 new pattern interaction case studies
- 10 new trace analysis patterns
- 6 new Debugware patterns and case study
- Workaround patterns
- Updated checklist
- Fully cross-referenced with Volume 1, Volume 2 and Volume 3
- New appendixes
Product information:
- Title: Memory Dump Analysis Anthology, Volume 4
- Author: Dmitry Vostokov
- Language: English
- Product Dimensions: 22.86 x 15.24
- Paperback: 410 pages
- Publisher: Opentask (30 March 2010)
- ISBN-13: 978-1-906717-86-5
- Hardcover: 410 pages
- Publisher: Opentask (30 April 2010)
- ISBN-13: 978-1-906717-87-2

Back cover features memory space art image: Internal Process Combustion.
- Dmitry Vostokov @ DumpAnalysis.org + TraceAnalysis.org -
Posted in .NET Debugging, Aesthetics of Memory Dumps, Announcements, AntiPatterns, Art, Assembly Language, Books, C and C++, CDA Pattern Classification, CDF Analysis Tips and Tricks, Categorical Debugging, Certification, Citrix, Code Reading, Common Mistakes, Computer Science, Countefactual Debugging, Crash Analysis Report Environment (CARE), Crash Dump Analysis, Crash Dump Patterns, Crash Dumps for Dummies, DebugWare Patterns, Debugging, Debugging Slang, Education and Research, Escalation Engineering, Fun with Crash Dumps, Games for Debugging, Hardware, Horrors of Computation, Hyper-V, Kernel Development, Laws of Troubleshooting and Debugging, Mathematics of Debugging, Memiotics (Memory Semiotics), Memoidealism, Memoretics, Memory Analysis Culture, Memory Analysis Forensics and Intelligence, Memory Dreams, Memory Dump Analysis Jobs, Memory Dumps in Movies, Memory Space Art, Memory Visualization, Memuonics, Minidump Analysis, Multithreading, Music for Debugging, New Acronyms, New Words, Opcodism, Philosophy, Physicalist Art, Publishing, Science Fiction, Science of Memory Dump Analysis, Science of Software Tracing, Security, Software Architecture, Software Defect Construction, Software Engineering, Software Generalist, Software Maintenance Institute, Software Narratology, Software Technical Support, Software Trace Analysis, Software Trace Visualization, Software Tracing for Dummies, Software Victimology, Stack Trace Collection, Testing, Tools, Trace Analysis Patterns, Training and Seminars, Troubleshooting Methodology, Victimware, Virtualization, Vista, Visual Dump Analysis, WinDbg Scripts, WinDbg Tips and Tricks, WinDbg for GDB Users, Windows 7, Windows Server 2008, Windows System Administration, Workaround Patterns | No Comments »
Sunday, December 20th, 2009
“Memory dumps are facts.”
I’m very excited to announce that Volume 3 is available in paperback, hardcover and digital editions:
Memory Dump Analysis Anthology, Volume 3
Table of Contents
In two weeks paperback edition should also appear on Amazon and other bookstores. Amazon hardcover edition is planned to be available in January 2010.
The amount of information was so voluminous that I had to split the originally planned volume into two. Volume 4 should appear by the middle of February together with Color Supplement for Volumes 1-4.
- Dmitry Vostokov @ DumpAnalysis.org -
Posted in .NET Debugging, Aesthetics of Memory Dumps, Announcements, AntiPatterns, Art, Assembly Language, Books, Bugtations, C and C++, CDA Pattern Classification, CDF Analysis Tips and Tricks, Certification, Citrix, Code Reading, Common Mistakes, Computer Science, Crash Dump Analysis, Crash Dump Patterns, Crash Dumps for Dummies, DebugWare Patterns, Debugging, Debugging Slang, Deep Down C++, Education and Research, Escalation Engineering, Fun with Crash Dumps, Hardware, Horrors of Computation, Kernel Development, Mathematics of Debugging, Memiotics (Memory Semiotics), Memoidealism, Memoretics, Memory Analysis Culture, Memory Analysis Forensics and Intelligence, Memory Space Art, Memory Visualization, Minidump Analysis, Multithreading, Philosophy, Poetry, Publishing, Science of Memory Dump Analysis, Science of Software Tracing, Security, Software Architecture, Software Defect Construction, Software Engineering, Software Narratology, Software Technical Support, Software Trace Analysis, Software Trace Visualization, Software Tracing for Dummies, Software Victimology, Stack Trace Collection, Testing, Tools, Trace Analysis Patterns, Training and Seminars, Troubleshooting Methodology, Victimware, Virtualization, Vista, Visual Dump Analysis, WinDbg Scripts, WinDbg Tips and Tricks, WinDbg for GDB Users, Windows 7, Windows Server 2008, Windows System Administration | 1 Comment »
Saturday, September 26th, 2009
This is a revised, edited, cross-referenced and thematically organized volume of selected DumpAnalysis.org blog posts about crash dump analysis and debugging written in October 2008 - June 2009 for software engineers developing and maintaining products on Windows platforms, quality assurance engineers testing software on Windows platforms and technical support and escalation engineers dealing with complex software issues. The third volume features:
- 15 new crash dump analysis patterns
- 29 new pattern interaction case studies
- Trace analysis patterns
- Updated checklist
- Fully cross-referenced with Volume 1 and Volume 2
- New appendixes
Product information:
- Title: Memory Dump Analysis Anthology, Volume 3
- Author: Dmitry Vostokov
- Language: English
- Product Dimensions: 22.86 x 15.24
- Paperback: 404 pages
- Publisher: Opentask (20 December 2009)
- ISBN-13: 978-1-906717-43-8
- Hardcover: 404 pages
- Publisher: Opentask (30 January 2010)
- ISBN-13: 978-1-906717-44-5

Back cover features 3D computer memory visualization image.
- Dmitry Vostokov @ DumpAnalysis.org -
Posted in Announcements, AntiPatterns, Art, Assembly Language, Books, C and C++, CDF Analysis Tips and Tricks, Certification, Citrix, Code Reading, Common Mistakes, Computational Ghosts and Bug Hauntings, Computer Science, Countefactual Debugging, Crash Dump Analysis, Crash Dump Patterns, Crash Dumps for Dummies, DebugWare Patterns, Debugging, Debugging Slang, Deep Down C++, Education and Research, Escalation Engineering, Fun with Crash Dumps, Futuristic Memory Dump Analysis, Games for Debugging, Hardware, Horrors of Computation, Hyper-V, Intelligent Memory Movement, Kernel Development, Mathematics of Debugging, Memiotics (Memory Semiotics), Memoidealism, Memoretics, Memory Analysis Culture, Memory Analysis Forensics and Intelligence, Memory Dreams, Memory Dump Analysis Jobs, Memory Space Music, Memory Visualization, Memuonics, Minidump Analysis, Multithreading, Music for Debugging, New Acronyms, New Words, Occult Debugging, Philosophy, Poetry, Psi-computation, Publishing, Science of Memory Dump Analysis, Science of Software Tracing, Security, Software Architecture, Software Defect Construction, Software Engineering, Software Generalist, Software Narratology, Software Technical Support, Software Trace Analysis, Software Tracing for Dummies, Testing, Tools, Trace Analysis Patterns, Training and Seminars, Troubleshooting Methodology, Virtualization, Vista, Visual Dump Analysis, WinDbg Scripts, WinDbg Tips and Tricks, WinDbg for GDB Users, Windows 7, Windows Server 2008, Windows System Administration | No Comments »
Tuesday, May 12th, 2009
Previously announced memory dump analysis certification will have x86/x64-based tracks for Windows and Unix (including Linux / FreeBSD / Mac OS X). Each track consists of 3 exams, each having its own set of requirements and scope:
- Fundamentals of Memory Dump Analysis
- Intermediate Memory Dump Analysis
- Advanced Memory Dump Analysis
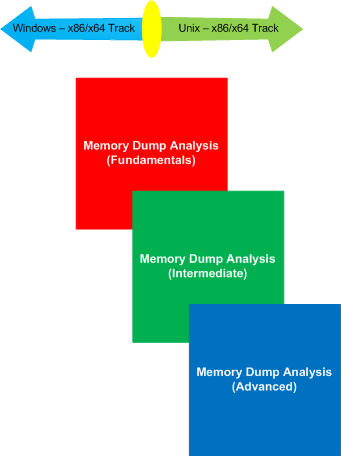
More information will be available later. The initiative is supported by OpenTask.
- Dmitry Vostokov @ DumpAnalysis.org -
Posted in Announcements, Certification, Crash Dump Analysis, Crash Dump Patterns, Debugging, Education and Research, Memory Dump Analysis Jobs, Minidump Analysis, Software Technical Support, Training and Seminars, WinDbg Tips and Tricks, WinDbg for GDB Users, Windows System Administration | No Comments »
Friday, April 24th, 2009
I finally read this book from cover to cover and I must say it is the very sound book and presents a consistent approach to debugging real-life problems with user-land C and C++ code on Linux environments.
The Developer’s Guide to Debugging

Although it uses mainly GDB for illustrations and provides Visual C++ equivalents when possible it doesn’t cover Debugging Tools for Windows and its main GUI debugger, WinDbg. To rectify this I created extensive notes while reading.
Additional reader audience for this book might include a Windows engineer who needs to debug software on Linux or FreeBSD so a quick GDB crash course is needed. It would also serve as an excellent debugging course or as a supplemental course to any C or C++ course. Highly recommended if you are a Linux C/C++ software engineer. Even if you are an experienced one, you will find something new or make your debugging more consistent. If you need to teach or mentor juniors, this book helps too.
- Dmitry Vostokov @ DumpAnalysis.org -
Posted in Books, Debugging, GDB for WinDbg Users, WinDbg for GDB Users | No Comments »
Monday, February 2nd, 2009
I very proud to announce that after 3 weeks of final work the book has been released in both paperback and PDF format. In a week or so it should also appear on Amazon and other booksellers around the world. The book information and how to buy it can be found on the portal:
Windows Debugging: Practical Foundations
- Dmitry Vostokov @ DumpAnalysis.org -
Posted in Announcements, Assembly Language, Books, Crash Dump Analysis, Crash Dumps for Dummies, Debugging, Education and Research, Memory Dump Analysis Jobs, Publishing, Software Technical Support, Testing, Tools, Training and Seminars, WinDbg Tips and Tricks, WinDbg for GDB Users | No Comments »
Thursday, January 29th, 2009
Draft Table of Contents is available for the forthcoming Windows Debugging: Practical Foundations book to be released next week:
Draft Table of Contents
- Dmitry Vostokov @ DumpAnalysis.org -
Posted in Announcements, Assembly Language, Books, Crash Dump Analysis, Debugging, Memory Dump Analysis Jobs, Publishing, Software Technical Support, Testing, Training and Seminars, WinDbg for GDB Users | No Comments »
Wednesday, December 24th, 2008
The analogy between learning a complex tool with its own language and a foreign natural language has been developed further after the release of WinDbg Learning Cards and finally culminated in “WinDbg In Use” book series with the first book to be published during the 1st quarter of 2009:
- Title: WinDbg In Use: Debugging Exercises (Elementary and Intermediate Level)
- Author: Dmitry Vostokov
- Publisher: Opentask (15 March 2009)
- Language: English
- Product Dimensions: 23.5 x 19.1
- ISBN-13: 978-1-906717-50-6
- Paperback: 200 pages
- Book Annotation: Includes 60 programmed exercises from real life debugging and crash dump analysis scenarios and multiple-choice questions with full answers, comments and suggestions for further reading.
Some example exercises will be published on this blog from time to time. I also plan a corresponding column in the forthcoming Debugged! magazine.
- Dmitry Vostokov @ DumpAnalysis.org -
Posted in Announcements, Assembly Language, Books, Common Mistakes, Crash Dump Analysis, Crash Dump Patterns, Debugging, Education and Research, English Language, Memory Dump Analysis Jobs, Minidump Analysis, Publishing, Security, Software Technical Support, Testing, Tools, Training and Seminars, WinDbg Scripts, WinDbg Tips and Tricks, WinDbg for GDB Users | No Comments »
Friday, November 28th, 2008
Due to some technical difficulties the release of WinDbg: A Reference Poster and Learning Cards has been delayed by 2 weeks. Now I got a proof copy and approved the book distribution on Amazon, B&N and other bookshops worldwide. Hope you will enjoy it and find it useful.
The similar book for GDB will be announced soon.
- Dmitry Vostokov @ DumpAnalysis.org -
Posted in Announcements, Books, Crash Dump Analysis, Crash Dump Patterns, Debugging, Publishing, Software Technical Support, Tools, WinDbg Tips and Tricks, WinDbg for GDB Users | No Comments »
Tuesday, November 25th, 2008
As one of the new initiatives for the Year of Debugging DumpAnalysis Portal will publish bimonthly full color 16 page publication called:
Debugged! MZ/PE: MagaZine for/from Practicing Engineers
The only serial publication dedicated entirely to Windows® debugging
The first issue is planned for March, 2009 and will have ISBN-13: 978-1-906717-38-4. If it goes well I’m planning to have ISSN number assigned to it too. More details will be announced soon.
- Dmitry Vostokov @ DumpAnalysis.org -
Posted in Announcements, Assembly Language, Books, Bugchecks Depicted, CDA Pattern Classification, Citrix, Common Mistakes, Crash Dump Analysis, Crash Dump Patterns, Crash Dumps for Dummies, Data Recovery, Debugged! MZ/PE, Debugging, IDA for WinDbg Users, Kernel Development, Memory Analysis Forensics and Intelligence, Memory Visualization, Minidump Analysis, Philosophy, Publishing, Security, Software Technical Support, Testing, Tools, Training and Seminars, Troubleshooting Methodology, Vista, WinDbg Scripts, WinDbg Tips and Tricks, WinDbg for GDB Users, Windows Server 2008 | 4 Comments »
Monday, November 10th, 2008
Suddenly the course of my publishing activities bended a little to produce a DIY poster and learning cards to be published soon. Here are the product details:
Annotation:
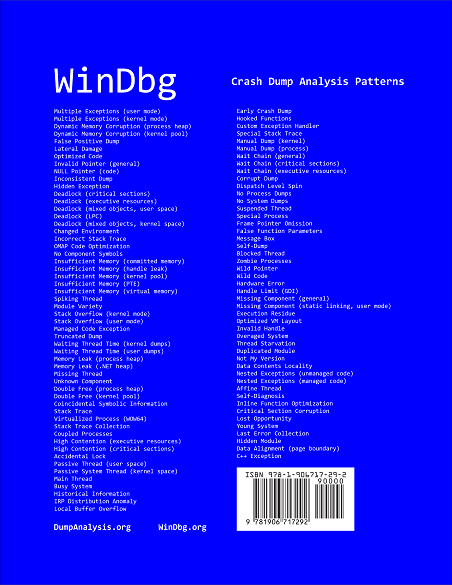
WinDbg is a powerful debugger from Microsoft Debugging Tools for Windows. It has more than 350 commands that can be used in different debugging scenarios. The cover of this book is a poster featuring crash dump analysis checklist and common patterns seen in memory dumps and live debugging sessions. Inside the book you can find ready to cut learning cards with commands and their descriptions coloured according to their use for crash dump or live debugging sessions and user, kernel or complete memory dumps. Tossing cards can create unexpected connections between commands and help to learn them more quickly. Uncut pages can also serve as birds eye view to WinDbg debugging capabilities. More than 350 WinDbg commands including meta-commands and extensions are included.
- Title: WinDbg: A Reference Poster and Learning Cards
- Authors: Dmitry Vostokov
- Publisher: Opentask (20 November 2008)
- Language: English
- Product Dimensions: 28.0 x 21.6
- ISBN-13: 978-1-906717-29-2
- Paperback: 20 pages
Book Excerpt
Front cover:
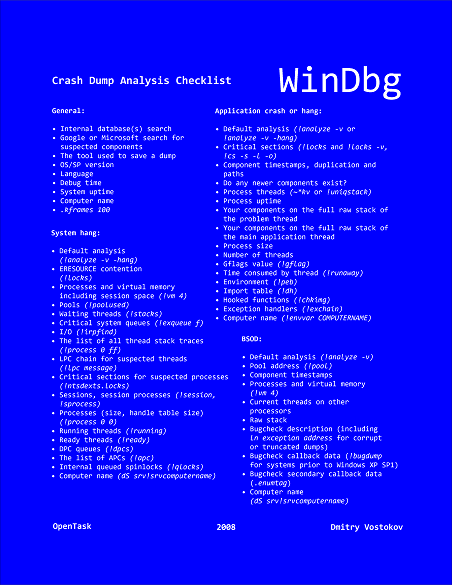
Back cover:
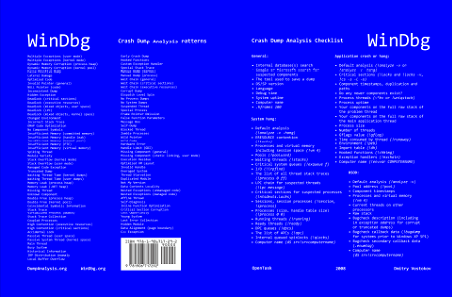
After you take inside pages out you are left with a cover that you can use as a crash dump analysis checklist and patterns poster:
I also plan to update this book on a yearly basis.
- Dmitry Vostokov @ DumpAnalysis.org -
Posted in Announcements, Books, Crash Dump Analysis, Crash Dump Patterns, Debugging, Publishing, Software Technical Support, Tools, Training and Seminars, WinDbg Scripts, WinDbg Tips and Tricks, WinDbg for GDB Users | 3 Comments »
Saturday, October 18th, 2008
Paperback edition of Memory Dump Analysis Anthology, Volume 2 is finally available on Amazon and Barnes & Noble. Search Inside is also available on Amazon. In addition, I updated the list of recommended books:
Listmania! Crash Dump Analysis and Debugging
Hardcover edition will be available on Amazon and B&N in 2-3 weeks.
- Dmitry Vostokov @ DumpAnalysis.org -
Posted in Announcements, Assembly Language, Books, Bugchecks Depicted, CDF Analysis Tips and Tricks, Certification, Citrix, Common Mistakes, Crash Dump Analysis, Crash Dump Patterns, Crash Dumps for Dummies, Data Recovery, DebugWare Patterns, Debugging, Fun with Crash Dumps, Hardware, Kernel Development, Memory Analysis Forensics and Intelligence, Memory Dump Analysis Jobs, Memory Visualization, Minidump Analysis, Music for Debugging, New Words, Philosophy, Publishing, Science of Memory Dump Analysis, Security, Software Architecture, Software Technical Support, Stack Trace Collection, Testing, Tools, Training and Seminars, Troubleshooting Methodology, Virtualization, Vista, WinDbg Scripts, WinDbg Tips and Tricks, WinDbg for GDB Users, Windows Server 2008 | No Comments »
Friday, October 3rd, 2008
“Everything is memory dump.”
I’m very excited to announce that Volume 2 is available in paperback, hardcover and digital editions:
Memory Dump Analysis Anthology, Volume 2
In one or two weeks paperback edition should also appear on Amazon and other bookstores. Amazon hardcover edition is planned to be available by the end of October.
I’m often asked when Volume 3 is available and I currently plan to release it in October - November, 2009. In the mean time I’m planning to concentrate on other publishing projects.
- Dmitry Vostokov @ DumpAnalysis.org -
Posted in Announcements, Assembly Language, Books, Bugchecks Depicted, CDF Analysis Tips and Tricks, Citrix, Common Mistakes, Crash Dump Analysis, Crash Dump Patterns, Crash Dumps for Dummies, Data Recovery, DebugWare Patterns, Debugging, Fun with Crash Dumps, Kernel Development, Memory Analysis Forensics and Intelligence, Memory Dump Analysis Jobs, Memory Visualization, Minidump Analysis, Music for Debugging, New Words, Philosophy, Publishing, Science of Memory Dump Analysis, Security, Software Architecture, Software Technical Support, Stack Trace Collection, Testing, Tools, Training and Seminars, Troubleshooting Methodology, Virtualization, Vista, WinDbg Scripts, WinDbg Tips and Tricks, WinDbg for GDB Users, Windows Server 2008 | No Comments »