Crash Dump Analysis Patterns (Part 288)
Friday, February 23rd, 2024Modern x64 Windows targets may support hardware shadow stacks. In such a case, WinDbg shows this message even if you open a memory dump on computers that do not support it:
This target supports Hardware-enforced Stack Protection. A HW based

"Shadow Stack" may be available to assist in debugging and analysis.

See aka.ms/userhsp for more info.

dps @ssp
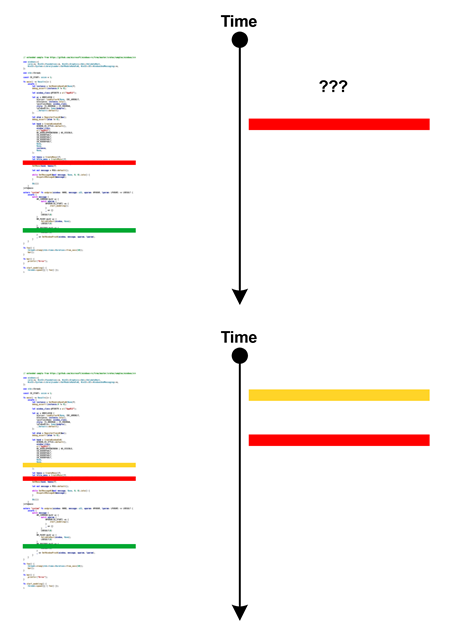
The data from shadow stacks may be useful in case of Local Buffer Overflow. In such a case, we can compare the problem Stack Trace with the Shadow Stack Trace that was supposed to be without the stack region corruption.
For example, if see this exception and Incorrect Stack Trace, we can see that the stack trace should have been if the the return address were not modified:
This dump file has an exception of interest stored in it.

The stored exception information can be accessed via .ecxr.

(5a34.4bb8): Security check failure or stack buffer overrun - code c0000409 (first/second chance not available)

Subcode: 0×39 FAST_FAIL_CONTROL_INVALID_RETURN_ADDRESS Shadow stack violation
0:000> k

# Child-SP          RetAddr               Call Site

00 000000fa`b94ffdf8 000002aa`5d420588     user32!GetMessageW+0×5c

01 000000fa`b94ffe00 000002aa`5d420588     0×000002aa`5d420588

02 000000fa`b94ffe08 00000000`00000000     0×000002aa`5d420588
0:000> r

rax=0000000000000001 rbx=000002aa5d420588 rcx=00007ff9c3d31534

rdx=0000000000000000 rsi=0000000000000000 rdi=000002aa5d420530

rip=00007ff9c3ea538c rsp=000000fab94ffdf8 rbp=000002aa5d420588

r8=000000fab94ffd98  r9=0000000000000000 r10=0000000000000000

r11=0000000000000244 r12=00007ff66b204070 r13=0000000000000000

r14=0000000000000001 r15=00000000ffffffff

iopl=0         nv up ei pl nz na po nc

cs=0033  ss=002b  ds=002b  es=002b  fs=0053  gs=002b             efl=00010206

user32!GetMessageW+0x5c:

00007ff9`c3ea538c ret
0:000> dps @rsp L1

000000fa`b94ffdf8  000002aa`5d420588
0:000> dps @ssp

000000fa`b95fefd0  00007ff9`4ae2f877 mfc140u!AfxInternalPumpMessage+0x27

000000fa`b95fefd8  00007ff9`4ae301b1 mfc140u!CWinThread::Run+0x81

000000fa`b95fefe0  00007ff9`4ae63230 mfc140u!AfxWinMain+0xc0

000000fa`b95fefe8  00007ff6`6b135742 mspaint+0xc5742

000000fa`b95feff0  00007ff9`c500257d kernel32!BaseThreadInitThunk+0x1d

000000fa`b95feff8  00007ff9`c618aa58 ntdll!RtlUserThreadStart+0x28

000000fa`b95ff000  ????????`????????

000000fa`b95ff008  ????????`????????

000000fa`b95ff010  ????????`????????

000000fa`b95ff018  ????????`????????

000000fa`b95ff020  ????????`????????

000000fa`b95ff028  ????????`????????

000000fa`b95ff030  ????????`????????

000000fa`b95ff038  ????????`????????

000000fa`b95ff040  ????????`????????

000000fa`b95ff048  ????????`????????
- Dmitry Vostokov @ DumpAnalysis.org + TraceAnalysis.org -