Happy St. Patrick’s Screen
Sunday, March 17th, 2013
- Dmitry Vostokov @ DumpAnalysis.org + TraceAnalysis.org -
- Dmitry Vostokov @ DumpAnalysis.org + TraceAnalysis.org -
- Dmitry Vostokov @ DumpAnalysis.org + TraceAnalysis.org -
- Dmitry Vostokov @ DumpAnalysis.org + TraceAnalysis.org -
I don’t know how I missed it. It was the first real life slang I heard almost 10 years ago during hot political and critical crash dump analysis session.
DD That - Analyze that simply.
Although more correctly would be to say DP That at that time when I heard it 64-bit computing wasn’t a mainstream yet. Based on dd WinDbg command to dump raw binary data starting from a given 32-bit memory address.
Examples: I dd-ed that and found an ASCII.
- Dmitry Vostokov @ DumpAnalysis.org + TraceAnalysis.org -
STATUS - Something important to check for just now.
Examples: If only programmers checked statuses of their functions more often than statuses on Facebook…
- Dmitry Vostokov @ DumpAnalysis.org + TraceAnalysis.org -
- Dmitry Vostokov @ DumpAnalysis.org + TraceAnalysis.org -
I was analyzing a raw thread stack when came upon this symbolic address which I thought was coincidental:
363b0030 77777777 advapi32!LsaEnumerateAccountRights+0×56
Forward disasssembly makes sense, isn’t it? And every instruction seems have a purpose ![]()
0:000> u 77777777

advapi32!LsaEnumerateAccountRights+0×56:

77777777 a4              movs    byte ptr es:[edi],byte ptr [esi]

77777778 fc              cld

77777779 ffc3            inc     ebx

7777777b 8b65e8          mov     esp,dword ptr [ebp-18h]

7777777e ff75e0          push    dword ptr [ebp-20h]

77777781 ff15e4187377    call    dword ptr [advapi32!_imp__I_RpcMapWin32Status (777318e4)]

77777787 50              push    eax

77777788 e8c6f6fbff      call    advapi32!LsapApiReturnResult (77736e53)
- Dmitry Vostokov @ DumpAnalysis.org + TraceAnalysis.org -
Influenced by stages of Husserlian phenomenological investigation I propose the following stages for the investigation of phenomena as it appears in software execution artifacts such as memory dumps, traces and logs:
1. Bracketing the outside source code as reduction to patterns of phenomena independent from causal software engineering explanations.
2. Constructing the computational world for the given incident (the so called horizon of computation).
3. Comparing with “computed-in” experience of past computational worlds from which all universal patterns of computational structural and behavioral phenomena emerged.
PS. According to the above software diagnostics is a phenomenological science of patterns. Most probably this sketch will be revised soon. In the mean time here’s a funny coincidence. The first step in a phenomenological method is the so called epoché. I provide my own interpretation of this - “exception processing of crash” hypothetical episteme. Similar to EPOCH metaphysical grand conjecture that our World is just one enormous exception processing handler after Big Bang.
- Dmitry Vostokov @ DumpAnalysis.org + TraceAnalysis.org -
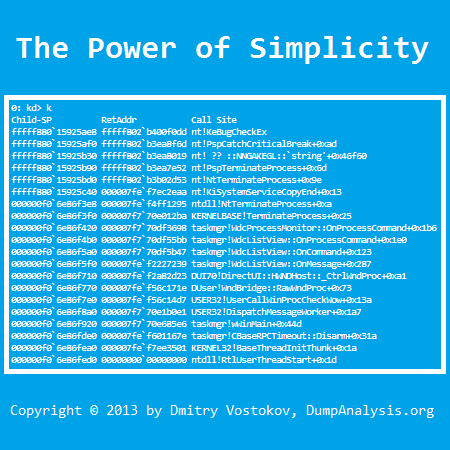
Software diagnosis requires intelligence.
- Dmitry Vostokov @ DumpAnalysis.org + TraceAnalysis.org -
FBI - Fighting Bugs Inside.
Examples: I’m doing an FBI work now!
- Dmitry Vostokov @ DumpAnalysis.org + TraceAnalysis.org -
poo - a function that follows foo and bar with a purpose to trigger a crash event, a breakpoint or save memory state.
Examples: void main() { foo(); } void foo() { poo(); } void poo() { asm int 3; }
- Dmitry Vostokov @ DumpAnalysis.org + TraceAnalysis.org -
STaMPs - Software Trace and Memory Patterns. Stack Trace and Memory Patterns.
Examples: Got a few visible stamps on this trace. And more stamps on that crash dump.
- Dmitry Vostokov @ DumpAnalysis.org + TraceAnalysis.org -
Memorandum - when memory ran dump.
Examples: We got a few memorandums from that market leader.
- Dmitry Vostokov @ DumpAnalysis.org + TraceAnalysis.org -
; Composed a verse for today
Labour Day
First of May
Analyze
Today
; Plan to analyze from 32 to 64 dumps
- Dmitry Vostokov @ DumpAnalysis.org + TraceAnalysis.org -
After 4 years in print this bestselling title needs an update to address minor changes, include extra examples and reference additional research published in Volumes 2, 3, 4, 5 and 6.
The cover for both paperback and hardcover titles will also have a matte finish. We used A Memory Window artwork for the back cover.

- Dmitry Vostokov @ DumpAnalysis.org + TraceAnalysis.org -
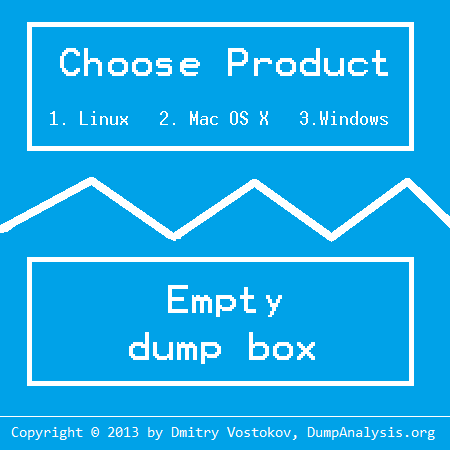
Always imitate the behavior of the working program when it is crashing.
- Dmitry Vostokov @ DumpAnalysis.org + TraceAnalysis.org -
- Dmitry Vostokov @ DumpAnalysis.org + TraceAnalysis.org -
This is both a game and serious philosophical and religious tool to guide your life. Basically you need either 32 coin flips to construct a 32-bit pointer (or 64 flips for wide coverage) or 16 flips using a dice where each throw can generate at least 2 bits. Any device can help if you can get a random pointer. Then you use your favourite memory dump and symbol files for interpretation. Double, triple and multiple dereferences from a pointer can also be used to construe a path.
For example, I just played and got:
0:000> ? 0y10010111111000100100011011100111

Evaluate expression: -1746778393 = 97e246e7
0:000> !address 97e246e7

Address 97e246e7 could not be mapped in any available regions
If address is inaccessible switch to another memory dump or continue flips and shift digits to the left. This way I got:
0:000> ? 0y00101111110001001000110111001111

Evaluate expression: 801410511 = 2fc48dcf
0:000> !address 02fc48dcf

Usage:                  Free

Base Address:           1f858000

End Address:            58c30000

Region Size:            393d8000

Type:                   00000000

State:                  00010000 MEM_FREE

Protect:                00000001 PAGE_NOACCESS
Continue flip and shift until you get an output with symbol signs:
0:000> ? 0y01011111100010010001101110011110

Evaluate expression: 1602821022 = 5f891b9e
0:000> dp 5F891B9E

5f891b9e  ???????? ???????? ???????? ????????

5f891bae  ???????? ???????? ???????? ????????

5f891bbe  ???????? ???????? ???????? ????????

5f891bce  ???????? ???????? ???????? ????????

5f891bde  ???????? ???????? ???????? ????????

5f891bee  ???????? ???????? ???????? ????????

5f891bfe  ???????? ???????? ???????? ????????

5f891c0e  ???????? ???????? ???????? ????????
0:000> !address 5F891B9E

Usage:                  Free

Base Address:           5eb8a000

End Address:            60080000

Region Size:            014f6000

Type:                   00000000

State:                  00010000 MEM_FREE

Protect:                00000001 PAGE_NOACCESS
Unloaded modules that overlapped the region in the past:

BaseAddr EndAddr    Size

5ebc0000 5ebcd000     d000 Perfctrs.dll
Dump output for thought: “In the past - perfect control, performance was counted, now - free.”
- Dmitry Vostokov @ DumpAnalysis.org + TraceAnalysis.org -
The following watch came to my attention when I saw an ad at Zurich airport last week:
Tissot Seastar Blue Dial Mens Watch T0664071104700
Good complement to a digital one I have: Teaching binary to decimal conversion.
- Dmitry Vostokov @ DumpAnalysis.org + TraceAnalysis.org -
Watching a Movie - Watching the prodigious output of some debugging commands and scripts in real time.
Examples: Watching the output of !process 0 ff WinDbg command. Watching the output of user stack trace database and breaking in when it becomes uniform.
- Dmitry Vostokov @ DumpAnalysis.org + TraceAnalysis.org -
