Archive for the ‘Psi-computation’ Category
Friday, July 16th, 2010
Computer software is said to be simple and predictable as any mechanism (*). We can debug it, we can completely trace what it is doing. It seems rational to us. Let’s then label it as Conscious. On the outside there is an irrational human being who did program that software. Let’s then label that person’s mind as Unconscious. What about hardware and body? They form parts of HCI (Human-Computer Interaction or Interface).
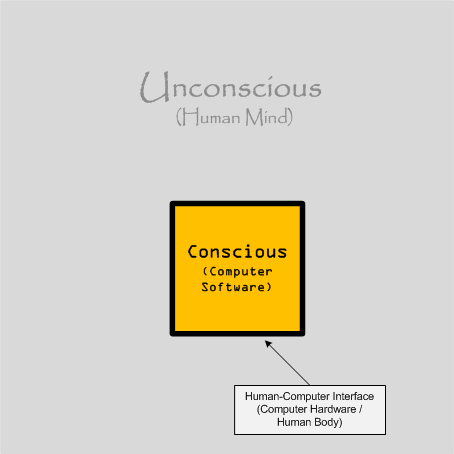
(*) Is there any life inside Windows?
- Dmitry Vostokov @ DumpAnalysis.org + TraceAnalysis.org -
Posted in Fun with Debugging, Philosophy, Psi-computation, Psychoanalysis of Software Maintenance and Support, Psychology | No Comments »
Sunday, April 18th, 2010
OpenTask to offer first 3 volumes of Memory Dump Analysis Anthology in one set:


The set is available exclusively from OpenTask e-Commerce web site starting from June. Individual volumes are also available from Amazon, Barnes & Noble and other bookstores worldwide.
Product information:
- Title: Modern Memory Dump and Software Trace Analysis: Volumes 1-3
- Author: Dmitry Vostokov
- Language: English
- Product Dimensions: 22.86 x 15.24
- Paperback: 1600 pages
- Publisher: Opentask (31 May 2010)
- ISBN-13: 978-1-906717-99-5
Information about individual volumes:
- Dmitry Vostokov @ DumpAnalysis.org + TraceAnalysis.org -
Posted in .NET Debugging, Aesthetics of Memory Dumps, Announcements, AntiPatterns, Art, Assembly Language, Books, Bugchecks Depicted, C and C++, CDA Pattern Classification, CDF Analysis Tips and Tricks, Categorical Debugging, Certification, Citrix, Code Reading, Common Mistakes, Computational Ghosts and Bug Hauntings, Computer Science, Countefactual Debugging, Crash Analysis Report Environment (CARE), Crash Dump Analysis, Crash Dump Patterns, Crash Dumps for Dummies, Data Recovery, DebugWare Patterns, Debugging, Debugging Methodology, Debugging Slang, Deep Down C++, Dictionary of Debugging, Dr. Watson, Education and Research, Escalation Engineering, Fun with Crash Dumps, Futuristic Memory Dump Analysis, GDB for WinDbg Users, Hardware, History, Horrors of Computation, Hyper-V, Intelligent Memory Movement, Kernel Development, Laws of Troubleshooting and Debugging, Mathematics of Debugging, Memiotics (Memory Semiotics), Memoidealism, Memoretics, Memory Analysis Culture, Memory Analysis Forensics and Intelligence, Memory Auralization, Memory Dump Analysis Jobs, Memory Religion (Memorianity), Memory Space Art, Memory Space Music, Memory Systems Language, Memory Visualization, Memuonics, Minidump Analysis, Multithreading, Music for Debugging, Music of Computation, New Acronyms, New Words, Occult Debugging, Philosophy, Psi-computation, Publishing, Science of Memory Dump Analysis, Science of Software Tracing, Security, Software Architecture, Software Defect Construction, Software Engineering, Software Generalist, Software Maintenance Institute, Software Narratology, Software Technical Support, Software Trace Analysis, Software Trace Visualization, Software Tracing for Dummies, Software Victimology, Stack Trace Collection, Testing, Tools, Trace Analysis Patterns, Training and Seminars, Troubleshooting Methodology, Victimware, Virtualization, Vista, Visual Dump Analysis, WinDbg Scripts, WinDbg Tips and Tricks, WinDbg for GDB Users, Windows 7, Windows Server 2008, Windows System Administration | No Comments »
Saturday, September 26th, 2009
This is a revised, edited, cross-referenced and thematically organized volume of selected DumpAnalysis.org blog posts about crash dump analysis and debugging written in October 2008 - June 2009 for software engineers developing and maintaining products on Windows platforms, quality assurance engineers testing software on Windows platforms and technical support and escalation engineers dealing with complex software issues. The third volume features:
- 15 new crash dump analysis patterns
- 29 new pattern interaction case studies
- Trace analysis patterns
- Updated checklist
- Fully cross-referenced with Volume 1 and Volume 2
- New appendixes
Product information:
- Title: Memory Dump Analysis Anthology, Volume 3
- Author: Dmitry Vostokov
- Language: English
- Product Dimensions: 22.86 x 15.24
- Paperback: 404 pages
- Publisher: Opentask (20 December 2009)
- ISBN-13: 978-1-906717-43-8
- Hardcover: 404 pages
- Publisher: Opentask (30 January 2010)
- ISBN-13: 978-1-906717-44-5

Back cover features 3D computer memory visualization image.
- Dmitry Vostokov @ DumpAnalysis.org -
Posted in Announcements, AntiPatterns, Art, Assembly Language, Books, C and C++, CDF Analysis Tips and Tricks, Certification, Citrix, Code Reading, Common Mistakes, Computational Ghosts and Bug Hauntings, Computer Science, Countefactual Debugging, Crash Dump Analysis, Crash Dump Patterns, Crash Dumps for Dummies, DebugWare Patterns, Debugging, Debugging Slang, Deep Down C++, Education and Research, Escalation Engineering, Fun with Crash Dumps, Futuristic Memory Dump Analysis, Games for Debugging, Hardware, Horrors of Computation, Hyper-V, Intelligent Memory Movement, Kernel Development, Mathematics of Debugging, Memiotics (Memory Semiotics), Memoidealism, Memoretics, Memory Analysis Culture, Memory Analysis Forensics and Intelligence, Memory Dreams, Memory Dump Analysis Jobs, Memory Space Music, Memory Visualization, Memuonics, Minidump Analysis, Multithreading, Music for Debugging, New Acronyms, New Words, Occult Debugging, Philosophy, Poetry, Psi-computation, Publishing, Science of Memory Dump Analysis, Science of Software Tracing, Security, Software Architecture, Software Defect Construction, Software Engineering, Software Generalist, Software Narratology, Software Technical Support, Software Trace Analysis, Software Tracing for Dummies, Testing, Tools, Trace Analysis Patterns, Training and Seminars, Troubleshooting Methodology, Virtualization, Vista, Visual Dump Analysis, WinDbg Scripts, WinDbg Tips and Tricks, WinDbg for GDB Users, Windows 7, Windows Server 2008, Windows System Administration | No Comments »
Wednesday, September 2nd, 2009
Dao De Jing bugging
Bang the Debugger, explains his extraordinary skill in debugging:
“The Thread is the Way, the flow I follow. When I started I could only use !analyze -v command. After 4 years I could see through memory bits without lenses of a debugger program because Dao is beyond computer understanding and more than technical skills.”
Based on the famous story from Ding the Butcher.
- Dmitry Vostokov @ DumpAnalysis.org -
Posted in Bugtations, Crash Dump Analysis, Debugging, Fun with Crash Dumps, Psi-computation | No Comments »
Thursday, August 6th, 2009
The hierarchy of Ψ1, …, Ψ8, …, Ψ16, …, Ψ32, …, Ψ64, …, …, …, ΨΨ numbers where the subscript denotes the number of bits a memory address can have, so Ψ32 and Ψ64 are memorillion and quadrimemorillion of memory dumps respectively. We only need to figure out the meaning of Ψ0 and ΨΨ. Perhaps there is some meaning in Dirac notation here: <Ψ0|ΨΨ>. More on this later because I have to finish this week the book x64 Windows Debugging: Practical Foundations and write an errata file for the previous x86 version of the book series.
Note: Ψ is an M upside down.
- Dmitry Vostokov @ DumpAnalysis.org -
Posted in Crash Dump Analysis, Crash Dump Patterns, Fun with Crash Dumps, Futuristic Memory Dump Analysis, Intelligent Memory Movement, Psi-computation, Science of Memory Dump Analysis | No Comments »
Tuesday, June 9th, 2009
The Adelphi Training Center in Dublin, Ireland, is haunted by the ghost of pre-Internet epoch. During one debugging night, when installing a secret service, Drilliam Traceless was murdered by a redundant engineer who was envy to his charisma. He stubbed him in the back while Drilliam was unlocking his mini-computer case. He died whispering: “I’ll be back debugging”. His face sometimes appears on greenish screensavers running on computers located in that center. During morning training sessions, many trainees think this is a kind of the so called Guinness effect.
The story is adapted from The Ghost of Adelphi Theatre.
- Dmitry Vostokov @ DumpAnalysis.org -
Posted in Computational Ghosts and Bug Hauntings, Debugging, Fun with Crash Dumps, Psi-computation | No Comments »
Friday, May 22nd, 2009
This is a computational ghost that comes from CPU spiking tops and hills to bring sickness to small programs. Red color from RGB triplets provides early warning signs.
Inspired by non-computational Acheri.
PS. This category of computational ghosts and bug hauntings was also inspired by an e-mail conversation between two software engineers that I witnessed some years ago when one told another: “Is this your fix that is still haunting us?”. If you have ever visited heated code review debates you can imagine the provoked response.
- Dmitry Vostokov @ DumpAnalysis.org -
Posted in Computational Ghosts and Bug Hauntings, Fun with Crash Dumps, Psi-computation | No Comments »
Monday, December 15th, 2008
Once upon a time I was analyzing a memory dump and in the process become upset. I realized that the dump was vacuous and afterwards learnt that the customer forced the dump of a normal system with steady-state computational activities inside. At the same time computational precognition, the ability to see in advance what would happen with the system, always fascinated me from the very beginning of my memory dump analysis work. In computational precognition phrase, the word “computational” refers to computers and “precognition” refers to humans but this should not be the problem as the boundary between these two categories is not sharp and can be shifted in either direction. This is an opening of the new post series about investigation of occult, paranormal and supernatural in the realm of computable. In short, about psi-computation.
- Dmitry Vostokov @ DumpAnalysis.org -
Posted in Fun with Crash Dumps, New Words, Occult Debugging, Psi-computation | No Comments »