Archive for the ‘Hardware’ Category
Tuesday, January 29th, 2013
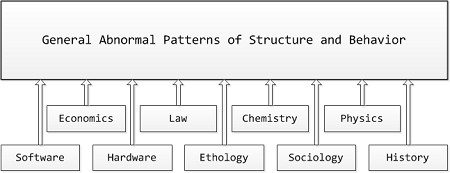
Memory Analysis Patterns (MAPs) including memory dump, malware, software trace (TAPs), and other patterns and pattern catalogs from Software Diagnostics Institute form the very rich semantic network. Now it is possible (by using a metaphorical bijection) to create a catalog of General Patterns of Abnormal Structure and Behaviour including software, hardware, biological behavior including animal (ethology) and human behavior, sociological and historical behavior including economics, business and finance, ethics and law, and even behavior of chemical and physical systems. Such “GAPs of Structure and Behavior” may include wait chains, spikes, deadlocks, etc. We provide more specific examples in the forthcoming parts. So we are a few steps closer to realization of my old dangerous idea of a parameterized science of universal memory dumps by the so called science files or might event a general diagnostics discipline.
- Dmitry Vostokov @ DumpAnalysis.org + TraceAnalysis.org -
Posted in Announcements, Anthropology, Biology, Business, Catastrophe Theory, Causality, Chaos, Chemistry, Complexity, Computation, Economics, Ethics, General Abnormal Patterns, General Memory Analysis, General Science, Hardware, History, Humanities, Ideas, Language, Life, Medicine, Physics, Political Economy, Politics, Psychoanalysis, Psychology, Religion, Semantics, Semiotics, Social Media, Social Sciences, Software Generalist Worldview, Software and Business, Software and Economics, Software and History, Software and Industrial Production, Software and Politics, Software and Religion, Software and Science, Software and Sociology, Structural Memory Analysis and Social Sciences, Systems Theory, Systems Thinking | No Comments »
Sunday, April 15th, 2012
After 4 years in print this bestselling title needs an update to address minor changes, include extra examples and reference additional research published in Volumes 2, 3, 4, 5 and 6.
- Title: Memory Dump Analysis Anthology, Volume 1
- Author: Dmitry Vostokov
- Publisher: OpenTask (Summer 2012)
- Language: English
- Product Dimensions: 22.86 x 15.24
- Paperback: 800 pages
- ISBN-13: 978-1-908043-35-1
- Hardcover: 800 pages
- ISBN-13: 978-1-908043-36-8
The cover for both paperback and hardcover titles will also have a matte finish. We used A Memory Window artwork for the back cover.

- Dmitry Vostokov @ DumpAnalysis.org + TraceAnalysis.org -
Posted in Aesthetics of Memory Dumps, Announcements, AntiPatterns, Art, Assembly Language, Best Practices, Books, Bugchecks Depicted, C and C++, Complete Memory Dump Analysis, Computer Science, Crash Dump Analysis, Crash Dump Patterns, Crash Dumps for Dummies, Debugging, Debugging Methodology, Dr. Watson, Escalation Engineering, Fun with Crash Dumps, GDB for WinDbg Users, Hardware, Images of Computer Memory, Kernel Development, Mathematics of Debugging, Memiotics (Memory Semiotics), Memoretics, Memory Dump Analysis Methodology, Memory Space Art, Memory Space Music, Memory Visualization, Minidump Analysis, Multithreading, Pattern-Driven Debugging, Pattern-Driven Software Support, Publishing, Reference, Root Cause Analysis, Science of Memory Dump Analysis, Software Architecture, Software Behavior DNA, Software Behavior Patterns, Software Behavioral Genome, Software Diagnostics, Software Engineering, Software Technical Support, Stack Trace Collection, Testing, Tools, Troubleshooting Methodology, Vista, WinDbg Scripts, WinDbg Tips and Tricks, WinDbg for GDB Users, Windows 7, Windows Data Structures, Windows Server 2008, Windows System Administration, x64 Windows | No Comments »
Wednesday, March 7th, 2012
The following watch came to my attention when I saw an ad at Zurich airport last week:
Tissot Seastar Blue Dial Mens Watch T0664071104700

Good complement to a digital one I have: Teaching binary to decimal conversion.
- Dmitry Vostokov @ DumpAnalysis.org + TraceAnalysis.org -
Posted in Fun with Crash Dumps, Fun with Debugging, Hardware, Watches for Debugging | No Comments »
Friday, December 17th, 2010
As the new decade is approaching (2011-2020) we would like to make a few previews and predictions:
- Increased complexity of software will bring more methods from biological, social sciences and humanities in addition to existing methods of automated debugging and computer science techniques
- Focus on first fault software problem solving (when aspect)
- Focus on pattern-driven software problem solving (how aspect)
- Fusion of debugging and malware analysis into a unified structural and behavioral pattern framework
- Visual debugging, memory and software trace visualization techniques
- Software maintenance certification
- Focus on domain-driven troubleshooting and debugging tools as a service (debugware TaaS)
- Focus on security issues related to memory dumps and software traces
- New scripting languages and programming language extensions for debugging
- The maturation of the science of memory snapshots and software traces (memoretics)
Imagining is not not limited to the above and more to come and explain in the forthcoming parts.
- Dmitry Vostokov @ DumpAnalysis.org + TraceAnalysis.org -
Posted in Announcements, Anthropology, Archaeology of Computer Memory, Biology, Certification, Computer Science, Countefactual Debugging, Crash Analysis Report Environment (CARE), Crash Dump Analysis, Crash Dump Patterns, DebugWare Patterns, Debugging, Debugging Industry, Debugging Methodology, Debugging Trends, Dublin School of Security, EasyDbg, Economics, Escalation Engineering, Evolution, First Fault Problem Solving, Futuristic Memory Dump Analysis, General Memory Analysis, General Science, Geography, Hardware, Hermeneutics of Memory Dumps and Traces, History, Humanities, Language, Laws of Troubleshooting and Debugging, Logic, Malware Analysis, Malware Patterns, Mathematics of Debugging, Memiotics (Memory Semiotics), Memoretics, Memory Analysis Forensics and Intelligence, Memory Analysis Report System, Memory Dump Analysis and History, Memory Systems Language, Memory Visualization, Paleo-debugging, Pattern Models, Pattern Prediction, Physics, Psychology, Publishing, Science of Memory Dump Analysis, Science of Software Tracing, Security, Social Media, Social Sciences, Software Architecture, Software Behavior Patterns, Software Chorography, Software Chorology, Software Defect Construction, Software Engineering, Software Generalist, Software Maintenance Institute, Software Narrative Fiction, Software Narratology, Software Technical Support, Software Trace Analysis, Software Trace Analysis and History, Software Trace Deconstruction, Software Trace Linguistics, Software Trace Visualization, Software Troubleshooting Patterns, Software Victimology, Statistics, Structural Memory Analysis and Social Sciences, Structural Memory Patterns, Structural Trace Patterns, Systems Thinking, Testing, Tools, Trace Analysis Patterns, Troubleshooting Methodology, Unified Debugging Patterns, Uses of UML, Victimware, Virtualization, Visual Dump Analysis, Windows System Administration, Workaround Patterns | No Comments »
Wednesday, July 14th, 2010
This is a specialization of Blocked Thread pattern where a thread is waiting for a hardware I/O response. For example, a frozen system initialization thread is waiting for a response from one of ACPI general register ports:
kd> kL 100

ChildEBP RetAddr

f7a010bc f74c5a57 hal!READ_PORT_UCHAR+0×7

f7a010c8 f74c5ba4 ACPI!DefReadAcpiRegister+0xa1

f7a010d8 f74b4d78 ACPI!ACPIReadGpeStatusRegister+0×10

f7a010e4 f74b6334 ACPI!ACPIGpeIsEvent+0×14

f7a01100 8054157d ACPI!ACPIInterruptServiceRoutine+0×16

f7a01100 806d687d nt!KiInterruptDispatch+0×3d

f7a01194 804f9487 hal!HalEnableSystemInterrupt+0×79

f7a011d8 8056aac4 nt!KeConnectInterrupt+0×95

f7a011fc f74c987c nt!IoConnectInterrupt+0xf2

f7a0123c f74d13f0 ACPI!OSInterruptVector+0×76

f7a01250 f74b5781 ACPI!ACPIInitialize+0×154

f7a01284 f74cf824 ACPI!ACPIInitStartACPI+0×71

f7a012b0 f74b1e12 ACPI!ACPIRootIrpStartDevice+0xc0

f7a012e0 804ee129 ACPI!ACPIDispatchIrp+0×15a

f7a012f0 8058803b nt!IopfCallDriver+0×31

f7a0131c 805880b9 nt!IopSynchronousCall+0xb7

f7a01360 804f515c nt!IopStartDevice+0×4d

f7a0137c 80587769 nt!PipProcessStartPhase1+0×4e

f7a015d4 804f5823 nt!PipProcessDevNodeTree+0×1db

f7a01618 804f5ab3 nt!PipDeviceActionWorker+0xa3

f7a01630 8068afc6 nt!PipRequestDeviceAction+0×107

f7a01694 80687e48 nt!IopInitializeBootDrivers+0×376

f7a0183c 806862dd nt!IoInitSystem+0×712

f7a01dac 805c61e0 nt!Phase1Initialization+0×9b5

f7a01ddc 80541e02 nt!PspSystemThreadStartup+0×34

00000000 00000000 nt!KiThreadStartup+0×16
kd> r

eax=00000000 ebx=00000000 ecx=00000002 edx=0000100c esi=00000000 edi=867d8008

eip=806d664b esp=f7a010c0 ebp=f7a010c8 iopl=1         nv up ei pl zr na pe nc

cs=0008  ss=0010  ds=0023  es=0023  fs=0030  gs=0000             efl=00001246

hal!READ_PORT_UCHAR+0x7:

806d664b c20400          ret     4
kd> ub eip

hal!KdRestore+0x9:

806d663f cc              int     3

806d6640 cc              int     3

806d6641 cc              int     3

806d6642 cc              int     3

806d6643 cc              int     3

hal!READ_PORT_UCHAR:

806d6644 33c0            xor     eax,eax

806d6646 8b542404        mov     edx,dword ptr [esp+4]

806d664a ec              in      al,dx
kd> version

[...]

System Uptime: 0 days 0:03:42.140

[...]
kd> !thread

THREAD 867c63e8  Cid 0004.0008  Teb: 00000000 Win32Thread: 00000000 RUNNING on processor 0

IRP List:

    867df008: (0006,0190) Flags: 00000000  Mdl: 00000000

Not impersonating

DeviceMap                 e1005460

Owning Process            0       Image:         <Unknown>

Attached Process          867c6660       Image:         System

Wait Start TickCount      39             Ticks: 1839 (0:00:00:18.416)

Context Switch Count      4

UserTime                  00:00:00.000

KernelTime                00:00:00.911

Start Address nt!Phase1Initialization (0x80685928)

Stack Init f7a02000 Current f7a014a4 Base f7a02000 Limit f79ff000 Call 0

Priority 31 BasePriority 8 PriorityDecrement 0 DecrementCount 0

[...]
- Dmitry Vostokov @ DumpAnalysis.org + TraceAnalysis.org -
Posted in Crash Dump Analysis, Crash Dump Patterns, Debugging, Hardware | No Comments »
Sunday, July 11th, 2010
Our future sponsor has been registered in Ireland and has its own independent website and logo: DumpAnalysis.com

More information will be available later this month.
- Dmitry Vostokov @ DumpAnalysis.org + TraceAnalysis.org -
Posted in Announcements, Crash Analysis Report Environment (CARE), Crash Dump Analysis, Crash Dump De-analysis, Debugging, Education and Research, Escalation Engineering, Hardware, Kernel Development, Linux Crash Corner, Mac Crash Corner, Memory Analysis Forensics and Intelligence, Memory Dump Analysis Services, Minidump Analysis, Security, Software Engineering, Software Technical Support, Software Trace Analysis, Testing, Tools, Training and Seminars, Vista, Windows 7, Windows Server 2008, Windows System Administration, x64 Windows | No Comments »
Saturday, May 8th, 2010
Sometimes when a high number of interrupts is reported but there are no signs of an interrupt storm or pending DPCs in a memory dump file it is useful to search for Hardware Activity in running and / or suspected threads. This can be done by examining execution residue left on a thread raw stack. Although found driver activity might not be related to reported problems it can be a useful start for driver elimination procedure for the general recommendation to check drivers for any updates. Here is an example of a thread raw stack with a network card doing “Scatter-Gather” DMA (more extensive example is coming in a separate pattern cooperation case study):
1: kd> !thread

THREAD f7732090 Cid 0000.0000 Teb: 00000000 Win32Thread: 00000000 RUNNING on processor 1

Not impersonating

Owning Process 8089db40 Image: Idle

Attached Process N/A Image: N/A

Wait Start TickCount 0 Ticks: 24437545 (4:10:03:56.640)

Context Switch Count 75624870

UserTime 00:00:00.000

KernelTime 4 Days 08:56:05.125

Stack Init f78b3000 Current f78b2d4c Base f78b3000 Limit f78b0000 Call 0

Priority 0 BasePriority 0 PriorityDecrement 0

ChildEBP RetAddr Args to Child

f3b30c5c 00000000 00000000 00000000 00000000 LiveKdD+0x1c07
1: kd> dds f78b0000 f78b3000

f78b0000 00000000

f78b0004 00000000

f78b0008 00000000

f78b000c 00000000

f78b0010 00000000

[...]

f78b2870 8b3de0d0

f78b2874 80887b75 nt!KiFlushTargetSingleTb+0xd

f78b2878 8b49032c

f78b287c 00000000

f78b2880 2d003202

f78b2884 00000000

f78b2888 00000000

f78b288c 2d003202

f78b2890 8b490302

f78b2894 f78b28a4

f78b2898 80a61456 hal!KfLowerIrql+0x62

f78b289c 2d00320a

f78b28a0 00000000

f78b28a4 8b3de0d0

f78b28a8 8b3e3730

f78b28ac 00341eb0

f78b28b0 f78b2918

f78b28b4 f63fbf78 NetworkAdapterA!SendWithScatterGather+0×318

f78b28b8 8b3de0d0

f78b28bc 8b341eb0

f78b28c0 f78b28d4

f78b28c4 00000000

f78b28c8 80a5f3c0 hal!KfAcquireSpinLock

f78b28cc 00000000

f78b28d0 8b3de0d0

f78b28d4 00000000

f78b28d8 8b3de0d0

f78b28dc 8b3eb730

f78b28e0 005a7340

f78b28e4 f78b294c

f78b28e8 f63fbf78 NetworkAdapterA!SendWithScatterGather+0×318

f78b28ec 8b3de0d0

f78b28f0 8a5a7340

f78b28f4 f78b2908

f78b28f8 00000000

f78b28fc 8b3de0d0

f78b2900 8b0f5158

f78b2904 001e2340

f78b2908 f78b2970

f78b290c f63fbf78 NetworkAdapterA!SendWithScatterGather+0×318

f78b2910 8b3de0d0

f78b2914 8b1e2340

f78b2918 f78b292c

f78b291c 00000000

f78b2920 80a5f3c0 hal!KfAcquireSpinLock

f78b2924 00000000

f78b2928 8b3de0d0

f78b292c 00000000

f78b2930 8b3eb700

f78b2934 00000000

f78b2938 00000000

f78b293c 00000000

f78b2940 00000000

f78b2944 00000000

f78b2948 00000000

f78b294c 0a446aa2

f78b2950 f78b29b8

f78b2954 8b0f5158

f78b2958 8b01ce10

f78b295c 00000001

f78b2960 8b3de0d0

f78b2964 80a5f302 hal!HalpPerfInterrupt+0×32

f78b2968 00000001

f78b296c 8b3de0d0

f78b2970 80a5f302 hal!HalpPerfInterrupt+0×32

f78b2974 8b3de302

f78b2978 f78b2988

f78b297c 80a61456 hal!KfLowerIrql+0×62

f78b2980 80a5f3c0 hal!KfAcquireSpinLock

f78b2984 8b3de302

f78b2988 f78b29a4

f78b298c 80a5f44b hal!KfReleaseSpinLock+0xb

f78b2990 f63fbbbf NetworkAdapterA!SendPackets+0×1b3

f78b2994 8a446a90

f78b2998 8b0e8ab0

f78b299c 00000000

f78b29a0 008b29d0

f78b29a4 f78b29bc

f78b29a8 f7163790 NDIS!ndisMProcessSGList+0×90

f78b29ac 8b3de388

f78b29b0 f78b29d0

f78b29b4 00000001

f78b29b8 00000000

f78b29bc f78b29e8

f78b29c0 80a60147 hal!HalBuildScatterGatherList+0×1c7

f78b29c4 8b0e89b0

f78b29c8 00000000

f78b29cc 8a44cde8

f78b29d0 8b1e2340

f78b29d4 8a446aa2

f78b29d8 8b026ca0

f78b29dc 8b1e2340

f78b29e0 8b0e8ab0

f78b29e4 8b0e8ab0

f78b29e8 f78b2a44

f78b29ec f716369f NDIS!ndisMAllocSGList+0xda

f78b29f0 8a44cde8

f78b29f4 8b0e89b0

f78b29f8 8a446a70

f78b29fc 00000000

f78b2a00 00000036

f78b2a04 f7163730 NDIS!ndisMProcessSGList

f78b2a08 8b1e2340

f78b2a0c 00000000

f78b2a10 8a44cde8

f78b2a14 00000218

f78b2a18 8b1e2308

f78b2a1c 00000103

f78b2a20 8b0e8ab0

f78b2a24 8a446a70

f78b2a28 8a44cde8

f78b2a2c 00000036

f78b2a30 8b0e8ab0

f78b2a34 00000036

f78b2a38 00000000

f78b2a3c 00000000

f78b2a40 029a9e02

f78b2a44 f78b2a60

f78b2a48 f71402ff NDIS!ndisMSendX+0×1dd

f78b2a4c 8b490310

f78b2a50 8b1e2340

f78b2a54 8a446a70

f78b2a58 8a9a9e02

f78b2a5c 8a9a9e02

f78b2a60 f78b2a88

f78b2a64 f546c923 tcpip!ARPSendData+0×1a9

f78b2a68 8b3e76c8

f78b2a6c 8b1e2340

f78b2a70 8a9a9ea8

f78b2a74 8b490310

f78b2a78 80888b00 nt!RtlBackoff+0×68

f78b2a7c 8a446a70

f78b2a80 8a446aa2

f78b2a84 8a446a70

f78b2a88 f78b2ab4

f78b2a8c f546ba5d tcpip!ARPTransmit+0×112

f78b2a90 8b490310

f78b2a94 8b1e2340

f78b2a98 8a9a9ea8

f78b2a9c 00000103

f78b2aa0 8a446a70

f78b2aa4 00000000

f78b2aa8 8b342398

f78b2aac 8a47e1f8

f78b2ab0 8b1e2340

f78b2ab4 f78b2bf0

f78b2ab8 f546c4fc tcpip!_IPTransmit+0×866

f78b2abc 8a9a9ebc

f78b2ac0 f78b2b02

f78b2ac4 00000001

[…]
We also do a sanity check for coincidental symbols:
1: kd> ub f63fbf78

NetworkAdapterA!SendWithScatterGather+0x304:

f63fbf64 push    eax

f63fbf65 push    edi

f63fbf66 push    esi

f63fbf67 mov     dword ptr [ebp-44h],ecx

f63fbf6a mov     dword ptr [ebp-3Ch],ecx

f63fbf6d mov     dword ptr [ebp-34h],ecx

f63fbf70 mov     dword ptr [ebp-2Ch],ecx

f63fbf73 call    NetworkAdapterA!PacketRetrieveNicActions (f63facd2)
1: kd> ub f63fbbbf

NetworkAdapterA!SendPackets+0x190:

f63fbb9c cmp     dword ptr [esi+0Ch],2

f63fbba0 jl      NetworkAdapterA!SendPackets+0x19e (f63fbbaa)

f63fbba2 mov     dword ptr [ecx+3818h],eax

f63fbba8 jmp     NetworkAdapterA!SendPackets+0x1a4 (f63fbbb0)

f63fbbaa mov     dword ptr [ecx+438h],eax

f63fbbb0 mov     dl,byte ptr [esi+2BCh]

f63fbbb6 mov     ecx,dword ptr [ebp+8]

f63fbbb9 call    dword ptr [NetworkAdapterA!_imp_KfReleaseSpinLock (f640ca18)]
1: kd> ub 80a60147

hal!HalBuildScatterGatherList+0x1b0:

80a60130 je      hal!HalBuildScatterGatherList+0x1b9 (80a60139)

80a60132 mov     dword ptr [eax+4],1

80a60139 push    dword ptr [ebp+20h]

80a6013c push    eax

80a6013d mov     eax,dword ptr [ebp+0Ch]

80a60140 push    dword ptr [eax+14h]

80a60143 push    eax

80a60144 call    dword ptr [ebp+1Ch]
- Dmitry Vostokov @ DumpAnalysis.org + TraceAnalysis.org -
Posted in Crash Dump Analysis, Crash Dump Patterns, Debugging, Hardware | 2 Comments »
Sunday, April 18th, 2010
OpenTask to offer first 3 volumes of Memory Dump Analysis Anthology in one set:


The set is available exclusively from OpenTask e-Commerce web site starting from June. Individual volumes are also available from Amazon, Barnes & Noble and other bookstores worldwide.
Product information:
- Title: Modern Memory Dump and Software Trace Analysis: Volumes 1-3
- Author: Dmitry Vostokov
- Language: English
- Product Dimensions: 22.86 x 15.24
- Paperback: 1600 pages
- Publisher: Opentask (31 May 2010)
- ISBN-13: 978-1-906717-99-5
Information about individual volumes:
- Dmitry Vostokov @ DumpAnalysis.org + TraceAnalysis.org -
Posted in .NET Debugging, Aesthetics of Memory Dumps, Announcements, AntiPatterns, Art, Assembly Language, Books, Bugchecks Depicted, C and C++, CDA Pattern Classification, CDF Analysis Tips and Tricks, Categorical Debugging, Certification, Citrix, Code Reading, Common Mistakes, Computational Ghosts and Bug Hauntings, Computer Science, Countefactual Debugging, Crash Analysis Report Environment (CARE), Crash Dump Analysis, Crash Dump Patterns, Crash Dumps for Dummies, Data Recovery, DebugWare Patterns, Debugging, Debugging Methodology, Debugging Slang, Deep Down C++, Dictionary of Debugging, Dr. Watson, Education and Research, Escalation Engineering, Fun with Crash Dumps, Futuristic Memory Dump Analysis, GDB for WinDbg Users, Hardware, History, Horrors of Computation, Hyper-V, Intelligent Memory Movement, Kernel Development, Laws of Troubleshooting and Debugging, Mathematics of Debugging, Memiotics (Memory Semiotics), Memoidealism, Memoretics, Memory Analysis Culture, Memory Analysis Forensics and Intelligence, Memory Auralization, Memory Dump Analysis Jobs, Memory Religion (Memorianity), Memory Space Art, Memory Space Music, Memory Systems Language, Memory Visualization, Memuonics, Minidump Analysis, Multithreading, Music for Debugging, Music of Computation, New Acronyms, New Words, Occult Debugging, Philosophy, Psi-computation, Publishing, Science of Memory Dump Analysis, Science of Software Tracing, Security, Software Architecture, Software Defect Construction, Software Engineering, Software Generalist, Software Maintenance Institute, Software Narratology, Software Technical Support, Software Trace Analysis, Software Trace Visualization, Software Tracing for Dummies, Software Victimology, Stack Trace Collection, Testing, Tools, Trace Analysis Patterns, Training and Seminars, Troubleshooting Methodology, Victimware, Virtualization, Vista, Visual Dump Analysis, WinDbg Scripts, WinDbg Tips and Tricks, WinDbg for GDB Users, Windows 7, Windows Server 2008, Windows System Administration | No Comments »
Friday, April 9th, 2010
Plan to start providing training and seminars in my free time. If you are interested please answer these questions (you can either respond here in comments or use this form for private communication http://www.dumpanalysis.org/contact):
- Are you interested in on-site training, prefer traveling or attending webinars?
- Are you interested in software trace analysis as well?
- What specific topics are you interested in?
- What training level (beginner, intermediate, advanced) are you interested in? (please provide an example, if possible)
Additional topics of expertise that can be integrated into training include Source Code Reading and Analysis, Debugging, Windows Architecture, Device Drivers, Troubleshooting Tools Design and Implementation, Multithreading, Deep Down C and C++, x86 and x64 Assembly Language Reading.
Looking forward to your responses. Any suggestions are welcome.
- Dmitry Vostokov @ DumpAnalysis.org + TraceAnalysis.org -
Posted in .NET Debugging, Announcements, AntiPatterns, Assembly Language, Bugchecks Depicted, C and C++, CDA Pattern Classification, CDF Analysis Tips and Tricks, Certification, Code Reading, Common Mistakes, Crash Analysis Report Environment (CARE), Crash Dump Analysis, Crash Dump Patterns, Crash Dumps for Dummies, Data Recovery, DebugWare Patterns, Debugging, Debugging Methodology, Deep Down C++, Education and Research, Escalation Engineering, FreeBSD Crash Corner, GDB for WinDbg Users, Hardware, Hyper-V, Java Debugging, Kernel Development, Laws of Troubleshooting and Debugging, Linux Crash Corner, Mac Crash Corner, Memory Analysis Forensics and Intelligence, Memory Visualization, Minidump Analysis, Multithreading, Security, Software Architecture, Software Defect Construction, Software Engineering, Software Generalist, Software Maintenance Institute, Software Narratology, Software Technical Support, Software Trace Analysis, Software Trace Visualization, Software Tracing for Dummies, Software Victimology, Stack Trace Collection, Testing, Tools, Trace Analysis Patterns, Training and Seminars, Troubleshooting Methodology, Victimware, Virtualization, Vista, Visual Dump Analysis, WinDbg Scripts, WinDbg Tips and Tricks, WinDbg for GDB Users, Windows 7, Windows Server 2008, Windows System Administration, Workaround Patterns | No Comments »
Monday, April 5th, 2010
I’m very pleased to announce that the Korean edition is available:

The book can be found on:
- Dmitry Vostokov @ DumpAnalysis.org + TraceAnalysis.org -
Posted in Announcements, AntiPatterns, Assembly Language, Books, Books (Korean), C and C++, Computer Science, Crash Dump Analysis, Crash Dump Patterns, Crash Dumps for Dummies, Debugging, Dr. Watson, Escalation Engineering, Fun with Crash Dumps, GDB for WinDbg Users, Hardware, Kernel Development, Mathematics of Debugging, Memiotics (Memory Semiotics), Memoretics, Memory Space Music, Memory Visualization, Minidump Analysis, Multithreading, Publishing, Science of Memory Dump Analysis, Security, Software Architecture, Software Engineering, Software Technical Support, Testing, Tools, Troubleshooting Methodology, Virtualization, Vista, WinDbg Scripts, WinDbg Tips and Tricks, WinDbg for GDB Users, Windows Server 2008, Windows System Administration | No Comments »
Sunday, March 21st, 2010
I originally intended to name this blog post as ”What I’m Reading Now” but then decided to show it as another satisfying example of my Mod N Reading technique. During my 7 years in memory dump analysis captivity I didn’t pay much attention to traditional synthetic software engineering (as opposed to analytical software defect research in computer memory) except occasionally writing some troubleshooting tools, describing DebugWare patterns in UML and devising RADII process. A few weeks ago I decided to brush up my engineering skills and read some books that accumulated in my library during last few years. Here is the list of them (debugging triptych of Windows Internals 5th Edition, Advanced Windows Debugging, and Advanced .NET Debugging are on my office table and I read them almost daily so I’m not including them in the list below).
Illustrated Mod N is actually Mod 7 technique where I cycle through 7 topics with 3 books for each topic. Ideally I aim to dedicate one topic per day every week but this is not always possible due to writing and publishing but I still do it in a Mod 7 way even if I skip some days. it usually takes me an hour or two to read carefully 5-10 pages from each of 3 topical books. Here is the current state of the reading round-robin queue (21 books) under my home computer desk:

Here are the topics and corresponding books (with links if you would like to buy them from Amazon):
Multithreading from Computer Science Perspective
Synchronization Algorithms and Concurrent Programming

Modern Multithreading : Implementing, Testing, and Debugging Multithreaded Java and C++/Pthreads/Win32 Programs

The Art of Multiprocessor Programming

Algorithms, Parsing
Algorithms in a Nutshell

Flex & Bison: Text Processing Tools

The Algorithm Design Manual

Statistics
Statistics in a Nutshell: A Desktop Quick Reference

Statistics Hacks: Tips & Tools for Measuring the World and Beating the Odds

Statistics, 4th Edition

C++, STL and Boost
C++ in a Nutshell

Beyond the C++ Standard Library: An Introduction to Boost

C++ Cookbook

Security, Mac OS X
The Rootkit Arsenal: Escape and Evasion in the Dark Corners of the System

The Mac Hacker’s Handbook

Security Engineering: A Guide to Building Dependable Distributed Systems

Code, Games
Programming Language Pragmatics, Third Edition

Game Engine Architecture

Code Complete: A Practical Handbook of Software Construction

Embedded and Real-Time Software Engineering
Designing Embedded Hardware

Bebop to the Boolean Boogie, Third Edition: An Unconventional Guide to Electronics

Software Engineering for Real-Time Systems

- Dmitry Vostokov @ DumpAnalysis.org + TraceAnalysis.org -
Posted in Books, C and C++, Computer Science, Education and Research, Hardware, Mac Crash Corner, Multithreading, Security, Software Architecture, Software Engineering, Software Generalist | No Comments »
Tuesday, March 16th, 2010
I recently got a crying request from a reader of my blog to analyze the source of frequent bugchecks on a newly bought computer running Windows 7. I got 8 kernel minidumps with 5 different bugchecks. However, inspection of the default analysis revealed common Fault Context pattern of high resource consumption flight simulator processes in 6 minidumps. Most fault IPs were showing signs of Wild Code pattern and that most probably implicated Hardware Error (Looks like WinDbg suggests that MISALIGNED_IP implicates hardware). Here is the listing of relevant output fragments with attempts to disassemble code around IP (Instruction Pointer) to see if code make any sense (magenta color means the valid that should have been instead of misaligned code highlighted in red):
Windows 7 Kernel Version 7600 MP (4 procs) Free x86 compatible
Debug session time: Fri Jan  8 20:31:15.121 2010 (GMT+0)

System Uptime: 0 days 2:54:44.916
1: kd> !analyze -v
DRIVER_IRQL_NOT_LESS_OR_EQUAL (d1)
PROCESS_NAME: FlightSimulatorA.exe
CURRENT_IRQL: 2
TRAP_FRAME:  807e6ea4 -- (.trap 0xffffffff807e6ea4)

ErrCode = 00000002

eax=872082a7 ebx=80028d5f ecx=b3348635 edx=87208638 esi=80280001 edi=000082a7

eip=8d613485 esp=807e6f18 ebp=6f248635 iopl=0  nv up ei ng nz na po nc

cs=0008 ss=0010 ds=0023 es=0023 fs=0030 gs=0000 efl=00010282

USBPORT!USBPORT_Xdpc_End+0xa6:

8d613485 897904          mov     dword ptr [ecx+4],edi ds:0023:b3348639=????????

Resetting default scope
STACK_TEXT:

807e6ea4 8d613485 badb0d00 87208638 82a7b334 nt!KiTrap0E+0x2cf

807e6f24 8d613d18 00000000 86358720 86358002 USBPORT!USBPORT_Xdpc_End+0xa6

807e6f48 82aa33b5 8635872c 86358002 00000000 USBPORT!USBPORT_Xdpc_Worker+0x173

807e6fa4 82aa3218 807c6120 87e7e950 00000000 nt!KiExecuteAllDpcs+0xf9

807e6ff4 82aa29dc 9f7e1ce4 00000000 00000000 nt!KiRetireDpcList+0xd5

807e6ff8 9f7e1ce4 00000000 00000000 00000000 nt!KiDispatchInterrupt+0x2c

WARNING: Frame IP not in any known module. Following frames may be wrong.

82aa29dc 00000000 0000001a 00d6850f bb830000 0x9f7e1ce4
Debug session time: Fri Jan  8 20:42:16.395 2010 (GMT+0)

System Uptime: 0 days 0:10:22.815
2: kd> !analyze -v
DRIVER_IRQL_NOT_LESS_OR_EQUAL (d1)
CURRENT_IRQL: 2
TRAP_FRAME:  8d91cbc4 -- (.trap 0xffffffff8d91cbc4)

ErrCode = 00000002

eax=00000000 ebx=8d901a00 ecx=86570108 edx=86570108 esi=8d905884 edi=86573920

eip=911e5f5d esp=8d91cc38 ebp=8d91cc78 iopl=0 nv up ei pl nz na po nc

cs=0008 ss=0010 ds=0023 es=0023 fs=0030 gs=0000 efl=00010202

HDAudBus!HdaController::NotificationDpc+0×14d:

911e5f5d ff              ???

Resetting default scope
IMAGE_NAME: hardware
2: kd> u HDAudBus!HdaController::NotificationDpc+14d

HDAudBus!HdaController::NotificationDpc+0×14d:

911e5f5d ff              ???

911e5f5e ff              ???

911e5f5f ff6a00          jmp     fword ptr [edx]

911e5f62 6a00            push    0

911e5f64 6a00            push    0

911e5f66 68ff000000      push    0FFh

911e5f6b 6a03            push    3

911e5f6d 6a04            push    4
2: kd> uf HDAudBus!HdaController::NotificationDpc

[...]

HDAudBus!HdaController::NotificationDpc+0x135:

911e5f45 8b45d8          mov     eax,dword ptr [ebp-28h]

911e5f48 c6405400        mov     byte ptr [eax+54h],0

911e5f4c 8b4dd8          mov     ecx,dword ptr [ebp-28h]

911e5f4f 83c148          add     ecx,48h

911e5f52 8a55e7          mov     dl,byte ptr [ebp-19h]

911e5f55 ff1510a01e91    call    dword ptr [HDAudBus!_imp_KfReleaseSpinLock (911ea010)]
HDAudBus!HdaController::NotificationDpc+0x14b:

911e5f5b e909ffffff      jmp     HDAudBus!HdaController::NotificationDpc+0x59 (911e5e69)
HDAudBus!HdaController::NotificationDpc+0x150:

911e5f60 6a00            push    0

911e5f62 6a00            push    0

911e5f64 6a00            push    0

911e5f66 68ff000000      push    0FFh

911e5f6b 6a03            push    3

911e5f6d 6a04            push    4

911e5f6f 6a08            push    8

911e5f71 6a02            push    2

911e5f73 e818180000      call    HDAudBus!HDABusWmiLogETW (911e7790)

911e5f78 8b4df0          mov     ecx,dword ptr [ebp-10h]

911e5f7b 64890d00000000  mov     dword ptr fs:[0],ecx

911e5f82 59              pop     ecx

911e5f83 5f              pop     edi

911e5f84 5e              pop     esi

911e5f85 5b              pop     ebx

911e5f86 8be5            mov     esp,ebp

911e5f88 5d              pop     ebp

911e5f89 c21000          ret     10h
Debug session time: Fri Jan  8 21:32:04.096 2010 (GMT+0)

System Uptime: 0 days 0:49:10.517
1: kd> !analyze -v
KERNEL_MODE_EXCEPTION_NOT_HANDLED_M (1000008e)
Arg1: c000001d, The exception code that was not handled
EXCEPTION_CODE: (NTSTATUS) 0xc000001d - {EXCEPTION} Illegal Instruction An attempt was made to execute an illegal instruction.
TRAP_FRAME:  a99e3644 -- (.trap 0xffffffffa99e3644)

ErrCode = 00000000

eax=000000fe ebx=8556a2b0 ecx=754764cd edx=00000001 esi=858ad008 edi=858ad048

eip=82ada4c2 esp=a99e36b8 ebp=a99e3704 iopl=0 nv up ei ng nz na po nc

cs=0008 ss=0010 ds=0023 es=0023 fs=0030 gs=0000 efl=00010282

nt!IopCompleteRequest+0×3ac:

82ada4c2 02cd            add     cl,ch
PROCESS_NAME: FlightSimulatorA.exe
CURRENT_IRQL: 1
MISALIGNED_IP:

nt!IopCompleteRequest+3ac

82ada4c2 02cd            add     cl,ch
IMAGE_NAME: hardware
1: kd> uf nt!IopCompleteRequest+3ac

nt!IopCompleteRequest+0×3a9:

82ada4bf 82680002        sub     byte ptr [eax],2

82ada4c3 cd82            int     82h

82ada4c5 50              push    eax

82ada4c6 ff75e0          push    dword ptr [ebp-20h]

82ada4c9 57              push    edi

82ada4ca e881830100      call    nt!KeInitializeApc (82af2850)

82ada4cf 6a02            push    2

82ada4d1 6a00            push    0

82ada4d3 ff7628          push    dword ptr [esi+28h]

82ada4d6 57              push    edi

82ada4d7 e8d2830100      call    nt!KeInsertQueueApc (82af28ae)

82ada4dc 33ff            xor     edi,edi

82ada4de eb5f            jmp     nt!IopCompleteRequest+0×429 (82ada53f)
1: kd> ub nt!IopCompleteRequest+3ac

                                  ^ Unable to find valid previous instruction for 'ub nt!IopCompleteRequest+3ac'
Debug session time: Sat Jan  9 07:45:24.155 2010 (GMT+0)

System Uptime: 0 days 2:09:39.576
0: kd> !analyze -v
UNEXPECTED_KERNEL_MODE_TRAP (7f)
Arg1: 0000000d, EXCEPTION_GP_FAULT
PROCESS_NAME: FlightSimulatorA.exe
CURRENT_IRQL: 6
STACK_TEXT:

a24b3bd8 90f9e956 badb0d00 00000000 ddf1ba50 nt!KiSystemFatalException+0xf

a24b3cc4 90f93f2b 00000001 00000004 00000004 HDAudBus!HDABusWmiLogETW+0x1c6

a24b3d08 82a817ad 864a6280 86541000 a24b3d34 HDAudBus!HdaController::Isr+0x2b

a24b3d08 20c40d61 864a6280 86541000 a24b3d34 nt!KiInterruptDispatch+0x6d

WARNING: Frame IP not in any known module. Following frames may be wrong.

1343f8ea 00000000 00000000 00000000 00000000 0x20c40d61
Debug session time: Sat Jan  9 08:52:03.454 2010 (GMT+0)

System Uptime: 0 days 1:05:54.249
0: kd> !analyze -v
IRQL_NOT_LESS_OR_EQUAL (a)
CURRENT_IRQL: 2
PROCESS_NAME: FlightSimulatorA.exe
TRAP_FRAME:  8078adf0 -- (.trap 0xffffffff8078adf0)

ErrCode = 00000002

eax=8632e2a6 ebx=00000000 ecx=880fb200 edx=00000118 esi=00000007 edi=8632e27c

eip=82a0c967 esp=8078ae64 ebp=c1e2baa0 iopl=0 nv up ei ng nz na pe nc

cs=0008 ss=0010 ds=0023 es=0023 fs=0030 gs=0000 efl=00010286

hal!HalBuildScatterGatherList+0xf3:

82a0c967 8901            mov     dword ptr [ecx],eax  ds:0023:880fb200=????????

Resetting default scope
STACK_TEXT:

8078adf0 82a0c967 badb0d00 00000118 82b5f466 nt!KiTrap0E+0x2cf

8078ae78 82a0cc16 880fb218 86379028 8632e260 hal!HalBuildScatterGatherList+0xf3

8078aea8 909b3e70 8651c6b0 86379028 8632e260 hal!HalGetScatterGatherList+0x26

8078aef4 909b3807 86379028 86379970 00000007 USBPORT!USBPORT_Core_iMapTransfer+0x21e

8078af24 909add18 86379028 86379970 86379002 USBPORT!USBPORT_Core_UsbMapDpc_Worker+0x1e3

8078af48 82aa73b5 8637997c 86379002 00000000 USBPORT!USBPORT_Xdpc_Worker+0x173

8078afa4 82aa7218 82b68d20 88139a98 00000000 nt!KiExecuteAllDpcs+0xf9

8078aff4 82aa69dc 9fd8cce4 00000000 00000000 nt!KiRetireDpcList+0xd5

8078aff8 9fd8cce4 00000000 00000000 00000000 nt!KiDispatchInterrupt+0x2c

WARNING: Frame IP not in any known module. Following frames may be wrong.

82aa69dc 00000000 0000001a 00d6850f bb830000 0x9fd8cce4
Debug session time: Sat Jan  9 16:34:48.134 2010 (GMT+0)

System Uptime: 0 days 1:53:05.929
1: kd> !analyze -v
DRIVER_IRQL_NOT_LESS_OR_EQUAL (d1)
CURRENT_IRQL: 2
PROCESS_NAME: firefox.exe
TRAP_FRAME:  bb92449c -- (.trap 0xffffffffbb92449c)

ErrCode = 00000000

eax=000005b4 ebx=0db19ba0 ecx=80000000 edx=00000001 esi=85fdff29 edi=bb924530

eip=8bc7e2c7 esp=bb924510 ebp=bb924638 iopl=0 nv up ei ng nz na po nc

cs=0008 ss=0010 ds=0023 es=0023 fs=0030 gs=0000 efl=00010282

tcpip!TcpBeginTcbSend+0xa83:

8bc7e2c7 eb06            jmp     tcpip!TcpBeginTcbSend+0xa8b (8bc7e2cf)

Resetting default scope
STACK_TEXT:

bb92449c 8bc7e2c7 badb0d00 00000001 00000000 nt!KiTrap0E+0x2cf

bb924638 8bc7d2bf 87b39c78 00000000 00000001 tcpip!TcpBeginTcbSend+0xa83

bb92479c 8bc814b5 87b39c78 00000000 00000001 tcpip!TcpTcbSend+0x426

bb9247bc 8bc7f349 87b39c78 87fa6c38 00000000 tcpip!TcpEnqueueTcbSendOlmNotifySendComplete+0x157

bb92481c 8bc81846 87b39c78 bb92491c 00000000 tcpip!TcpEnqueueTcbSend+0x3ca

bb924838 82a95f8a bb9248c8 96d9c9d2 00000000 tcpip!TcpTlConnectionSendCalloutRoutine+0x17

bb9248a0 8bc80a0b 8bc8182f bb9248c8 00000000 nt!KeExpandKernelStackAndCalloutEx+0x132

bb9248d8 908b5d27 87b39c01 bb924900 85572e18 tcpip!TcpTlConnectionSend+0x73

bb92493c 908bb2e3 00d4f1e0 85572e18 85572eac tdx!TdxSendConnection+0x1d7

bb924958 82a424bc 86236b80 85572e18 862389c0 tdx!TdxTdiDispatchInternalDeviceControl+0x115

bb924970 908d65ca 86d0e0c8 00000000 86238990 nt!IofCallDriver+0x63

WARNING: Stack unwind information not available. Following frames may be wrong.

bb9249c8 908d17f8 86238990 85572e18 85572ed0 aswTdi+0x55ca

bb924a28 82a424bc 862388d8 85572e18 8623f0e8 aswTdi+0x7f8

bb924a40 90935310 8623f030 82a424bc 8623f030 nt!IofCallDriver+0x63

bb924a60 90900a0e 2b1c89ba bb924b20 00000001 aswRdr+0x310

bb924ab0 908ed542 00000000 908ed542 87a5c530 afd!AfdFastConnectionSend+0x2a6

bb924c28 82c608f7 87ec6701 00000001 02b5f8cc afd!AfdFastIoDeviceControl+0x53d

bb924cd0 82c634ac 85a89c10 0000024c 00000000 nt!IopXxxControlFile+0x2d0

bb924d04 82a4942a 00000240 0000024c 00000000 nt!NtDeviceIoControlFile+0x2a

bb924d04 774464f4 00000240 0000024c 00000000 nt!KiFastCallEntry+0x12a

02b5f920 00000000 00000000 00000000 00000000 0x774464f4
1: kd> u 8bc7e2cf

tcpip!TcpBeginTcbSend+0xa8b:

8bc7e2cf 83bd18ffffff00  cmp     dword ptr [ebp-0E8h],0

8bc7e2d6 0f84d1000000    je      tcpip!TcpBeginTcbSend+0xb68 (8bc7e3ad)

8bc7e2dc 8d85f8feffff    lea     eax,[ebp-108h]

8bc7e2e2 3bf8            cmp     edi,eax

8bc7e2e4 0f85c3000000    jne     tcpip!TcpBeginTcbSend+0xb68 (8bc7e3ad)

8bc7e2ea 83bd54ffffff00  cmp     dword ptr [ebp-0ACh],0

8bc7e2f1 0f84b6000000    je      tcpip!TcpBeginTcbSend+0xb68 (8bc7e3ad)

8bc7e2f7 f7433c00002000  test    dword ptr [ebx+3Ch],200000h
Debug session time: Sat Jan  9 19:42:50.817 2010 (GMT+0)

System Uptime: 0 days 3:07:23.612
3: kd> !analyze -v
BUGCODE_USB_DRIVER (fe)

USB Driver bugcheck, first parameter is USB bugcheck code.

Arguments:

Arg1: 00000006, USBBUGCODE_BAD_SIGNATURE An Internal data structure (object)

 has been corrupted.

Arg2: 864b20e0, Object address

Arg3: 4f444648, Signature that was expected

Arg4: 00000000
PROCESS_NAME: System
CURRENT_IRQL: 2
STACK_TEXT:

8d952b8c 90fa1025 000000fe 00000006 864b20e0 nt!KeBugCheckEx+0x1e

8d952ba8 90fa6672 864b20e0 4f444668 4f444648 USBPORT!USBPORT_AssertSig+0x20

8d952bc8 90fa4553 864b2028 85c57d10 82a8b334 USBPORT!USBPORT_FlushAdapterDBs+0x1b

8d952c00 90fa5178 00000001 856e3ab8 87fb98c0 USBPORT!USBPORT_Core_iCompleteDoneTransfer+0x3cb

8d952c2c 90fa89af 864b2028 864b20f0 864b2a98 USBPORT!USBPORT_Core_iIrpCsqCompleteDoneTransfer+0x33b

8d952c54 90fa2d18 864b2028 864b2a98 864b2002 USBPORT!USBPORT_Core_UsbIocDpc_Worker+0xbc

8d952c78 82ab33b5 864b2aa4 864b2002 00000000 USBPORT!USBPORT_Xdpc_Worker+0x173

8d952cd4 82ab3218 8d936120 8d93b800 00000000 nt!KiExecuteAllDpcs+0xf9

8d952d20 82ab3038 00000000 0000000e 00000000 nt!KiRetireDpcList+0xd5

8d952d24 00000000 0000000e 00000000 00000000 nt!KiIdleLoop+0x38
Debug session time: Sun Jan 10 04:06:19.856 2010 (GMT+0)

System Uptime: 0 days 0:23:05.651
1: kd> !analyze -v
PAGE_FAULT_IN_NONPAGED_AREA (50)
PROCESS_NAME: FlightSimulatorB.exe
CURRENT_IRQL: 0
TRAP_FRAME:  a127fa30 -- (.trap 0xffffffffa127fa30)

ErrCode = 00000000

eax=a127fec8 ebx=00000000 ecx=00000011 edx=86488ba0 esi=86488b78 edi=00000000

eip=8b83b87d esp=a127faa4 ebp=a127fab8 iopl=0 nv up ei ng nz na po nc

cs=0008 ss=0010 ds=0023 es=0023 fs=0030 gs=0000 efl=00010282

fltmgr!TreeFindNodeOrParent+0×9:

8b83b87d 0885c974498b    or      byte ptr mcupdate_GenuineIntel!_NULL_IMPORT_DESCRIPTOR <PERF> (mcupdate_GenuineIntel+0×764c9) (8b4974c9)[ebp],al ss:0010:2c716f81=??

Resetting default scope
MISALIGNED_IP:

fltmgr!TreeFindNodeOrParent+9

8b83b87d 0885c974498b    or      byte ptr mcupdate_GenuineIntel!_NULL_IMPORT_DESCRIPTOR <PERF> (mcupdate_GenuineIntel+0x764c9) (8b4974c9)[ebp],al
STACK_TEXT:

a127fa18 82a8d5f8 00000000 8b497414 00000000 nt!MmAccessFault+0x106

a127fa18 8b83b87d 00000000 8b497414 00000000 nt!KiTrap0E+0xdc

a127fab8 8b834340 86488ba4 86e5e458 00000000 fltmgr!TreeFindNodeOrParent+0x9

a127faf8 8b83440a 86488b78 86e5e458 00000000 fltmgr!GetContextFromStreamList+0x50

a127fb14 8b86c6da 86e5e458 86488b78 a127fb40 fltmgr!FltGetStreamContext+0x34

a127fb44 8b866b35 87f30718 a127fb98 a127fba8 fileinfo!FIStreamGet+0x36

a127fbac 8b833aeb 87f30718 a127fbcc a127fbf8 fileinfo!FIPreReadWriteCallback+0xf1

a127fc18 8b83617b a127fc54 85cfd738 a127fcac fltmgr!FltpPerformPreCallbacks+0x34d

a127fc30 8b848c37 0027fc54 8b848ad4 00000000 fltmgr!FltpPassThroughFastIo+0x3d

a127fc74 82c96b32 85cfd738 a127fcb4 00001000 fltmgr!FltpFastIoRead+0x163

a127fd08 82a8a42a 86e484c0 00000000 00000000 nt!NtReadFile+0x2d5

a127fd08 775864f4 86e484c0 00000000 00000000 nt!KiFastCallEntry+0x12a

WARNING: Frame IP not in any known module. Following frames may be wrong.

0202fc8c 00000000 00000000 00000000 00000000 0x775864f4
IMAGE_NAME: hardware
1: kd> u fltmgr!TreeFindNodeOrParent

fltmgr!TreeFindNodeOrParent:

8b83b874 8bff            mov     edi,edi

8b83b876 55              push    ebp

8b83b877 8bec            mov     ebp,esp

8b83b879 8b4508          mov     eax,dword ptr [ebp+8]

8b83b87c 8b08            mov     ecx,dword ptr [eax]

8b83b87e 85c9            test    ecx,ecx

8b83b880 7449            je      fltmgr!TreeFindNodeOrParent+0×57 (8b83b8cb)

8b83b882 8b5510          mov     edx,dword ptr [ebp+10h]
1: kd> ub 8b834340

fltmgr!GetContextFromStreamList+0x37:

8b834327 8bcb            mov     ecx,ebx

8b834329 ff15a4d0838b    call    dword ptr [fltmgr!_imp_ExfAcquirePushLockShared (8b83d0a4)]

8b83432f 33db            xor     ebx,ebx

8b834331 895dfc          mov     dword ptr [ebp-4],ebx

8b834334 ff7510          push    dword ptr [ebp+10h]

8b834337 ff750c          push    dword ptr [ebp+0Ch]

8b83433a 57              push    edi

8b83433b e896750000      call    fltmgr!TreeLookup (8b83b8d6)
1: kd> uf 8b83b8d6

fltmgr!TreeLookup:

8b83b8d6 8bff            mov     edi,edi

8b83b8d8 55              push    ebp

8b83b8d9 8bec            mov     ebp,esp

8b83b8db 8d4510          lea     eax,[ebp+10h]

8b83b8de 50              push    eax

8b83b8df ff7510          push    dword ptr [ebp+10h]

8b83b8e2 ff750c          push    dword ptr [ebp+0Ch]

8b83b8e5 ff7508          push    dword ptr [ebp+8]

8b83b8e8 e887ffffff      call    fltmgr!TreeFindNodeOrParent (8b83b874)

8b83b8ed 48              dec     eax

8b83b8ee f7d8            neg     eax

8b83b8f0 1bc0            sbb     eax,eax

8b83b8f2 f7d0            not     eax

8b83b8f4 234510          and     eax,dword ptr [ebp+10h]

8b83b8f7 5d              pop     ebp

8b83b8f8 c20c00          ret     0Ch
- Dmitry Vostokov @ DumpAnalysis.org + TraceAnalysis.org -
Posted in Crash Dump Analysis, Crash Dump Patterns, Hardware, Minidump Analysis, Windows 7 | No Comments »
Thursday, February 11th, 2010
This is a revised, edited, cross-referenced and thematically organized volume of selected DumpAnalysis.org blog posts about crash dump analysis and debugging written in July 2009 - January 2010 for software engineers developing and maintaining products on Windows platforms, quality assurance engineers testing software on Windows platforms and technical support and escalation engineers dealing with complex software issues. The fourth volume features:
- 13 new crash dump analysis patterns
- 13 new pattern interaction case studies
- 10 new trace analysis patterns
- 6 new Debugware patterns and case study
- Workaround patterns
- Updated checklist
- Fully cross-referenced with Volume 1, Volume 2 and Volume 3
- New appendixes
Product information:
- Title: Memory Dump Analysis Anthology, Volume 4
- Author: Dmitry Vostokov
- Language: English
- Product Dimensions: 22.86 x 15.24
- Paperback: 410 pages
- Publisher: Opentask (30 March 2010)
- ISBN-13: 978-1-906717-86-5
- Hardcover: 410 pages
- Publisher: Opentask (30 April 2010)
- ISBN-13: 978-1-906717-87-2

Back cover features memory space art image: Internal Process Combustion.
- Dmitry Vostokov @ DumpAnalysis.org + TraceAnalysis.org -
Posted in .NET Debugging, Aesthetics of Memory Dumps, Announcements, AntiPatterns, Art, Assembly Language, Books, C and C++, CDA Pattern Classification, CDF Analysis Tips and Tricks, Categorical Debugging, Certification, Citrix, Code Reading, Common Mistakes, Computer Science, Countefactual Debugging, Crash Analysis Report Environment (CARE), Crash Dump Analysis, Crash Dump Patterns, Crash Dumps for Dummies, DebugWare Patterns, Debugging, Debugging Slang, Education and Research, Escalation Engineering, Fun with Crash Dumps, Games for Debugging, Hardware, Horrors of Computation, Hyper-V, Kernel Development, Laws of Troubleshooting and Debugging, Mathematics of Debugging, Memiotics (Memory Semiotics), Memoidealism, Memoretics, Memory Analysis Culture, Memory Analysis Forensics and Intelligence, Memory Dreams, Memory Dump Analysis Jobs, Memory Dumps in Movies, Memory Space Art, Memory Visualization, Memuonics, Minidump Analysis, Multithreading, Music for Debugging, New Acronyms, New Words, Opcodism, Philosophy, Physicalist Art, Publishing, Science Fiction, Science of Memory Dump Analysis, Science of Software Tracing, Security, Software Architecture, Software Defect Construction, Software Engineering, Software Generalist, Software Maintenance Institute, Software Narratology, Software Technical Support, Software Trace Analysis, Software Trace Visualization, Software Tracing for Dummies, Software Victimology, Stack Trace Collection, Testing, Tools, Trace Analysis Patterns, Training and Seminars, Troubleshooting Methodology, Victimware, Virtualization, Vista, Visual Dump Analysis, WinDbg Scripts, WinDbg Tips and Tricks, WinDbg for GDB Users, Windows 7, Windows Server 2008, Windows System Administration, Workaround Patterns | No Comments »
Sunday, December 20th, 2009
“Memory dumps are facts.”
I’m very excited to announce that Volume 3 is available in paperback, hardcover and digital editions:
Memory Dump Analysis Anthology, Volume 3
Table of Contents
In two weeks paperback edition should also appear on Amazon and other bookstores. Amazon hardcover edition is planned to be available in January 2010.
The amount of information was so voluminous that I had to split the originally planned volume into two. Volume 4 should appear by the middle of February together with Color Supplement for Volumes 1-4.
- Dmitry Vostokov @ DumpAnalysis.org -
Posted in .NET Debugging, Aesthetics of Memory Dumps, Announcements, AntiPatterns, Art, Assembly Language, Books, Bugtations, C and C++, CDA Pattern Classification, CDF Analysis Tips and Tricks, Certification, Citrix, Code Reading, Common Mistakes, Computer Science, Crash Dump Analysis, Crash Dump Patterns, Crash Dumps for Dummies, DebugWare Patterns, Debugging, Debugging Slang, Deep Down C++, Education and Research, Escalation Engineering, Fun with Crash Dumps, Hardware, Horrors of Computation, Kernel Development, Mathematics of Debugging, Memiotics (Memory Semiotics), Memoidealism, Memoretics, Memory Analysis Culture, Memory Analysis Forensics and Intelligence, Memory Space Art, Memory Visualization, Minidump Analysis, Multithreading, Philosophy, Poetry, Publishing, Science of Memory Dump Analysis, Science of Software Tracing, Security, Software Architecture, Software Defect Construction, Software Engineering, Software Narratology, Software Technical Support, Software Trace Analysis, Software Trace Visualization, Software Tracing for Dummies, Software Victimology, Stack Trace Collection, Testing, Tools, Trace Analysis Patterns, Training and Seminars, Troubleshooting Methodology, Victimware, Virtualization, Vista, Visual Dump Analysis, WinDbg Scripts, WinDbg Tips and Tricks, WinDbg for GDB Users, Windows 7, Windows Server 2008, Windows System Administration | 1 Comment »
Monday, November 16th, 2009
This is a hardware counterpart of Not My Version pattern. Some problems manifest themselves on different hardware not used at the time of the product testing. In such cases we can look at kernel and complete memory dumps, extract hardware information using !sysinfo command and compare differences. This is similar to Virtualized System pattern and might provide troubleshooting hints. One example, I have seen in the past, involved a graphics intensive application that relied heavily upon hardware acceleration features. It was tested with certain processors and chipsets but after a few years failed to work on one computer despite the same OS image and drivers. !sysinfo command revealed significant hardware differences: the failing client computer was newer faster multiprocessor machine.
- Dmitry Vostokov @ DumpAnalysis.org -
Posted in Crash Dump Analysis, Crash Dump Patterns, Debugging, Hardware, Virtualization | No Comments »
Saturday, September 26th, 2009
This is a revised, edited, cross-referenced and thematically organized volume of selected DumpAnalysis.org blog posts about crash dump analysis and debugging written in October 2008 - June 2009 for software engineers developing and maintaining products on Windows platforms, quality assurance engineers testing software on Windows platforms and technical support and escalation engineers dealing with complex software issues. The third volume features:
- 15 new crash dump analysis patterns
- 29 new pattern interaction case studies
- Trace analysis patterns
- Updated checklist
- Fully cross-referenced with Volume 1 and Volume 2
- New appendixes
Product information:
- Title: Memory Dump Analysis Anthology, Volume 3
- Author: Dmitry Vostokov
- Language: English
- Product Dimensions: 22.86 x 15.24
- Paperback: 404 pages
- Publisher: Opentask (20 December 2009)
- ISBN-13: 978-1-906717-43-8
- Hardcover: 404 pages
- Publisher: Opentask (30 January 2010)
- ISBN-13: 978-1-906717-44-5

Back cover features 3D computer memory visualization image.
- Dmitry Vostokov @ DumpAnalysis.org -
Posted in Announcements, AntiPatterns, Art, Assembly Language, Books, C and C++, CDF Analysis Tips and Tricks, Certification, Citrix, Code Reading, Common Mistakes, Computational Ghosts and Bug Hauntings, Computer Science, Countefactual Debugging, Crash Dump Analysis, Crash Dump Patterns, Crash Dumps for Dummies, DebugWare Patterns, Debugging, Debugging Slang, Deep Down C++, Education and Research, Escalation Engineering, Fun with Crash Dumps, Futuristic Memory Dump Analysis, Games for Debugging, Hardware, Horrors of Computation, Hyper-V, Intelligent Memory Movement, Kernel Development, Mathematics of Debugging, Memiotics (Memory Semiotics), Memoidealism, Memoretics, Memory Analysis Culture, Memory Analysis Forensics and Intelligence, Memory Dreams, Memory Dump Analysis Jobs, Memory Space Music, Memory Visualization, Memuonics, Minidump Analysis, Multithreading, Music for Debugging, New Acronyms, New Words, Occult Debugging, Philosophy, Poetry, Psi-computation, Publishing, Science of Memory Dump Analysis, Science of Software Tracing, Security, Software Architecture, Software Defect Construction, Software Engineering, Software Generalist, Software Narratology, Software Technical Support, Software Trace Analysis, Software Tracing for Dummies, Testing, Tools, Trace Analysis Patterns, Training and Seminars, Troubleshooting Methodology, Virtualization, Vista, Visual Dump Analysis, WinDbg Scripts, WinDbg Tips and Tricks, WinDbg for GDB Users, Windows 7, Windows Server 2008, Windows System Administration | No Comments »
Saturday, September 26th, 2009
DumpAnalysis.org accepts hardware such as laptops for reviewing in relation to their suitability for extreme debugging, virtualization, trace analysis, computer forensics, memory dump analysis, visualization and auralization. If you work for a H/W company like HP, Apple, Dell, Acer, Sony or any other respectable manufacturer please don’t hesitate to forward this post to your management: it could be your company brand or laptop model that debugging and software technical support community chooses next time of upgrade or for T&D / R&D! H/W reviews will be posted on the main portal page which currently has an audience of more than 200,000 unique visitors per year from more than 30,000 network locations (*).
If your company is interested please don’t hesitate to use this contact form:
http://www.dumpanalysis.org/contact
(*) From Google Analytics report.
- Dmitry Vostokov @ DumpAnalysis.org -
Posted in Announcements, Crash Dump Analysis, Debugging, Hardware, Memory Analysis Forensics and Intelligence, Memory Auralization, Memory Visualization, Security, Software Engineering, Software Technical Support, Software Trace Analysis, Testing, Tools, Virtualization, Vista, Visual Dump Analysis, Windows 7, Windows Server 2008, Windows System Administration | No Comments »
Wednesday, July 15th, 2009
I’ve decided to spend a few hours every week reading and / or re-reading various Intel 64 and IA-32 Architectures manuals to keep myself informed in differences between x64 and x86, revive Asmpedia and perhaps even apply gained insights to memory dump analysis. Today I read 2.1 - 2.2.5 sections from Volume 1 and here’s a rough picture of processor families that I assembled after reading:
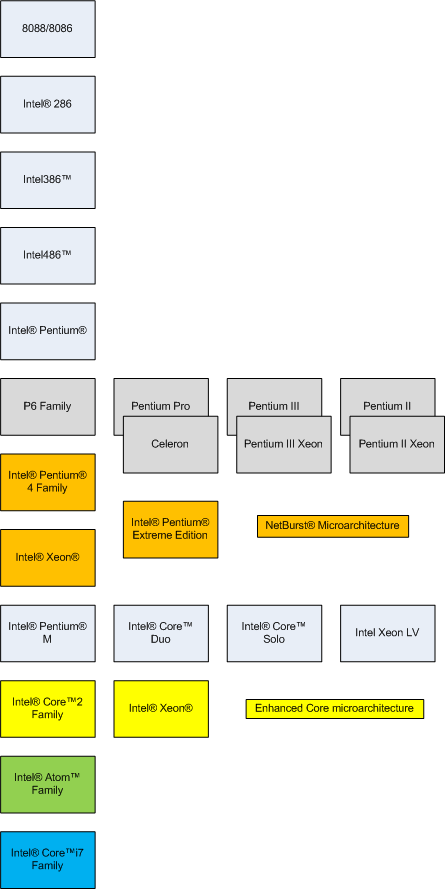
Most of these models and their hardware architecture are discussed in this popular book that I read more than a year ago and still recommend without hesitation:
Inside the Machine
- Dmitry Vostokov @ DumpAnalysis.org -
Posted in Assembly Language, Books, Breakfast with Intel, Hardware, Reading Notebook | No Comments »
Saturday, June 20th, 2009
I was in McDonald’s today with my daughter. This time they popularize Einstein, giving his stature in happy meal packs, telling that the size of his brain was the same as mine. My brain continued to work after meal and I finally understood that the right memory dump is what really matters. Your computer may have 1Tb of memory but if you didn’t get the right dump at the right moment you wasted your time.
- Dmitry Vostokov @ DumpAnalysis.org -
Posted in Crash Dump Analysis, Crash Dumps for Dummies, Fun with Crash Dumps, Hardware | No Comments »
Friday, May 15th, 2009
OpenTask, iterative and incremental publisher, plans to release a guide for general computer users explaining crashes and hangs on personal computers ranging from mobile phones, netbooks and laptops to desktops and servers:
My Computer Crashes and Freezes: A Non-technical Guide to Software and Hardware Errors (ISBN: 978-19067171704)
- Dmitry Vostokov @ DumpAnalysis.org -
Posted in Announcements, Books, Crash Dumps for Dummies, Education and Research, Hardware, Publishing, Windows System Administration | No Comments »