Archive for August, 2021

Trace Analysis Patterns (Part 211)

Sunday, August 29th, 2021

Usually, when we find an interesting message in a log (maybe also a frame from Exception Stack Trace), especially from an unfamiliar component, we also want to search past problem cases either on the Internet or in some internal database. However, we just put the message as is or some small fragment of it we may get a lot of noise results. The problem is to find the optimal Message Essence. Often, this is done by omitting variable data (including Adjoint Thread of Activity fields) but leaving Message Invariants and Trace Constants usually refine a diagnostic error:

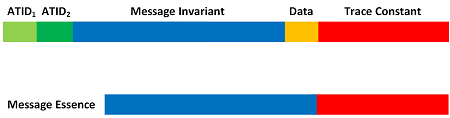
This analysis pattern is different from Message Invariant. where the latter is useful when finding its emitter’s source code lines (PLOT).

- Dmitry Vostokov @ DumpAnalysis.org + TraceAnalysis.org -

Trace Analysis Patterns (Part 210)

Wednesday, August 11th, 2021

When we have different traces and logs not necessarily with the same Trace Schema and select only messages that have some condition, for example, the same ATID (see Adjoint Thread of Activity) or FID (see Feature of Activity) value, we get the new trace that we call Trace Join. A combination of ATID from one trace or Message Set from another is also possible as illustrated in this allegorical picture when joining is done by “Plato” author value or title containing “Plato” (all case-insensitive):

This is very similar to relational data joins. Join of the same trace is possible too. A Dia|gram picture (similar to the previous patterns) is left as an exercise.

We initially wanted to call this analysis pattern Filtered Mask but later realized that it may not be possible to do Trace Mask if there is no global ordering information, such as time. In such a case, Serial Trace is possible. 

- Dmitry Vostokov @ DumpAnalysis.org + TraceAnalysis.org -

Trace Analysis Patterns (Part 209)

Tuesday, August 10th, 2021

The name of this pattern, Container Trace, originates from the logging style that is recommended as the best practice for containers (like Docker), where various components output their tracing and logging statements to the standard console output. Such components may have their own incompatible Trace Schemas, for example, normal trace messages intermingled with Exception Stack Traces. However, in general, this pattern can be extended to any log file (a container for trace statements). This pattern is different from Trace Mask, where individual traces come from separate files and have Trace Schema with some ATID (see Adjoint Thread of Activity) or FID (see Feature of Activity), such as time, that allows for blending them correctly. Components that output their messages to Container Trace may not even have any internal Trace Schema. In such a case, Container Trace may simply be treated as Text Trace.

- Dmitry Vostokov @ DumpAnalysis.org + TraceAnalysis.org -