Archive for September, 2009


Memory Dump and Minidumps
Wednesday, September 30th, 2009Welcome to Physicalist Art that has its foundation in Physicalism. The first physicalist composition was on display today and I took a picture of it (weather condition was not good):
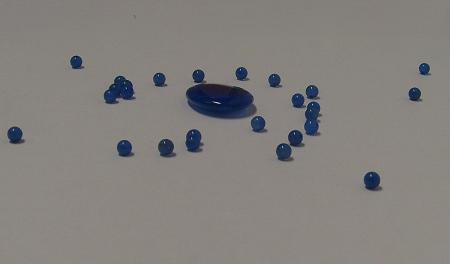
Material: blue agate
It was originally called “Blue in a gate: memory dump and minidumps”. I plan to reinstall it again with more elaborate surroundings.
- Dmitry Vostokov @ DumpAnalysis.org -
The Tsar of Memory Dump Analysis
Wednesday, September 30th, 2009
- Dmitry Vostokov @ DumpAnalysis.org -
What color is your instruction?
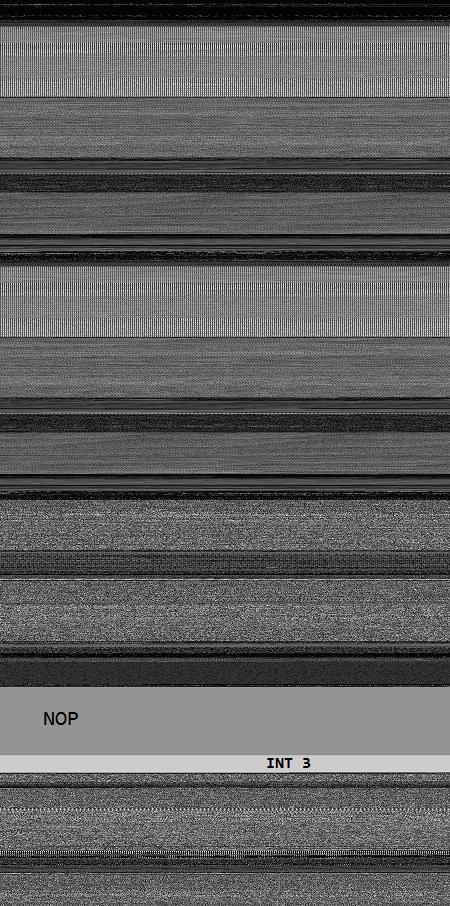
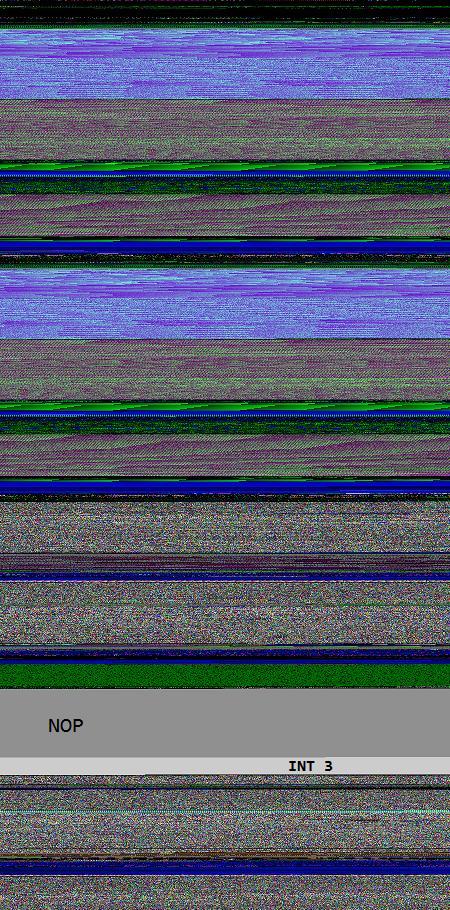
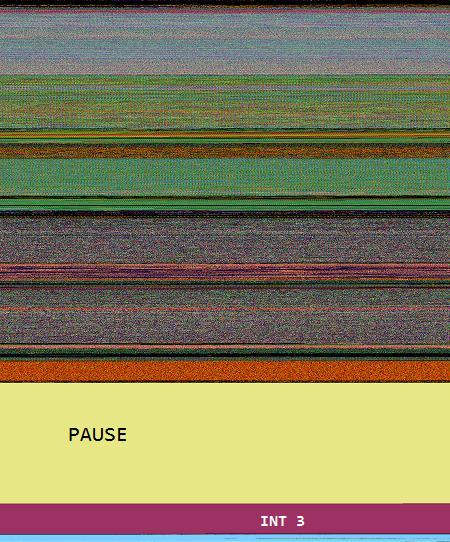
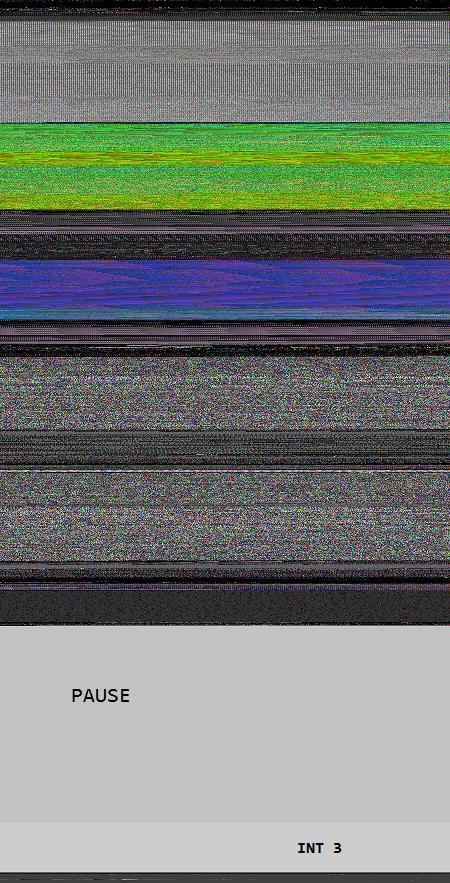
Wednesday, September 30th, 2009Opcodism art is not limited to assembly language code and binary installations. It also provides beautiful color illustrations of processor opcodes and instructions. In this post I provide illustrations of NOP, PAUSE and INT 3 instructions generated by Dump2Picture from memory dump images of crashed 1MbNop and 1MbPause processes.
0:000> lmp

start             end                 module name

00000000`77030000 00000000`7715d000   kernel32

00000000`77230000 00000000`773b6000   ntdll

00000001`40000000 00000001`40144000   1MbNop

000007fe`fd1c0000 000007fe`fd1f5000   apphelp

000007fe`fdaf0000 000007fe`fdc33000   rpcrt4

000007fe`ff400000 000007fe`ff508000   advapi32
8 bit image of 1Mb NOP field fenced by INT 3 wall:
16 bit image of 1Mb NOP field fenced by INT 3 wall:
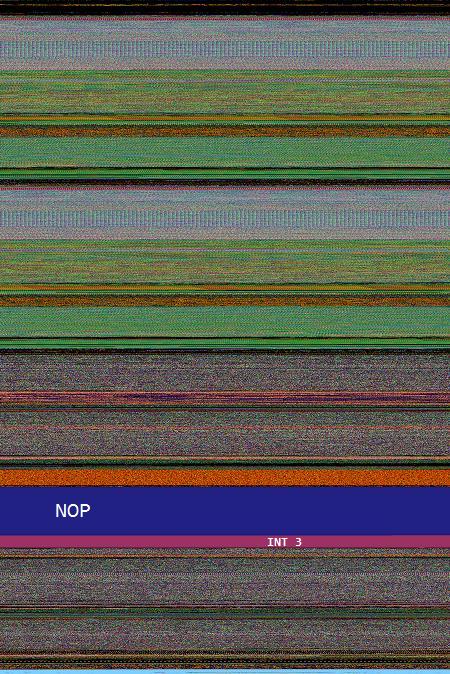
24 bit image of 1Mb NOP field fenced by INT 3 wall:
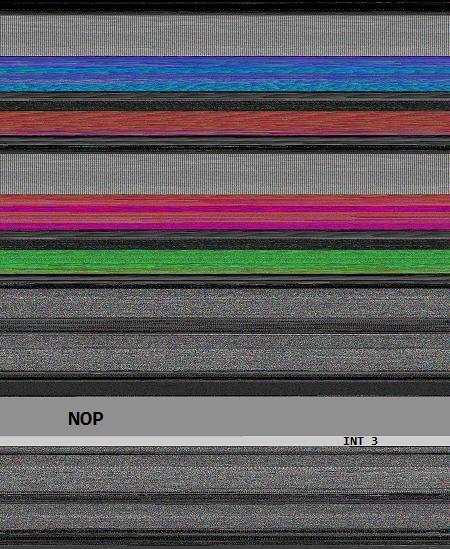
32 bit image of 1Mb NOP field fenced by INT 3 wall:
0:000> lmp

start             end                 module name

00000000`77030000 00000000`7715d000   kernel32

00000000`77230000 00000000`773b6000   ntdll

00000001`40000000 00000001`40284000   1MbPause
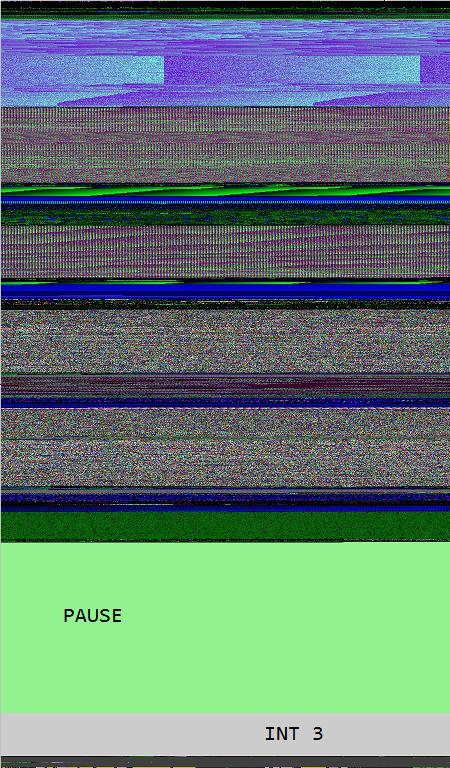
8 bit image of 1Mb PAUSE field fenced by INT 3 wall:
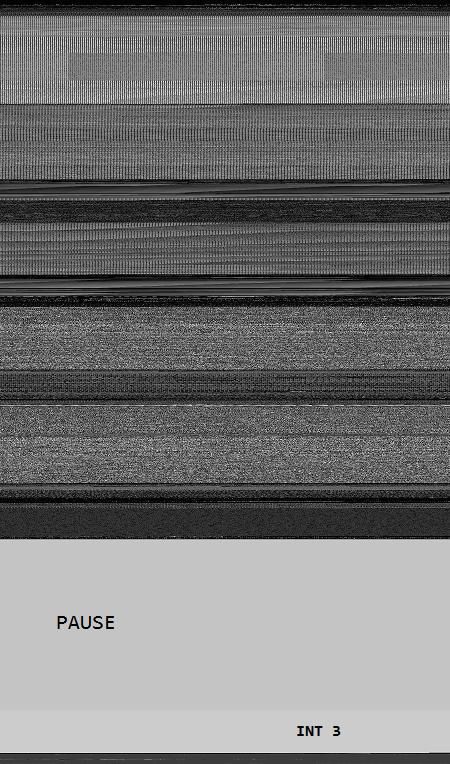
The same as above but PAUSE / INT 3 transition magnified:

16 bit image of 1Mb PAUSE field fenced by INT 3 wall:
24 bit image of 1Mb PAUSE field fenced by INT 3 wall:
The same as above but PAUSE / INT 3 transition magnified:

32 bit image of 1Mb PAUSE field fenced by INT 3 wall:
- Dmitry Vostokov @ DumpAnalysis.org -
Memory Dumping an Idea
Tuesday, September 29th, 2009I always carry my blogging notebook with me. A few weeks ago I was pictured while trying to reach it and write down one of ideas that usually spring to my mind during nature and family walks:

I plan to update The Perfect Gift for a Blogger in Q1, 2010 taking into account my year long experience with it and various accumulated suggestions. It will also have a short Twitter section.
- Dmitry Vostokov @ DumpAnalysis.org -
Dictionary of Debugging: Physical Memory
Tuesday, September 29th, 2009Physical Memory
The linear ordering and numbering of physical memory unit implementations, one-to-one and onto the range [0, M] of addresses:
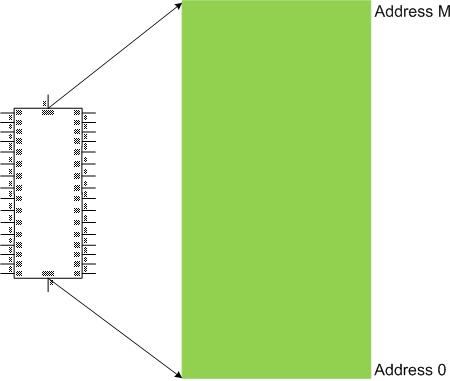
Synonyms: physical space
Antonyms:
Also: memory space, memory dump, memory region, user dump, kernel dump, complete dump, kernel space, virtual memory, user space, generalized kernel space.
- Dmitry Vostokov @ DumpAnalysis.org -
Can Software Tweet?
Monday, September 28th, 2009Every PID has its twitter account. Processes emit short trace messages (STM) and others subscribe to them. This is the technical support of the future, the concept of SoftWeet (*):
(*) to weet
to know; to wit (archaic)
- Dmitry Vostokov @ DumpAnalysis.org -
Opcodism: The Art of Opcodes
Monday, September 28th, 2009Fascinated by Kazimir Malevich’s Black Square I created the new art genre with the following two artistic installations:
A Pause before Crash
This is 1Mb of PAUSE instructions without the point of return:
_text SEGMENT
main PROC
DW 100000h DUP (90f3h)
main ENDP
_text ENDS
END
When launched it crashes:
0:000> kL

Child-SP          RetAddr           Call Site

00000000`0012ff58 00000000`7704be3d 1MbPause+0x201011

00000000`0012ff60 00000000`77256a51 kernel32!BaseThreadInitThunk+0xd

00000000`0012ff90 00000000`00000000 ntdll!RtlUserThreadStart+0x1d
0:000> ub rip

1MbPause+0x201002:

00000001`40201002 f390            pause

00000001`40201004 f390            pause

00000001`40201006 f390            pause

00000001`40201008 f390            pause

00000001`4020100a f390            pause

00000001`4020100c f390            pause

00000001`4020100e f390            pause

00000001`40201010 cc              int     3
You can download the source code, PDB and 64-bit EXE from here:
Do Nothing and Crash
This is 1Mb of NOP instructions without the point of return:
_text SEGMENT
main PROC
DB 100000h DUP (90h)
main ENDP
_text ENDS
END
When launched it crashes too:
0:000> kL

Child-SP          RetAddr           Call Site

00000000`0012ff58 00000000`7704be3d 1MbNop+0x101011

00000000`0012ff60 00000000`77256a51 kernel32!BaseThreadInitThunk+0xd

00000000`0012ff90 00000000`00000000 ntdll!RtlUserThreadStart+0x1d
0:000> ub rip

1MbNop+0x101009:

00000001`40101009 90              nop

00000001`4010100a 90              nop

00000001`4010100b 90              nop

00000001`4010100c 90              nop

00000001`4010100d 90              nop

00000001`4010100e 90              nop

00000001`4010100f 90              nop

00000001`40101010 cc              int     3
You can download the source code, PDB and 64-bit EXE from here:
The earliest opcodism binary was created on October 25th, 2006 that I now call Nothingness and Crash: The Smallest Program.
- Dmitry Vostokov @ DumpAnalysis.org -
Forthcoming Memory Dump Analysis Anthology, Volume 3
Saturday, September 26th, 2009This is a revised, edited, cross-referenced and thematically organized volume of selected DumpAnalysis.org blog posts about crash dump analysis and debugging written in October 2008 - June 2009 for software engineers developing and maintaining products on Windows platforms, quality assurance engineers testing software on Windows platforms and technical support and escalation engineers dealing with complex software issues. The third volume features:
- 15 new crash dump analysis patterns
- 29 new pattern interaction case studies
- Trace analysis patterns
- Updated checklist
- Fully cross-referenced with Volume 1 and Volume 2
- New appendixes
Product information:
- Title: Memory Dump Analysis Anthology, Volume 3
- Author: Dmitry Vostokov
- Language: English
- Product Dimensions: 22.86 x 15.24
- Paperback: 404 pages
- Publisher: Opentask (20 December 2009)
- ISBN-13: 978-1-906717-43-8
- Hardcover: 404 pages
- Publisher: Opentask (30 January 2010)
- ISBN-13: 978-1-906717-44-5

Back cover features 3D computer memory visualization image.
- Dmitry Vostokov @ DumpAnalysis.org -
Laptop Reviews
Saturday, September 26th, 2009DumpAnalysis.org accepts hardware such as laptops for reviewing in relation to their suitability for extreme debugging, virtualization, trace analysis, computer forensics, memory dump analysis, visualization and auralization. If you work for a H/W company like HP, Apple, Dell, Acer, Sony or any other respectable manufacturer please don’t hesitate to forward this post to your management: it could be your company brand or laptop model that debugging and software technical support community chooses next time of upgrade or for T&D / R&D! H/W reviews will be posted on the main portal page which currently has an audience of more than 200,000 unique visitors per year from more than 30,000 network locations (*).
If your company is interested please don’t hesitate to use this contact form:
http://www.dumpanalysis.org/contact
(*) From Google Analytics report.
- Dmitry Vostokov @ DumpAnalysis.org -
Dictionary of Debugging: Kernel Space
Friday, September 25th, 2009Kernel Space
The linear range of memory addresses, a sub-interval of a memory space, comprising from code and data of an operating system computational process or its kernel part. For example, for a memory space [0, M] the kernel space can have the range of [N, M] addresses, where 0 < N < M, as illustrated on the following diagram valid for most of contemporary operating systems:
The memory contents might not be available for specific memory regions of a kernel space.
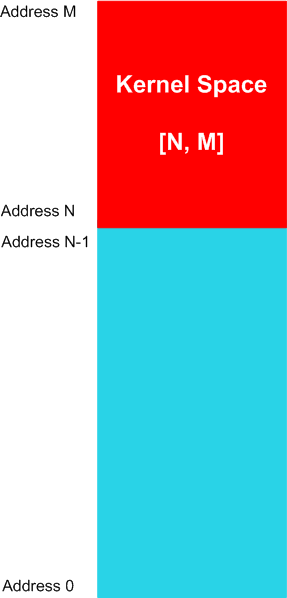
Synonyms:
Antonyms:
Also: memory space, memory dump, memory region, user dump, kernel dump, complete dump, physical memory, virtual memory, user space, generalized kernel space.
- Dmitry Vostokov @ DumpAnalysis.org -
New Open Jobs in Citrix EMEA, Ireland
Thursday, September 24th, 2009The portal jobs page has been updated:
http://www.dumpanalysis.org/jobs
- Dmitry Vostokov @ DumpAnalysis.org -
DebugWare Patterns (Part 9)
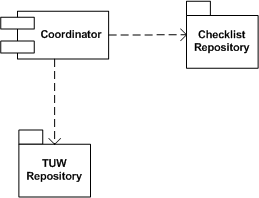
Thursday, September 24th, 2009Real troubleshooting is usually done by combining several units of work chosen from a manual. Checklist pattern summarizes this recurrent practice. Checklist Coordinator orchestrates troubleshooting units of work (TUWs) components from TUW Repository according to checklists from Checklist Repository (in the simple case it can be just one checklist). This is illustrated on the following UML component diagram:
- Dmitry Vostokov @ DumpAnalysis.org -
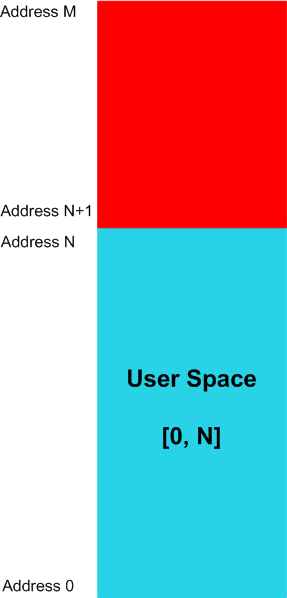
Dictionary of Debugging: User Space
Thursday, September 24th, 2009User Space
The linear range of memory addresses, a sub-interval of a memory space, that computational process instructions can potentially read values from. For example, for a memory space [0, M] the user space can have the range of [0, N] addresses, where N < M, as illustrated on the following diagram valid for most of contemporary operating systems:
The memory contents might not be available for specific memory regions of a user space.
Synonyms:
Antonyms:
Also: memory space, memory dump, memory region, user dump, kernel dump, complete dump, physical memory, virtual memory, kernel space, generalized user space.
- Dmitry Vostokov @ DumpAnalysis.org -
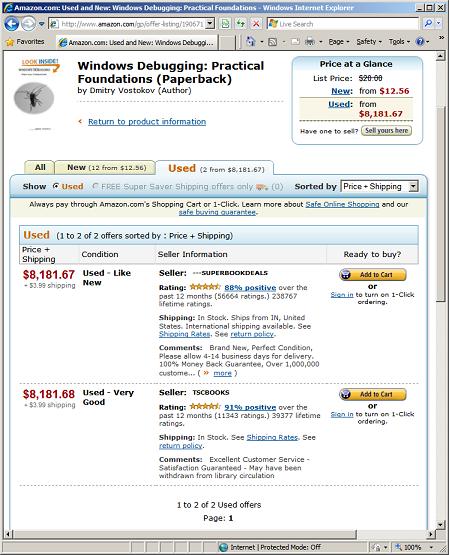
WDPF books gain even more value after being used
Wednesday, September 23rd, 2009I noticed previously that WDPF book gains value after being used but didn’t anticipate the scale of price value leak and spike. Today I noticed that used books gain even more value and now cost more than gold, platinum and iridium (note that the first seller’s price is one cent cheaper, really a super book deal):
- Dmitry Vostokov @ DumpAnalysis.org -
Citrix Go Club
Wednesday, September 23rd, 2009I’m starting a Citrix Go Club. Details will be announced soon. This is not about how to use GoTo Citrixware products (like GoToMyPC) but about Go game playing.
- Dmitry Vostokov @ DumpAnalysis.org -
Clean Raw Stack Execution Residue
Wednesday, September 23rd, 2009I noticed that Visual C++ 2008 Express Edition sometimes starts spiking after building the project and accumulates significant amount of CPU time whent in the background. On my 2 processor machine this additional CPU spike while running Windows Media Player results in sound interruptions so I took this matter seriously and dumped VCExpress.exe process:
0:000:x86> !runaway ff

 User Mode Time

  Thread       Time

   0:b78       0 days 2:51:58.264

  11:f1c       0 days 0:00:02.652

   2:eb0       0 days 0:00:00.031

  13:ed8       0 days 0:00:00.015

   8:eac       0 days 0:00:00.015

  16:8c0       0 days 0:00:00.000

  15:fb8       0 days 0:00:00.000

  14:e04       0 days 0:00:00.000

  12:8c4       0 days 0:00:00.000

  10:c1c       0 days 0:00:00.000

   9:854       0 days 0:00:00.000

   7:d4c       0 days 0:00:00.000

   6:ce4       0 days 0:00:00.000

   5:edc       0 days 0:00:00.000

   4:ac0       0 days 0:00:00.000

   3:a44       0 days 0:00:00.000

   1:6dc       0 days 0:00:00.000

 Kernel Mode Time

  Thread       Time

   0:b78       0 days 0:00:44.039

  11:f1c       0 days 0:00:00.358

   2:eb0       0 days 0:00:00.062

   8:eac       0 days 0:00:00.031

  16:8c0       0 days 0:00:00.000

  15:fb8       0 days 0:00:00.000

  14:e04       0 days 0:00:00.000

  13:ed8       0 days 0:00:00.000

  12:8c4       0 days 0:00:00.000

  10:c1c       0 days 0:00:00.000

   9:854       0 days 0:00:00.000

   7:d4c       0 days 0:00:00.000

   6:ce4       0 days 0:00:00.000

   5:edc       0 days 0:00:00.000

   4:ac0       0 days 0:00:00.000

   3:a44       0 days 0:00:00.000

   1:6dc       0 days 0:00:00.000

 Elapsed Time

  Thread       Time

   0:b78       0 days 23:42:40.899

   1:6dc       0 days 23:42:33.955

   4:ac0       0 days 23:42:33.941

   3:a44       0 days 23:42:33.941

   2:eb0       0 days 23:42:33.941

   5:edc       0 days 23:42:33.629

   6:ce4       0 days 23:42:33.460

   7:d4c       0 days 23:42:33.213

   8:eac       0 days 23:42:31.676

   9:854       0 days 23:41:18.544

  10:c1c       0 days 23:41:18.539

  11:f1c       0 days 23:40:25.753

  13:ed8       0 days 23:40:14.118

  12:8c4       0 days 23:40:14.118

  14:e04       0 days 23:40:13.104

  15:fb8       0 days 23:40:00.417

  16:8c0       0 days 0:03:06.893
The stack was not interesting and looked the same as if we just launched the process without any spikes:
0:000:x86> kL

ChildEBP RetAddr

0040f8fc 7651e39b ntdll_77a40000!ZwWaitForMultipleObjects+0x15

0040f998 76628f86 kernel32!WaitForMultipleObjectsEx+0x11d

0040f9ec 6cf38523 user32!RealMsgWaitForMultipleObjectsEx+0x14d

0040fa30 6cfdb9bd msenv!EnvironmentMsgLoop+0x1ea

0040fa5c 6cfdb94d msenv!CMsoCMHandler::FPushMessageLoop+0x86

0040fa84 6cfdb8e9 msenv!SCM::FPushMessageLoop+0xb7

0040faa0 6cfdb8b8 msenv!SCM_MsoCompMgr::FPushMessageLoop+0x28

0040fac0 6cfdbe4e msenv!CMsoComponent::PushMsgLoop+0x28

0040fb58 6cfd7561 msenv!VStudioMainLogged+0x482

0040fb84 0124ee6a msenv!VStudioMain+0xc1

0040fbb0 01248f5e VCExpress!util_CallVsMain+0xff

0040fe8c 0124a3aa VCExpress!CVCExpressId::Run+0x6f6

0040fea8 01254e11 VCExpress!WinMain+0x74

0040ff38 7658eccb VCExpress!operator new[]+0x1a0

0040ff44 77abd24d kernel32!BaseThreadInitThunk+0xe

0040ff84 77abd45f ntdll_77a40000!__RtlUserThreadStart+0x23

0040ff9c 00000000 ntdll_77a40000!_RtlUserThreadStart+0x1b
I looked at the raw stack of the main thread to see if there are any traces (execution residue) of any foreign modules but it was densely populated by past execution histories:
0:000:x86> !wow64exts.info
PEB32: 0x7efde000

PEB64: 0x7efdf000
Wow64 information for current thread:
TEB32: 0x7efdd000

TEB64: 0x7efdb000
32 bit, StackBase   : 0×410000

        StackLimit  : 0×3f4000

        Deallocation: 0×310000
64 bit, StackBase   : 0x24fd20

        StackLimit  : 0x245000

        Deallocation: 0x210000

[...]
0:000:x86> dds 0×3f4000 0×410000

[…]
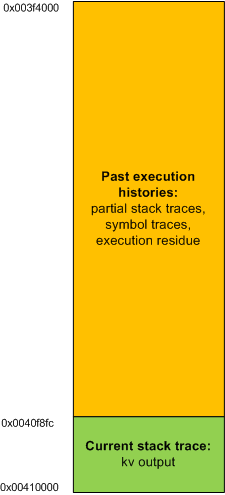
In order to see the execution residue of what was left between two WaitForMultipleObjectsEx calls I ran another instance of VCExpress.exe and reproduced the problem. Then I attached WinDbg to the process. The raw stack beyond the current stack trace portion looked like this (highlighted in blue):
0:000:x86> !wow64exts.info
PEB32: 0x7efde000

PEB64: 0x7efdf000
Wow64 information for current thread:
TEB32: 0x7efdd000

TEB64: 0x7efdb000
32 bit, StackBase   : 0x140000

        StackLimit  : 0×12c000

        Deallocation: 0×40000
64 bit, StackBase   : 0x25fd20

        StackLimit  : 0x256000

        Deallocation: 0x220000

[...]
0:000:x86> dds 0×12c000 0×140000

[…]

0013f810  0013f81c

0013f814  6d820e81 msenv!CEditView::CharIndexFromViewCol+0xd

0013f818  00000024

0013f81c  0013f844

0013f820  6d84bbca msenv!CEditView::GetSelectionSpan+0×92

0013f824  00000024

0013f828  0013f86c

0013f82c  6d84bafe msenv!CEditView::LocalSpanToBase+0×56

0013f830  00bb65a8

0013f834  00000024

0013f838  00000000

0013f83c  0013f8d4

0013f840  00000001

0013f844  0013f948

0013f848  00000001

0013f84c  6d84bb3f msenv!CEditView::CViewInterfaceWrapper::GetSelectionSpan+0×41

0013f850  00000000

0013f854  6d84b80f msenv!ATL::CComObject<CEditView>::Release+0×17

0013f858  00bb9488

0013f85c  00000000

0013f860  00000001

0013f864  0013f870

0013f868  6d84b871 msenv!CEditView::CViewInterfaceWrapper::Release+0×1c

0013f86c  00bb93e0

0013f870  0013f884

0013f874  6d91c8fc msenv!COutputWindow::GetSelectionSpan+0×3f

0013f878  00bb9b0c

0013f87c  079f565c

0013f880  00000000

0013f884  77a899fd ntdll_77a40000!ZwWaitForMultipleObjects+0×15

0013f888  7651e39b KERNEL32!WaitForMultipleObjectsEx+0×11d

0013f88c  00000001

0013f890  0013f8d4

0013f894  00000001

0013f898  00000001

0013f89c  00000000

0013f8a0  31c3f2b0

0013f8a4  00000000

0013f8a8  00000001

0013f8ac  0013f948

0013f8b0  00000024

0013f8b4  00000001

0013f8b8  00000000

0013f8bc  00000000

0013f8c0  00000030

0013f8c4  ffffffff

0013f8c8  ffffffff

0013f8cc  765315ef KERNEL32!WaitForMultipleObjectsEx+0×33

0013f8d0  00000000

0013f8d4  00000050

0013f8d8  00000000

0013f8dc  0013f914

0013f8e0  6d8386ed msenv!CMsoCMHandler::FContinueIdle+0×25

0013f8e4  0013f8f8

0013f8e8  00000000

0013f8ec  00000000

[…]
Then I cleared the portion of the raw stack from the limit to 0013f880 address:
0:000:x86> kL

ChildEBP RetAddr

0013f884 7651e39b ntdll_77a40000!ZwWaitForMultipleObjects+0×15

0013f998 76628f86 kernel32!WaitForMultipleObjectsEx+0×11d

0013f9ec 6cf38523 user32!RealMsgWaitForMultipleObjectsEx+0×14d

0013fa30 6cfdb9bd msenv!EnvironmentMsgLoop+0×1ea

0013fa5c 6cfdb94d msenv!CMsoCMHandler::FPushMessageLoop+0×86

0013fa84 6cfdb8e9 msenv!SCM::FPushMessageLoop+0xb7

0013faa0 6cfdb8b8 msenv!SCM_MsoCompMgr::FPushMessageLoop+0×28

0013fac0 6cfdbe4e msenv!CMsoComponent::PushMsgLoop+0×28

0013fb58 6cfd7561 msenv!VStudioMainLogged+0×482

0013fb84 0124ee6a msenv!VStudioMain+0xc1

0013fbb0 01248f5e VCExpress!util_CallVsMain+0xff

0013fe8c 0124a3aa VCExpress!CVCExpressId::Run+0×6f6

0013fea8 01254e11 VCExpress!WinMain+0×74

0013ff38 7658eccb VCExpress!operator new[]+0×1a0

0013ff44 77abd24d kernel32!BaseThreadInitThunk+0xe

0013ff84 77abd45f ntdll_77a40000!__RtlUserThreadStart+0×23

0013ff9c 00000000 ntdll_77a40000!_RtlUserThreadStart+0×1b
0:000:x86> f 0012c000 0013f884-4 0

Filled 0×13881 bytes
0:000:x86> dds 0×12c000 0×140000

[…]

0013f810  00000000

0013f814  00000000

0013f818  00000000

0013f81c  00000000

0013f820  00000000

0013f824  00000000

0013f828  00000000

0013f82c  00000000

0013f830  00000000

0013f834  00000000

0013f838  00000000

0013f83c  00000000

0013f840  00000000

0013f844  00000000

0013f848  00000000

0013f84c  00000000

0013f850  00000000

0013f854  00000000

0013f858  00000000

0013f85c  00000000

0013f860  00000000

0013f864  00000000

0013f868  00000000

0013f86c  00000000

0013f870  00000000

0013f874  00000000

0013f878  00000000

0013f87c  00000000

0013f880  00000000

0013f884  77a899fd ntdll_77a40000!ZwWaitForMultipleObjects+0×15

0013f888  7651e39b KERNEL32!WaitForMultipleObjectsEx+0×11d

0013f88c  00000001

0013f890  0013f8d4

0013f894  00000001

0013f898  00000001

0013f89c  00000000

0013f8a0  31c3f2b0

0013f8a4  00000000

0013f8a8  00000001

0013f8ac  0013f948

0013f8b0  00000024

0013f8b4  00000001

0013f8b8  00000000

0013f8bc  00000000

0013f8c0  00000030

0013f8c4  ffffffff

0013f8c8  ffffffff

0013f8cc  765315ef KERNEL32!WaitForMultipleObjectsEx+0×33

0013f8d0  00000000

0013f8d4  00000050

0013f8d8  00000000

0013f8dc  0013f914

0013f8e0  6d8386ed msenv!CMsoCMHandler::FContinueIdle+0×25

0013f8e4  0013f8f8

0013f8e8  00000000

0013f8ec  00000000

[…]
and put a breakpoint on the return address of msenv!EnvironmentMsgLoop (6cf38523):
0:000:x86> bp 6cf38523
0:000:x86> g

Breakpoint 0 hit

msenv!EnvironmentMsgLoop+0x1ea:

6cf38523 e92b90feff      jmp     msenv!EnvironmentMsgLoop+0x1ea (6cf38553)
Then I was able to see the execution residue for just one iteration of the message loop.
0:000:x86> dds 0x12c000 0x140000

[...]
- Dmitry Vostokov @ DumpAnalysis.org -
Games for Debugging: Go
Wednesday, September 23rd, 2009While reading “Beyond AI” book this lunch I ultimately realised that Go game of memory (resource) acquisition and pattern recognition is my current favourite choice (perhaps g WinDbg command had its share of influence too):
http://en.wikipedia.org/wiki/Go_(game)
If you have any other suggestions please let me know. I haven’t played any computer game since 1991 when I enjoyed Wing Commander and another intergalactic war game (I don’t remember its title) on IBM PS/2 with 20Mb HDD and 2Mb of memory. I remember students from Inorganic Chemistry division of Chemistry Department of Moscow State University queued to play under my supervision because everyone had only 1Mb on there IBM AT systems.
- Dmitry Vostokov @ DumpAnalysis.org -
One-time and Recurrent Bestsellers
Wednesday, September 23rd, 2009Today one colleague asked me why my books are no longer #1 and #2. Here is my explanation:
Amazon sales rank is updated hourly. If someone buys a book or two now the rating goes up. The most important thing that some books are top for a long time periodically. I see MDAA Volume 1 from time to time on top for 1.5 years. Many books become bestsellers once (after a one time marketing effort or due to the novelty effect) and then never recover again.
I set up the following widget for top debugging and windows debugging books:
http://www.dumpanalysis.org/debugging-bestsellers
http://www.dumpanalysis.org/windows-debugging-bestsellers
- Dmitry Vostokov @ DumpAnalysis.org -
Bugtation No.105
Tuesday, September 22nd, 2009“A little” debugging “is a dangerous thing;” Debug “deep, or” …
- Dmitry Vostokov @ DumpAnalysis.org -