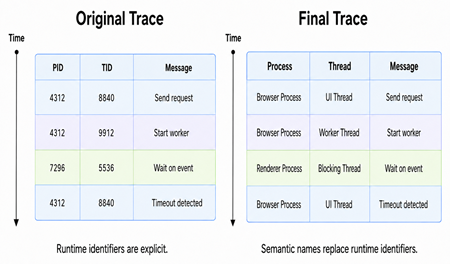
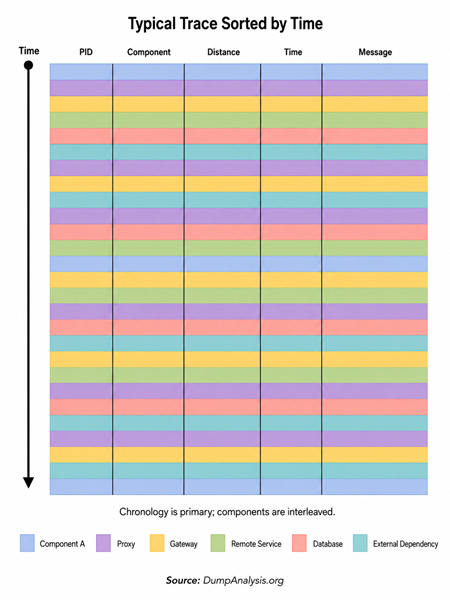
Usually, in traces and logs, messages from different components are highly interleaved. Direct chronological reading may cause confusion because every component’s Adjoint Thread of Activity appears entangled with every other one:
Bethe Ansatz analyzes such a trace by treating requests, threads, agents, transactions, or log-producing entities as “quasi-particles” whose global behavior can be reconstructed from many local pairwise interactions. The inspiration for the pattern name comes from Bethe ansatz, introduced by Hans Bethe in 1931. In physics, it is a method for constructing exact solutions of certain many-body systems: in integrable systems, complex many-body scattering can be represented through factorized two-body scattering processes. In trace analysis, we often face a “many-body” problem: many requests, threads, services, queues, locks, agents, retries, callbacks, and timeouts interact within a single shared diagnostic space. Instead of trying to understand the whole trace as one monolithic event cloud, we decompose it into stable activity lines and pairwise encounters that may explain the global behavior:
The Bethe ansatz has many forms, including coordinate, algebraic, analytic, functional, nested, and thermodynamic variants. For this pattern, the most useful metaphor is the coordinate Bethe ansatz: represent the global state by positions of entities and interaction effects between them. We have the following analogies:
- Particle/excitation: request, thread, transaction, agent, session, workflow
- Coordinate: timestamp, component, hop number, queue position, memory address, trace span
- Momentum/rapidity: (activity) rate, latency class, retry rhythm, priority, causal direction
- Two-body scattering: (pairwise interaction) lock contention, queue wait, API call, resource conflict
- Scattering phase shift: delay, reordered event, changed state, timeout extension, retry offset
- Factorized many-body scattering: whole trace explained as composition of pairwise effects
- Bethe equations: consistency constraints imposed by loops, boundaries, cycles, repeated paths
- Non-integrability: residual behavior not explainable by pairwise interactions
Interactions can be found among Motifs, Macrofunctions, and actors of Activity Theatre.
We suggest the following diagnostic analysis procedure:
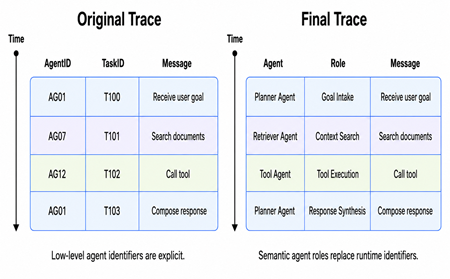
- Identify trace quasi-particles that preserve identity across the trace.
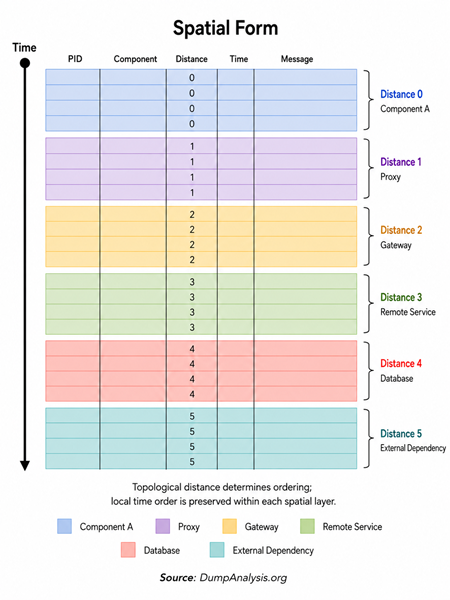
- Choose a coordinate system: the trace can be read through coordinates other than time.
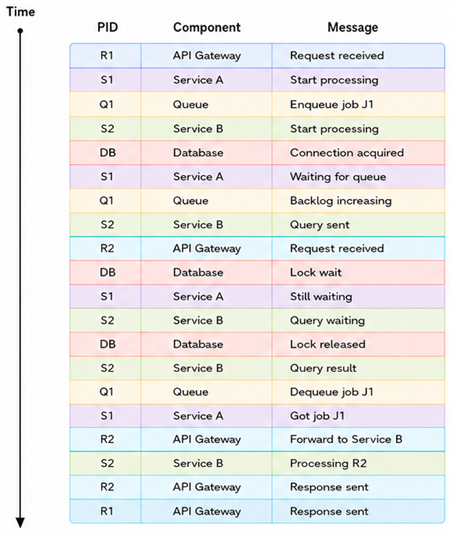
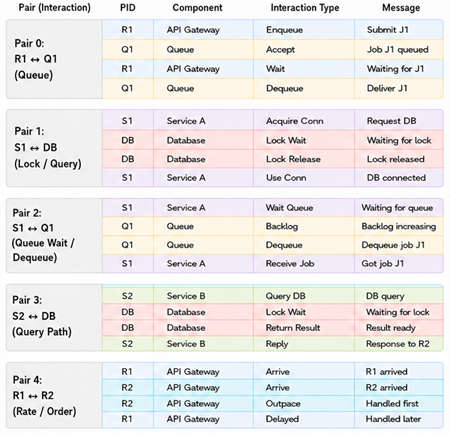
- Detect pairwise encounters: look for places where two entities interact; these are diagnostic “scattering” events.
- Estimate phase shifts where a pairwise encounter often changes the apparent trajectory of an activity. The phase shift is the observable deformation caused by interaction.
- Test factorization by asking the question: Can the global anomaly be explained as a product of pairwise interactions?
If the answer to the last question is yes, then the system is “Bethe-like”: complex but decomposable. If the answer is no, there may be a true many-body effect, such as shared cache collapse, global scheduler starvation, cascading timeout storm, distributed deadlock, correlated retry amplification, emergent agentic loop, or resource exhaustion caused by collective behavior.
Additionally, we can form a Motivic Trace from the resulting pairwise interaction layers. Motivic Trace compresses a trace into explanatory motives. Bethe Ansatz compresses a trace into pairwise interaction motives whose composition reconstructs the observed global behavior. In this sense, Bethe Ansatz can be viewed as a structured route to Motivic Trace: first decompose the tangled chronological trace into stable activity lines and pairwise encounters; then integrate those encounters into higher-level explanatory motives such as queue delay, database lock wait, retry ordering, and response ordering. In summary: Motivic Trace is the broader compression pattern; Bethe Ansatz is a pairwise-factorized way to build it.
A historical note: this analysis pattern also extends physical analogies of debugging.
- Dmitry Vostokov @ DumpAnalysis.org + TraceAnalysis.org -