Archive for the ‘Software Trace Deconstruction’ Category
Sunday, November 9th, 2014
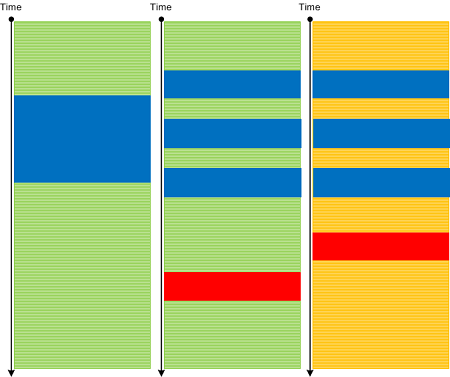
Use cases are implemented in various components such as subsystems, processes, modules, and source code files. Most of the time with good tracing implementation we are able to see Use Case Trails: log messages corresponding to use case scenarios. For simple systems one log may fully correspond to just one use case, but for complex systems, especially distributed client-server ones, there may be several use case instances present simultaneously in one log. One way to disentangle them in the absence of UCID (Use Case ID) or some other grouping tag is to use Event Sequence Phase, the subject of the next pattern.
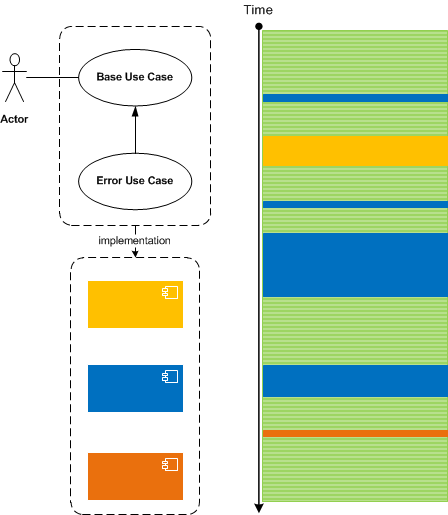
Master Traces may also correspond to use cases but they should ideally correspond to only one use case instance.
- Dmitry Vostokov @ DumpAnalysis.org + TraceAnalysis.org -
Posted in CDF Analysis Tips and Tricks, Debugging, Log Analysis, Software Architecture, Software Trace Analysis, Software Trace Deconstruction, Software Trace Reading, Trace Analysis Patterns | No Comments »
Monday, May 5th, 2014
So far we have been discussing trace analysis patterns related to execution of a particular software version. However, software code changes and also its tracing and logging output: from large scale changes where components are replaced to small scale code refactoring affecting message structure and format. On a software narratological level this corresponds to a narrative about a software trace or log, it evolution. Such Meta Trace analysis pattern is different from Master Trace pattern where the latter is similar to what Metanarrative is usually meant in narratology: a master or grand idea - an expected trace if all functional requirements were correctly identified and implemented during software construction and non-functional ones are met during software execution.
- Dmitry Vostokov @ DumpAnalysis.org + TraceAnalysis.org -
Posted in Code Reading, Debugging, Log Analysis, Software Engineering, Software Narrative Science, Software Narratology, Software Technical Support, Software Trace Analysis, Software Trace Analysis and History, Software Trace Deconstruction, Software Trace Diagramming, Software Trace Reading, Software Trace Visualization, Trace Analysis Patterns | No Comments »
Thursday, March 14th, 2013
If Implementation Discourse focuses on objective technology specific discourse then Traces of Individuality pattern focuses on subjective elements in a software log and its messages. Here we mean some specific naming or tracing conventions either from an individual engineer habit or from some corporate coding standard. As an example of it consider a trace message from a catch statement:
"Surprise, surprise, should have never been caught"
More examples for this pattern will be added later.
- Dmitry Vostokov @ DumpAnalysis.org + TraceAnalysis.org -
Posted in Software Trace Analysis, Software Trace Deconstruction, Software Trace Linguistics, Software Trace Reading, Software Trace Stylistics, Trace Analysis Patterns | No Comments »
Sunday, April 15th, 2012
In a week this short full color book should appear in online bookstores:
- Title: Software Narratology: An Introduction to the Applied Science of Software Stories
- Authors: Dmitry Vostokov, Memory Dump Analysis Services
- Description: This is a transcript of Memory Dump Analysis Services Webinar about Software Narratology: an exciting new discipline and a field of research founded by DumpAnalysis.org. When software executes it gives us its stories in the form of UI events, software traces and logs. Such stories can be analyzed for their structure and patterns for troubleshooting, debugging and problem resolution purposes. Topics also include software narremes and their types, anticipatory software construction and software diagnostics.
- Publisher: OpenTask (April 2012)
- Language: English
- Product Dimensions: 28.0 x 21.6
- Paperback: 26 pages
- ISBN-13: 978-1908043078

- Dmitry Vostokov @ DumpAnalysis.org + TraceAnalysis.org -
Posted in Announcements, Books, CDF Analysis Tips and Tricks, Code Reading, Computer Science, Debugging, Debugging Methodology, Debugging Trends, Education and Research, Escalation Engineering, Event Tracing for Windows (ETW), Hermeneutics of Memory Dumps and Traces, Ideas, Narralog Programming Language, New Debugging School, Pattern-Driven Debugging, Pattern-Driven Software Support, Presentations, Publishing, Root Cause Analysis, SPDL, Science of Software Tracing, Software Behavior DNA, Software Behavior Patterns, Software Behavioral Genome, Software Diagnostics, Software Engineering, Software Narrative Fiction, Software Narrative Science, Software Narratology, Software Narremes, Software Problem Description Patterns, Software Problem Solving, Software Technical Support, Software Trace Analysis, Software Trace Analysis and History, Software Trace Deconstruction, Software Trace Linguistics, Software Trace Modeling, Software Trace Reading, Software Trace Visualization, Software Tracing Implementation Patterns, Software Troubleshooting Patterns, Structural Trace Patterns, Systems Thinking, Testing, Tools, Trace Analysis Patterns, Training and Seminars, Troubleshooting Methodology, UI Problem Analysis Patterns, Unified Debugging Patterns, Unified Software Diagnostics, Webinars | No Comments »
Tuesday, March 20th, 2012
The previous definition of software narratology was restricted to software traces and logs (the top left quadrant on a software narrative square, also the part of Memoretics which studies memory snapshots). Now, with the broadening of the domain of software narratology to the whole world of software narrative stories including actor interactions with software in construction requirements use cases and post-construction incidents we give another definition:
Software narrative is a representation of software events and changes of state. Software Narratology is a discipline that studies such software narratives (software narrative science).
- Dmitry Vostokov @ DumpAnalysis.org + TraceAnalysis.org -
Posted in Announcements, Cloud Computing, Code Reading, Computer Forensics, Computer Science, Crash Dump Analysis, Crash Dump Patterns, Debugging, Memoretics, Science of Memory Dump Analysis, Science of Software Tracing, Software Behavior DNA, Software Behavior Patterns, Software Behavioral Genome, Software Engineering, Software Narrative Science, Software Narratology, Software Narremes, Software Problem Description Patterns, Software Problem Solving, Software Technical Support, Software Trace Analysis, Software Trace Deconstruction, Software Trace Modeling, Software Trace Reading, Structural Trace Patterns, Testing, Trace Analysis Patterns | No Comments »
Sunday, February 19th, 2012
Memory Dump Analysis Services (DumpAnalysis.com) organizes a free Webinar about software narratology: an application of ideas from narratology to software narrative stories.

Learn about this exciting new discipline and a field of research. When software executes it gives us its stories in the form of UI events, software traces and logs. Such stories can be analyzed for their structure and patterns for troubleshooting, debugging and problem resolution purposes.
Prerequisites: basic software troubleshooting and ability to read software generated logs.
Audience: anyone can benefit from this new perspective: from software users to software engineers and managers.
Space is limited.
Reserve your Webinar seat now at:
https://www3.gotomeeting.com/register/603136294
- Dmitry Vostokov @ DumpAnalysis.org + TraceAnalysis.org -
Posted in Announcements, Computer Science, Debugging, Escalation Engineering, Intelligence Analysis Patterns, Memory Dump Analysis Services, SPDL, Science of Software Tracing, Security, Software Behavior DNA, Software Behavior Patterns, Software Behavioral Genome, Software Engineering, Software Narrative Fiction, Software Narratology, Software Problem Description Patterns, Software Problem Solving, Software Technical Support, Software Trace Analysis, Software Trace Deconstruction, Software Trace Linguistics, Software Trace Modeling, Software Trace Reading, Software Trace Visualization, Software Tracing Implementation Patterns, Software Tracing for Dummies, Software Troubleshooting Patterns, Software Victimology, Structural Trace Patterns, Testing, Tools, Trace Analysis Patterns, Troubleshooting Methodology, UI Problem Analysis Patterns, Unified Debugging Patterns, Unit Testing, Victimware, Webinars, Windows System Administration | No Comments »
Saturday, December 17th, 2011
The number of software trace analysis patterns approaches the critical mass of 50 and we have decided to focus on software tracing and logging in the forthcoming year. Some books on tracing including Volume 7 of Memory Dump Analysis Anthology will be published by OpenTask during that year and our efforts will be to further advance software narratology, software trace linguistics, and software trace analysis in the context of memory dump analysis, generative debugging and modeling software behavior.
- Dmitry Vostokov @ DumpAnalysis.org + TraceAnalysis.org -
Posted in Announcements, CDF Analysis Tips and Tricks, Debugging, Generative Debugging, Memoretics, Science of Software Tracing, Software Behavior DNA, Software Behavior Patterns, Software Behavioral Genome, Software Narratology, Software Trace Analysis, Software Trace Analysis and History, Software Trace Deconstruction, Software Trace Linguistics, Software Trace Reading, Software Trace Visualization, Software Tracing Implementation Patterns, Software Tracing for Dummies, Trace Analysis Patterns | No Comments »
Thursday, November 3rd, 2011
The new 6th volume contains revised, edited, cross-referenced, and thematically organized selected DumpAnalysis.org blog posts about memory dump and software trace analysis, software troubleshooting and debugging written in November 2010 - October 2011 for software engineers developing and maintaining products on Windows platforms, quality assurance engineers testing software on Windows platforms, technical support and escalation engineers dealing with complex software issues, and security researchers, malware analysts and reverse engineers. The sixth volume features:
- 56 new crash dump analysis patterns including 14 new .NET memory dump analysis patterns
- 4 new pattern interaction case studies
- 11 new trace analysis patterns
- New Debugware pattern
- Introduction to UI problem analysis patterns
- Introduction to intelligence analysis patterns
- Introduction to unified debugging pattern language
- Introduction to generative debugging, metadefect template library and DNA of software behaviour
- The new school of debugging and trends
- .NET memory dump analysis checklist
- Software trace analysis checklist
- Introduction to close and deconstructive readings of a software trace
- Memory dump analysis compass
- Computical and Stack Trace Art
- The abductive reasoning of Philip Marlowe
- Orbifold memory space and cloud computing
- Memory worldview
- Interpretation of cyberspace
- Relationship of memory dumps to religion
- Fully cross-referenced with Volume 1, Volume 2, Volume 3, Volume 4, and Volume 5
Product information:
- Title: Memory Dump Analysis Anthology, Volume 6
- Author: Dmitry Vostokov
- Language: English
- Product Dimensions: 22.86 x 15.24
- Paperback: 300 pages
- Publisher: Opentask (December 2011)
- ISBN-13: 978-1-908043-19-1
- Hardcover: 300 pages
- Publisher: Opentask (January 2012)
- ISBN-13: 978-1-908043-20-7

Back cover features 3d memory space visualization image created with ParaView.
- Dmitry Vostokov @ DumpAnalysis.org + TraceAnalysis.org -
Posted in .NET Debugging, Announcements, Art, Books, Cloud Computing, Cloud Memory Dump Analysis, Common Mistakes, Complete Memory Dump Analysis, Computer Science, Computicart (Computical Art), Crash Dump Analysis, Crash Dump Patterns, Cyber Intelligence, Cyber Problems, Cyber Security, Cyber Space, Cyber Warfare, DebugWare Patterns, Debugging, Debugging Industry, Debugging Methodology, Debugging Slang, Debugging Trends, Escalation Engineering, Generative Debugging, Intelligence Analysis Patterns, Kernel Development, Memoidealism, Memoretics, Memory Visualization, Metadefect Template Library, New Debugging School, Philosophy, Physicalist Art, Publishing, Root Cause Analysis, Science of Memory Dump Analysis, Science of Software Tracing, Security, Software Behavior DNA, Software Behavior Patterns, Software Behavioral Genome, Software Engineering, Software Narratology, Software Technical Support, Software Trace Analysis, Software Trace Deconstruction, Software Trace Reading, Software Victimology, Testing, The Way of Philip Marlowe, Tools, Trace Analysis Patterns, Training and Seminars, Troubleshooting Methodology, UI Problem Analysis Patterns, Unified Debugging Patterns, Victimware, WinDbg Tips and Tricks, Windows 7, Windows Azure, Windows Data Structures, Windows Server 2008, Windows System Administration, x64 Windows | No Comments »
Wednesday, September 21st, 2011
Memoretics as a science of memory snapshots borrows many ideas from the following disciplines (the list is not exhaustive):
- Troubleshooting and Debugging
- Intelligence Analysis
- Critical Thinking
- Forensics
- Linguistics
- Archaeology
- Psychoanalysis
- History
- Mathematics: Sets and Categories
- Literary Criticism and Narratology
It also contributes many ideas back. The following diagram depicts such an interaction:

- Dmitry Vostokov @ DumpAnalysis.org + TraceAnalysis.org -
Posted in Archaeology of Computer Memory, Categorical Debugging, Computer Forensics, Computer Science, Countefactual Debugging, Crash Dump Analysis, Crash Dump De-analysis, Crash Dump Patterns, Debugging, Debugging Methodology, Dublin School of Security, Education and Research, Escalation Engineering, General Memory Analysis, Generative Debugging, Hermeneutics of Memory Dumps and Traces, History, Intelligence Analysis Patterns, M->analysis, Malware Analysis, Malware Patterns, Mathematics of Debugging, Memiotics (Memory Semiotics), Memoretics, Memory Analysis Forensics and Intelligence, Memory Dump Analysis and History, Memory Systems Language, Memory Visualization, Metadefect Template Library, Metamalware, New Debugging School, Paleo-debugging, Pattern Models, Pattern Prediction, Psychoanalysis of Software Maintenance and Support, Psychology, Reverse Engineering, Root Cause Analysis, Science of Memory Dump Analysis, Science of Software Tracing, Security, Software Architecture, Software Behavior DNA, Software Behavior Patterns, Software Behavioral Genome, Software Chorography, Software Chorology, Software Defect Construction, Software Engineering, Software Narratology, Software Technical Support, Software Trace Analysis, Software Trace Analysis and History, Software Trace Deconstruction, Software Trace Linguistics, Software Trace Reading, Software Trace Visualization, Software Tracing Implementation Patterns, Software Troubleshooting Patterns, Software Victimology, Software and History, Structural Memory Analysis and Social Sciences, Structural Memory Patterns, Structural Trace Patterns, Systems Thinking, Testing, Tools, Trace Analysis Patterns, Troubleshooting Methodology, UI Problem Analysis Patterns, Unified Debugging Patterns, Victimware, Virtualization, Visual Dump Analysis, Workaround Patterns | No Comments »
Friday, December 17th, 2010
As the new decade is approaching (2011-2020) we would like to make a few previews and predictions:
- Increased complexity of software will bring more methods from biological, social sciences and humanities in addition to existing methods of automated debugging and computer science techniques
- Focus on first fault software problem solving (when aspect)
- Focus on pattern-driven software problem solving (how aspect)
- Fusion of debugging and malware analysis into a unified structural and behavioral pattern framework
- Visual debugging, memory and software trace visualization techniques
- Software maintenance certification
- Focus on domain-driven troubleshooting and debugging tools as a service (debugware TaaS)
- Focus on security issues related to memory dumps and software traces
- New scripting languages and programming language extensions for debugging
- The maturation of the science of memory snapshots and software traces (memoretics)
Imagining is not not limited to the above and more to come and explain in the forthcoming parts.
- Dmitry Vostokov @ DumpAnalysis.org + TraceAnalysis.org -
Posted in Announcements, Anthropology, Archaeology of Computer Memory, Biology, Certification, Computer Science, Countefactual Debugging, Crash Analysis Report Environment (CARE), Crash Dump Analysis, Crash Dump Patterns, DebugWare Patterns, Debugging, Debugging Industry, Debugging Methodology, Debugging Trends, Dublin School of Security, EasyDbg, Economics, Escalation Engineering, Evolution, First Fault Problem Solving, Futuristic Memory Dump Analysis, General Memory Analysis, General Science, Geography, Hardware, Hermeneutics of Memory Dumps and Traces, History, Humanities, Language, Laws of Troubleshooting and Debugging, Logic, Malware Analysis, Malware Patterns, Mathematics of Debugging, Memiotics (Memory Semiotics), Memoretics, Memory Analysis Forensics and Intelligence, Memory Analysis Report System, Memory Dump Analysis and History, Memory Systems Language, Memory Visualization, Paleo-debugging, Pattern Models, Pattern Prediction, Physics, Psychology, Publishing, Science of Memory Dump Analysis, Science of Software Tracing, Security, Social Media, Social Sciences, Software Architecture, Software Behavior Patterns, Software Chorography, Software Chorology, Software Defect Construction, Software Engineering, Software Generalist, Software Maintenance Institute, Software Narrative Fiction, Software Narratology, Software Technical Support, Software Trace Analysis, Software Trace Analysis and History, Software Trace Deconstruction, Software Trace Linguistics, Software Trace Visualization, Software Troubleshooting Patterns, Software Victimology, Statistics, Structural Memory Analysis and Social Sciences, Structural Memory Patterns, Structural Trace Patterns, Systems Thinking, Testing, Tools, Trace Analysis Patterns, Troubleshooting Methodology, Unified Debugging Patterns, Uses of UML, Victimware, Virtualization, Visual Dump Analysis, Windows System Administration, Workaround Patterns | No Comments »
Friday, November 12th, 2010
Five volumes of cross-disciplinary Anthology (dubbed by the author “The Summa Memorianica”) lay the foundation of the scientific discipline of Memoretics (study of computer memory snapshots and their evolution in time) that is also called Memory Dump and Software Trace Analysis.ca
The 5th volume contains revised, edited, cross-referenced, and thematically organized selected DumpAnalysis.org blog posts about crash dump, software trace analysis and debugging written in February 2010 - October 2010 for software engineers developing and maintaining products on Windows platforms, quality assurance engineers testing software on Windows platforms, technical support and escalation engineers dealing with complex software issues, and security researchers, malware analysts and reverse engineers. The fifth volume features:
- 25 new crash dump analysis patterns
- 11 new pattern interaction case studies (including software tracing)
- 16 new trace analysis patterns
- 7 structural memory patterns
- 4 modeling case studies for memory dump analysis patterns
- Discussion of 3 common analysis mistakes
- Malware analysis case study
- Computer independent architecture of crash analysis report service
- Expanded coverage of software narratology
- Metaphysical and theological implications of memory dump worldview
- More pictures of memory space and physicalist art
- Classification of memory visualization tools
- Memory visualization case studies
- Close reading of the stories of Sherlock Holmes: Dr. Watson’s observational patterns
- Fully cross-referenced with Volume 1, Volume 2, Volume 3, and Volume 4
Product information:
- Title: Memory Dump Analysis Anthology, Volume 5
- Author: Dmitry Vostokov
- Language: English
- Product Dimensions: 22.86 x 15.24
- Paperback: 400 pages
- Publisher: Opentask (10 December 2010)
- ISBN-13: 978-1-906717-96-4
- Hardcover: 400 pages
- Publisher: Opentask (10 December 2010)
- ISBN-13: 978-1-906717-97-1

Back cover features memory space art image Hot Computation: Memory on Fire.
- Dmitry Vostokov @ DumpAnalysis.org + TraceAnalysis.org -
Posted in Aesthetics of Memory Dumps, Announcements, Archaeology of Computer Memory, Art, Assembly Language, Books, C and C++, CDF Analysis Tips and Tricks, Categorical Debugging, Common Mistakes, Complete Memory Dump Analysis, Computer Science, Crash Analysis Report Environment (CARE), Crash Dump Analysis, Crash Dump De-analysis, Crash Dump Patterns, Debugging, Debugging Methodology, Debugging Slang, Deep Down C++, Dr. Watson, Dublin School of Security, Education and Research, Escalation Engineering, Fun with Crash Dumps, Fun with Debugging, Fun with Software Traces, General Memory Analysis, Hermeneutics of Memory Dumps and Traces, Images of Computer Memory, Kernel Development, Malware Analysis, Malware Patterns, Mathematics of Debugging, Memiotics (Memory Semiotics), Memoidealism, Memoretics, Memory Analysis Culture, Memory Analysis Forensics and Intelligence, Memory Analysis Report System, Memory Diagrams, Memory Dreams, Memory Dump Analysis Jobs, Memory Dump Analysis Services, Memory Dump Analysis and History, Memory Dumps in Movies, Memory Dumps in Myths, Memory Religion (Memorianity), Memory Space Art, Memory Systems Language, Memory Visualization, Memory and Glitches, Memuonics, Metaphysical Society of Ireland, Minidump Analysis, Movies and Debugging, Multithreading, Museum of Debugging, Music for Debugging, Music of Computation, New Acronyms, New Words, Paleo-debugging, Pattern Models, Pattern Prediction, Philosophy, Physicalist Art, Psychoanalysis of Software Maintenance and Support, Publishing, Science of Memory Dump Analysis, Science of Software Tracing, Security, Software Architecture, Software Behavior Patterns, Software Chorography, Software Chorology, Software Defect Construction, Software Engineering, Software Generalist, Software Maintenance Institute, Software Narratology, Software Technical Support, Software Trace Analysis, Software Trace Analysis and History, Software Trace Deconstruction, Software Trace Reading, Software Trace Visualization, Software Tracing for Dummies, Software Troubleshooting Patterns, Software Victimology, Stack Trace Collection, Structural Memory Analysis and Social Sciences, Structural Memory Patterns, Structural Trace Patterns, Systems Thinking, Testing, Theology, Tool Objects, Tools, Trace Analysis Patterns, Training and Seminars, Troubleshooting Methodology, Uses of UML, Victimware, Virtualization, Vista, Visual Dump Analysis, Webinars, WinDbg Scripts, WinDbg Tips and Tricks, WinDbg for GDB Users, Windows 7, Windows Server 2008, Windows System Administration, Workaround Patterns, x64 Windows | No Comments »
Wednesday, November 3rd, 2010
There are two trace reading practices with techniques borrowed from structuralist and post-structuralist narratology:
1. Close reading
- emphasizes structural patterns
- looks at a software trace as a unity of messages
- searches for similarities, repetitions and contrasts
- reveals code reflections in message texts
2. Deconstructive reading
- reveals subconscious exposed in message texts
- searches for conflicting and absent messages
- looks at a software trace as a disunity of messages from conflicting components
- Dmitry Vostokov @ DumpAnalysis.org + TraceAnalysis.org -
Posted in Debugging, Software Behavior Patterns, Software Narratology, Software Trace Analysis, Software Trace Deconstruction, Software Trace Reading, Structural Trace Patterns, Trace Analysis Patterns | No Comments »